Automotive Chassis Dynamometers Market Size and Share
Market Overview
| Study Period | 2019 - 2030 |
|---|---|
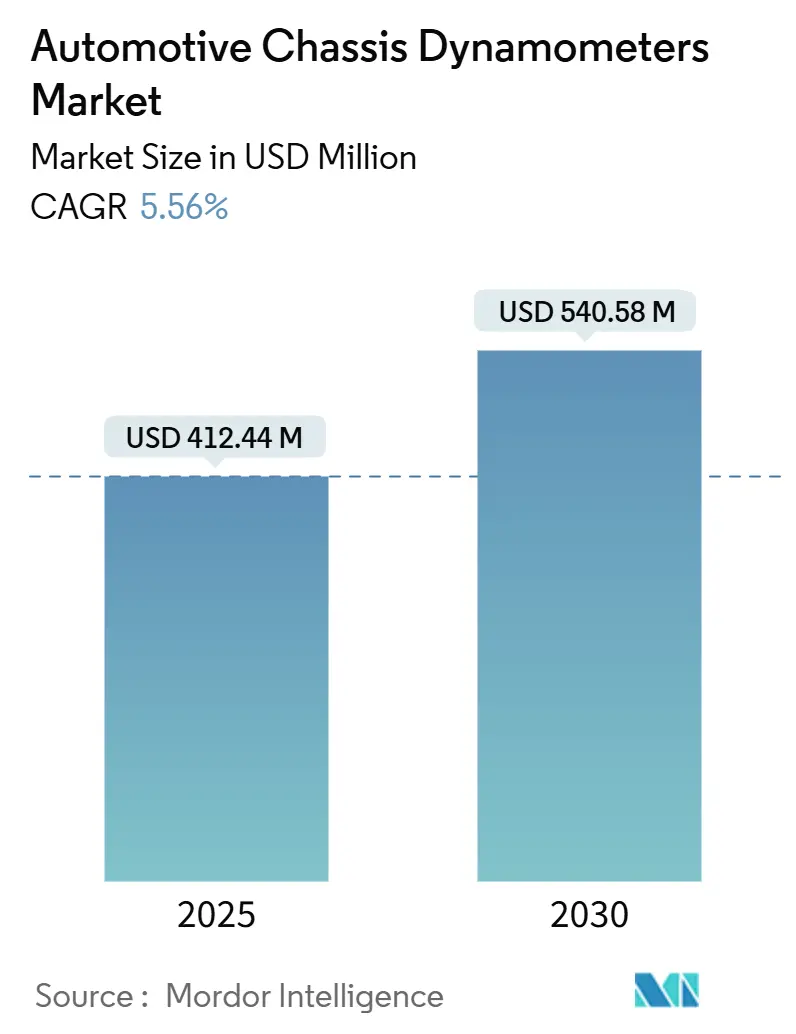
| Market Size (2025) | USD 412.44 Million |
| Market Size (2030) | USD 540.58 Million |
| Growth Rate (2025 - 2030) | 5.56% CAGR |
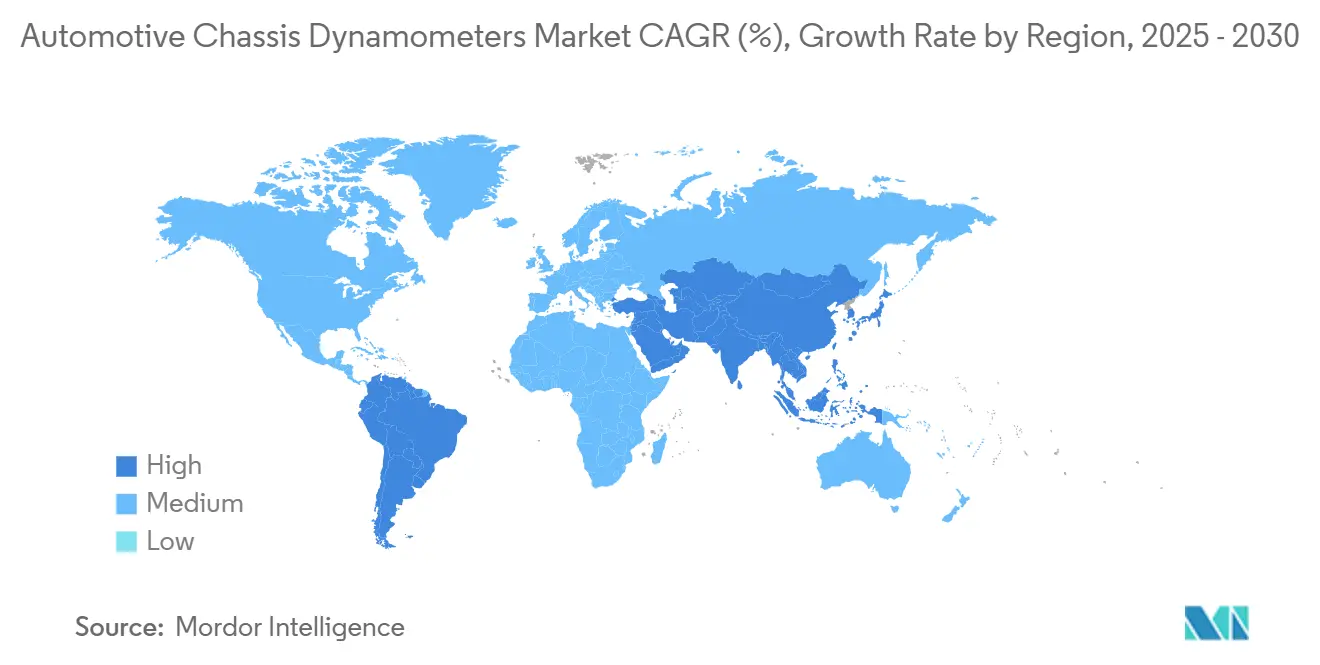
| Fastest Growing Market | South America |
| Largest Market | Asia Pacific |
| Market Concentration | Medium |
Major Players *Disclaimer: Major Players sorted in no particular order Image © Mordor Intelligence. Reuse requires attribution under CC BY 4.0. | |
Automotive Chassis Dynamometers Market Analysis by Mordor Intelligence
The global automotive chassis dynamometers market size reached USD 412.44 million in 2025 and is forecast to climb to USD 540.58 million by 2030, advancing at a 5.56% CAGR. This acceleration stems from tougher worldwide regulations such as Euro 7 and California’s Advanced Clean Cars II that mandate more rigorous real-world emissions and durability checks. Automakers are modernizing laboratories to simulate multi-axle power delivery, regenerative braking, and thermal loads that electric vehicles generate, while test-service providers upgrade equipment to attract outsourced validation work. Supply-chain headwinds, notably the ongoing semiconductor imbalance, delay some installations yet also raise entry barriers, reinforcing the value of proven suppliers with agile procurement strategies. Growing electrification, surging adoption of all-wheel-drive platforms, and the need to correlate virtual models with laboratory results further expand the addressable base for high-precision, software-integrated dynamometer systems.
Key Report Takeaways
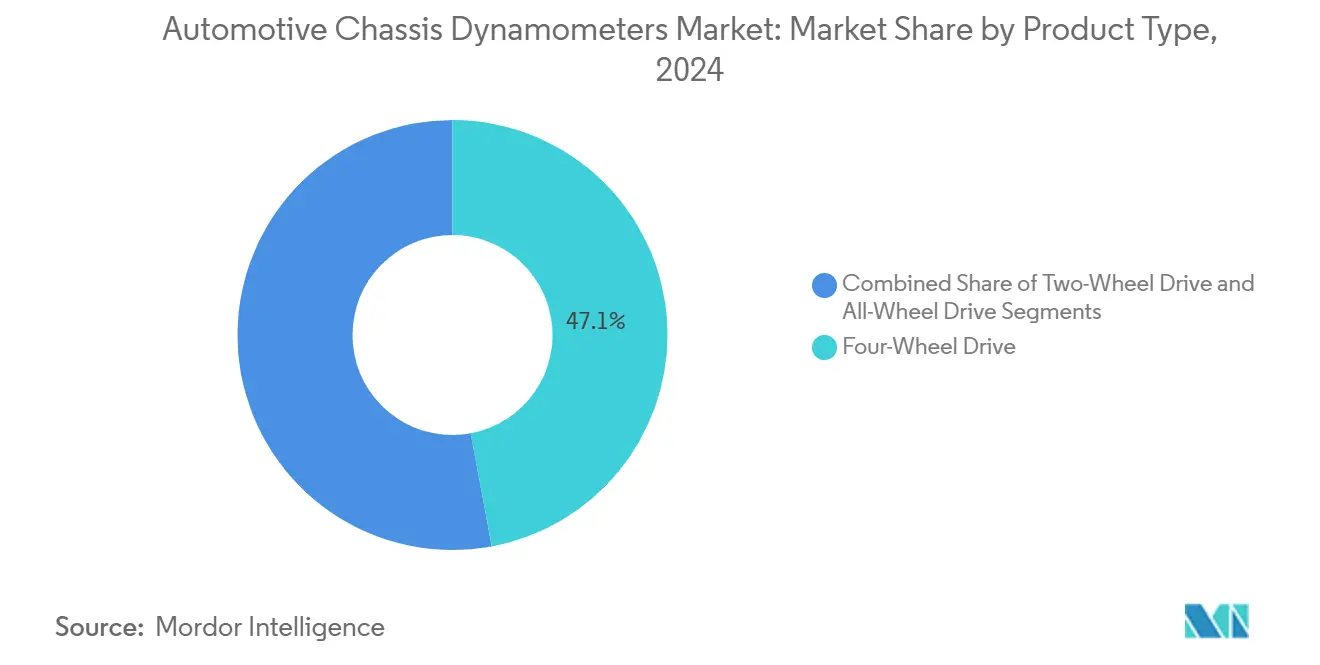
- By product type, four-wheel-drive systems captured 47.08% of the automotive chassis dynamometers market share in 2024, while all-wheel-drive platforms are projected to expand at a 7.96% CAGR to 2030.
- By application, emissions testing accounted for 33.16% of the automotive chassis dynamometers market size in 2024, whereas electric and autonomous component testing is expected to advance at an 11.64% CAGR through 2030.
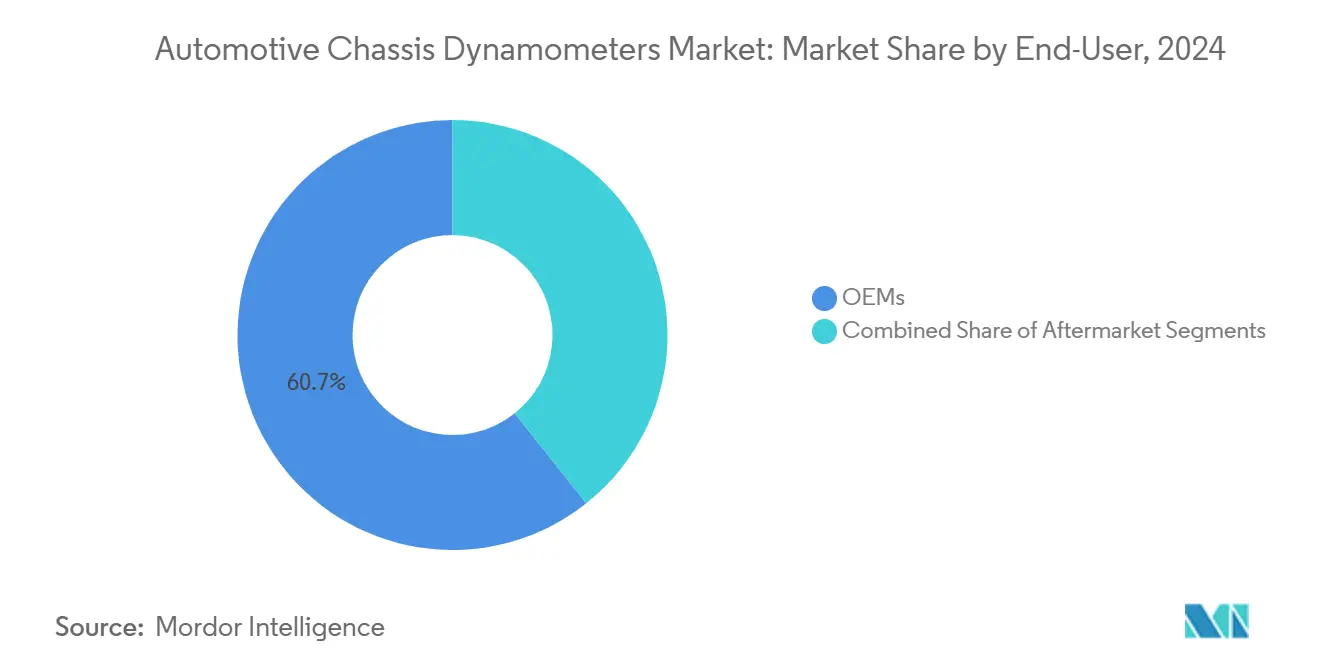
- By end-user, OEM facilities held 60.69% of demand in 2024 and are projected to grow at a 6.33% CAGR through 2030.
- By propulsion type, battery-electric vehicles commanded 43.49% of testing demand in 2024, while fuel-cell electric vehicles are forecast to grow at an 11.54% CAGR between 2025 and 2030.
- By geography, Asia-Pacific contributed 40.32% of 2024 revenue, while South America is projected to grow at a 8.78% CAGR through 2030.
Global Automotive Chassis Dynamometers Market Trends and Insights
Drivers Impact Analysis*
| Driver | (~) % Impact on CAGR Forecast | Geographic Relevance | Impact Timeline |
|---|---|---|---|
| Stringent Emission Regulations | +0.8% | Global, with EU and California leading | Medium term (2-4 years) |
| Rapid EV Production | +0.7% | Asia-Pacific core, spill-over to North America | Short term (≤ 2 years) |
| Rising Performance-Tuning Aftermarket | +0.6% | North America and EU, emerging in Asia | Long term (≥ 4 years) |
| Higher Adoption of 4WD/AWD Platforms | +0.4% | Global, concentrated in premium segments | Medium term (2-4 years) |
| Dynamometers Integration in OTA/HIL Software | +0.4% | North America and EU, expanding to Asia | Short term (≤ 2 years) |
| Low-Noise NVH Dynamometer Demand | +0.3% | Urban centers globally | Medium term (2-4 years) |
| Source: Mordor Intelligence | |||
Stringent Global Emission Regulations Increase Mandatory Dynamometer Testing
Euro 7 takes effect in 2026, unifying pollutant caps across passenger cars, vans, and heavy-duty vehicles while adding brake and tire-wear thresholds. California’s rules demand 35% zero-emission sales by 2026 and 100% by 2035, together with battery-durability metrics set at 80% range retention over 10 years[1]California Air Resources Board, “2023 Annual Evaluation of Fuel-Cell Electric Vehicle Deployment and Hydrogen Fuel Station Network Development,” ww2.arb.ca.gov. These parallel frameworks push automakers toward chassis dynamometers that reproduce mixed duty cycles under tightly controlled temperature and altitude bands. Regulatory convergence cuts duplication, enabling suppliers to offer standardized test beds yet still customize load ranges, PEMS integration, and software interfaces. Investment outlays now appear preferable to recurring third-party certification costs, shifting the market toward permanent in-house capacity.
Rapid Growth in EV Production Driving Demand for High-Torque Dyno
Global electric-vehicle output topped 17.3 million units in 2024 and is on track to exceed 20 million in 2025[2]International Energy Agency, “Trends in the Electric Car Industry – Global EV Outlook 2025 – Analysis,” iea.org. Electric drivetrains deliver instantaneous torque profiles that exceed legacy equipment limits, prompting laboratories to specify up to 14,000 Nm hub units and 320 km/h roller surfaces. Hardware upgrades coincide with expanded cooling circuits, contactless torque sensors, and regenerative-brake energy-recapture modules. In California, EV registrations surpassed 2 million in 2024 and are projected to reach 12.5 million by 2035, scaling local demand for precision testing rigs. The upgrade wave extends across Asia, where battery-electric SUVs and light trucks dominate incremental output.
Rising Performance-Tuning Aftermarket Worldwide
Consumers spent significantly on specialty equipment in 2023, with pickup, CUV, and SUV owners leading personalization activity. Multi-axle dynamometer bays attract tuners who seek validated horsepower gains under warranty-safe conditions, creating a niche for test centers offering hourly rentals and certified data printouts. Younger drivers favor professional installation over do-it-yourself work, steering aftermarket traffic toward shops that have invested in synchronized AWD systems and sound-attenuated vaults. Electrified powertrain modifications, though still small in absolute terms, show high velocity as enthusiasts explore software-limited torque releases and custom drive-mode calibrations.
Higher OEM Adoption of 4WD/AWD Platforms Boosts Multi-Axle Dyno Sales
OEMs continue installing torque-vectoring, dual-motor, and hybrid-mechanical AWD layouts across crossovers and premium sedans. Four-wheel-drive dynamometers offer independent control over each axle, permitting validation of clutch-pack logic, traction-control thresholds, and brake-torque-vectoring algorithms. Integrated steering input units replicate lane-change maneuvers, while environmental chambers overlay temperature sweeps to test lubricant viscosity management. These capabilities shorten calibration loops and help brands hit launch dates despite increasing software content.
Restraints Impact Analysis*
| Restraint | (~) % Impact on CAGR Forecast | Geographic Relevance | Impact Timeline |
|---|---|---|---|
| High Capital Expenditure | -1.2% | Global, particularly affecting smaller labs | Long term (≥ 4 years) |
| Low Utilization Rates | -0.8% | North America & EU, emerging in Asia | Medium term (2-4 years) |
| Semiconductor Shortages | -0.6% | Global, concentrated in automotive hubs | Short term (≤ 2 years) |
| Virtual Simulation Reliance | -0.4% | Advanced markets with strong software capabilities | Long term (≥ 4 years) |
| Source: Mordor Intelligence | |||
High Capital Expenditure for Full-Vehicle Dyno Facilities
Turn-key installations, encompassing chassis system, HVAC, vibration isolation, and emissions benches, cost USD 2–5 million. Facility preparation frequently matches equipment price, especially when deep foundations and acoustic treatments are required. Financing hurdles intensify during elevated interest-rate cycles; small laboratories often lack collateral strength to secure multi-year loans. Semiconductor scarcity, notably of gate-driver ICs and optical encoders integral to inverter modules, extends lead times and inflates quotes, forcing some buyers to defer upgrades or settle for lower-spec refurbishments.[3]U.S. Government, “40 CFR Part 1066 – Dynamometer Specifications,” ecfr.gov
Low Utilization Rates Among Smaller Contract Test Labs
Project-based workflows leave independent facilities with periodic troughs in machine hours. Meanwhile, OEM insourcing trends divert core emissions and durability programs back behind corporate walls. Under-used assets struggle to cover calibration, accreditation, and preventive-maintenance overheads. In regions with pronounced wet or cold seasons, regulatory road-load data gathering also shifts indoors for only a few months, compressing demand windows. Specialized rigs configured for passenger cars cannot seamlessly re-deploy to commercial-vehicle tasks, limiting throughput diversification.
*Our forecasts treat driver/restraint impacts as directional, not additive. The impact forecasts reflect baseline growth, mix effects, and variable interactions.
Segment Analysis
By Product Type: Multi-Axle Systems Gain Traction
Four-wheel-drive units represented 47.08% of the automotive chassis dynamometers market share in 2024 because manufacturers increasingly validate cross-coupled drive layouts that split torque across two axles. Demand growth centers on all-wheel-drive configurations, forecast at a 7.96% CAGR through 2030, as premium and performance brands introduce electric or hybrid twin-motor variants that require synchronized control of four individual rollers. In contrast, two-wheel-drive rigs retain relevance for cost-sensitive applications, regional norms, and legacy engines. The automotive chassis dynamometers market size for AWD systems is set to widen further as fleet electrification accelerates and regenerative-brake mapping calls for bidirectional power absorption.
Torque capacities exceeding 3,000 Nm per wheel, integrated battery-climate loops, and dynamic pitch-angle simulation increasingly appear in RFQs. Suppliers answer with modular decks that allow later expansion from 2WD to 4WD, safeguarding buyer investment as product portfolios evolve. Cloud-connected controllers stream real-time data to digital twins, enabling instant correlation between virtual-road and laboratory outcomes, and reducing the need for repeat physical runs.


By Application: Emissions Dominant, EV Components Soar
Emissions compliance retained 33.16% of total revenue in 2024, driven by synchronized adoption of Euro 7, China 6b, and United States Phase 3 greenhouse-gas rules. The automotive chassis dynamometers market size devoted to emission checks will stay substantial as agencies tighten brake particulate and ammonia slip caps. Yet the highest trajectory lies in electric and autonomous component testing, projected at an 11.64% CAGR to 2030. Here, laboratories require dynamometers that replicate start-stop surge, regenerative-braking overturn, and high-voltage thermal ramps.
BEV and autonomous stacks push hardware toward millisecond torque-sign reversal, smooth low-speed creep control, and fail-safe emergency-stop routines. Additional modules simulate ADAS radar drag, cabin load, and auxiliary energy draw. Powertrain and fuel-efficiency programs continue but gradually morph into hybrid-optimization studies, where ICE maps blend with electric-motor assist for minimal pollutant output.
By End-User: OEMs Extend In-House Capabilities
OEM centers owned 60.69% of demand in 2024, highlighting their preference to safeguard intellectual property and compress development timetables. The automotive chassis dynamometers market size inside car-maker campuses is expanding at a 6.33% CAGR as electrification necessitates fresh competencies like battery-soak cycles and hydrogen purge routines. Aftermarket and certification bodies compete mainly on flexibility, offering bespoke duty cycles and rapid scheduling unavailable within corporate queues.
In-house labs increasingly integrate chassis dynos with battery cyclers, climatic wind tunnels, and hardware-in-the-loop benches under a unified data lake. Vendors supporting this model bundle remote-diagnostics contracts, spares consignment, and operator upskilling. Outsourced players differentiate through multi-regulation accreditation and impartial reporting services, albeit under utilization-rate pressure.
By Propulsion Type: BEV Leads, FCEV Accelerates
Battery-electric platforms commanded 43.49% of testing activity in 2024 as manufacturers raced to validate range, charging performance, and durability targets. Fuel-cell vehicles, although starting from a small base, post an 11.54% CAGR through 2030 thanks to hydrogen-station rollouts, particularly in California, where 65 retail locations were operational in 2024. Automotive chassis dynamometers market share for internal-combustion benchmarks remains meaningful because hybrid layouts still rely on ICE for high-load events.
FCEV protocols necessitate ultra-dry inlet-air control, quick-freeze soak to –30 °C, and exhaust-humidity capture to monitor membrane dehydration. BEV tests concentrate on thermal runaway simulation, regen energy capture, and fast-charge thermal spikes. Both propulsion types induce a pivot toward higher-speed data acquisition and tighter torque-control loops than conventional spark-ignition engines demanded.
Geography Analysis
Asia-Pacific held 40.32% of 2024 revenue and is advancing at an 8.2% CAGR. China produced 12.4 million EVs in 2024, over 70% of worldwide output, making local demand for high-torque dynamometer cells unprecedented. India, Japan, and South Korea supplement regional growth through localized platform development for compact SUVs and mini EVs. Country-level mandates replicate Euro benchmarks, compelling both global and domestic OEMs to upgrade emissions-lab fleets. Governments also fund shared test centers to aid supplier ecosystems, further enlarging the installed base.
South America, led by Brazil’s 44 million-unit vehicle parc, records the fastest regional CAGR at 8.78%. Rising domestic content rules encourage builders to conduct durability and drive-cycle testing within Mercosur. Fleet-age disparities, from 18.8 years in Bolivia to 10.3 years in Chile, spawn aftermarket validation niches, including retrofit emissions kits that require roller testing for certification. Regional policies are converging toward Euro 6-aligned limits, driving demand for transient-cycle capable chassis cells amid funding incentives tied to decarbonization.
North America is tracking a 6.4% CAGR on the back of federal and state regulations that obligate life-cycle compliance checks and zero-emission sales milestones. The continent’s heritage test labs, some commissioned before 2000, now face modernization to accommodate AWD EVs and high-speed data interfaces. The Inflation Reduction Act’s clean-technology credits encourage repatriation of component manufacturing; as battery plants open, nearby dynamometer installations follow, mirroring past engine-plant clusters. Europe, expanding at 5.2% CAGR, remains the benchmark for premium-vehicle validation, requiring low-noise vaults and climatic extreme simulation to replicate high-alpine and Arctic use cases. Middle East & Africa, though nascent, shows sporadic investments tied to new-energy industrial zones and export-compliance mandates.
Mordor Intelligence provides coverage of the automotive chassis dynamometers market across other key regional markets, including Europe, each with their regulatory frameworks and demand patterns. Detailed country-level analysis extends to China, Japan, India, United States, and South Korea incorporating local coverage and market participation, as required.

Competitive Landscape
The automotive chassis dynamometers market is moderately concentrated. No participant exceeds a one-quarter share, signaling room for differentiated technologies and regional specialists. Customers value accuracy, repeatability, and seamless integration with broader lab ecosystems over price alone, tilting competition toward engineering innovation. Most top vendors pursue vertical integration, bundling software, calibration services, and data analytics layers above hardware. HORIBA leverages seven decades of metrology expertise to offer turnkey emission-to-battery test corridors, while its real-time analysis suite accelerates pass-fail decisions. AVL promotes modular SPECTRA dynos that span 10 kW micro-mobility motors to 140 MW ship engines, exposing automotive clients to cross-industry learnings in power-density management. Smaller firms carve space in geographic pockets by customizing foundation-free hub dynos or mobile trailers that support track-side verification.
Strategic alliances focus on AI-enabled condition monitoring and cloud-native data repositories. Suppliers partner with universities to validate model-based control, generating reference datasets that attract OEM interest. Meanwhile, semiconductor scarcity underscores the advantages of in-house electronics design and multi-sourcing strategies; companies with such depth can honor compressed delivery windows and outmaneuver competitors reliant on single foundries. Regional assembly plants and on-site-spares depots further distinguish full-service providers from catalog-only resellers.
White-space opportunities align with rising fuel-cell volumes, autonomous-stack over-the-air validation, and developing-market emissions centers. Vendors that can deliver compact, power-regenerative rigs with low infrastructure overhead stand to tap laboratories in fast-growing ASEAN and African corridors. Enhanced cybersecurity, mandatory for cloud-connected testbeds, emerges as another differentiator as automakers guard against firmware tampering during remote sessions.
Automotive Chassis Dynamometers Industry Leaders
HORIBA Ltd.
AVL List GmbH
MTS Systems Corporation
Meidensha Corporation
Schenck RoTec GmbH
- *Disclaimer: Major Players sorted in no particular order


Recent Industry Developments
- July 2025: Toyota Motor North America invested USD 50 million in expanded facilities at Arizona Proving Grounds, adding a 5.5-mile oval track, off-road park, and new ride-and-handling surfaces to boost vehicle and technology testing capacity.
- May 2025: Fortive completed the spin-off of Ralliant Corporation as an independent, publicly traded precision-instrument player with a dedicated automotive test segment positioned to serve electrification demand.
- April 2025: Mustang Advanced Engineering delivered a heavy-duty test stand to Texas A&M University, while Ascential Technologies released steerable hub dynamometers designed for next-generation autonomous prototypes.
- December 2024: Emerson announced a strategic investment in EecoMobility, an AI-driven battery-testing software firm, enhancing early fault detection for electric-vehicle packs.


Global Automotive Chassis Dynamometers Market Report Scope
| Two-Wheel Drive |
| Four-Wheel Drive |
| All-Wheel Drive |
| Powertrain Testing |
| Emissions Testing |
| Fuel Efficiency Analysis |
| Electric and Autonomous Component Testing |
| Research and Development |
| Others |
| OEMs |
| Aftermarket |
| Internal-Combustion Engine Vehicles |
| Hybrid Electric Vehicles |
| Battery Electric Vehicles |
| Fuel-Cell Electric Vehicles |
| North America | United States |
| Canada | |
| Rest of North America | |
| South America | Brazil |
| Argentina | |
| Rest of South America | |
| Europe | Germany |
| United Kingdom | |
| Spain | |
| Italy | |
| France | |
| Netherlands | |
| Rest of Europe | |
| Asia-Pacific | India |
| China | |
| Japan | |
| South Korea | |
| Indonesia | |
| Rest of Asia-Pacific | |
| Middle East and Africa | United Arab Emirates |
| Saudi Arabia | |
| Turkey | |
| Egypt | |
| South Africa | |
| Rest of Middle East and Africa |
| By Product Type | Two-Wheel Drive | |
| Four-Wheel Drive | ||
| All-Wheel Drive | ||
| By Application | Powertrain Testing | |
| Emissions Testing | ||
| Fuel Efficiency Analysis | ||
| Electric and Autonomous Component Testing | ||
| Research and Development | ||
| Others | ||
| By End-User | OEMs | |
| Aftermarket | ||
| By Propulsion Type | Internal-Combustion Engine Vehicles | |
| Hybrid Electric Vehicles | ||
| Battery Electric Vehicles | ||
| Fuel-Cell Electric Vehicles | ||
| By Geography | North America | United States |
| Canada | ||
| Rest of North America | ||
| South America | Brazil | |
| Argentina | ||
| Rest of South America | ||
| Europe | Germany | |
| United Kingdom | ||
| Spain | ||
| Italy | ||
| France | ||
| Netherlands | ||
| Rest of Europe | ||
| Asia-Pacific | India | |
| China | ||
| Japan | ||
| South Korea | ||
| Indonesia | ||
| Rest of Asia-Pacific | ||
| Middle East and Africa | United Arab Emirates | |
| Saudi Arabia | ||
| Turkey | ||
| Egypt | ||
| South Africa | ||
| Rest of Middle East and Africa | ||


Key Questions Answered in the Report
How large will global demand for automotive chassis dynamometers become by 2030?
The automotive chassis dynamometers market size is forecast to reach USD 540.58 million by 2030, reflecting a 5.56% CAGR over 2025-2030.
Which product configuration attracts the fastest growth?
All-wheel-drive dynamometers show the highest momentum, expanding at 7.96% CAGR as EVs and premium vehicles adopt multi-motor powertrains.
Why are OEMs increasing in-house testing capacity?
Stricter emission and durability rules, coupled with intellectual-property protection and compressed launch cycles, drive OEM labs to capture 60.69% of 2024 demand and continue growing.
What role do EV trends play in future dynamometer sales?
Battery-electric vehicles already account for 43.49% of testing needs, and their expanding share requires high-torque, regenerative-compatible rigs, fueling industry growth.
Which region offers the most attractive near-term upside?
South America registers the fastest regional CAGR at 8.78%, spurred by Brazil’s large vehicle fleet and tightening emissions legislation.
How does regulatory convergence influence equipment design?
Harmonized standards like Euro 7 and U.S. Phase 3 lessen testing complexity, enabling suppliers to provide standardized yet scalable dynamometer platforms that fit multiple jurisdictional cycles.
Page last updated on:


