United States Automotive Chassis Dynamometers Market Size and Share
Market Overview
| Study Period | 2019 - 2030 |
|---|---|
| Forecast Data Period | 2025 - 2030 |
| Historical Data Period | 2019 - 2023 |
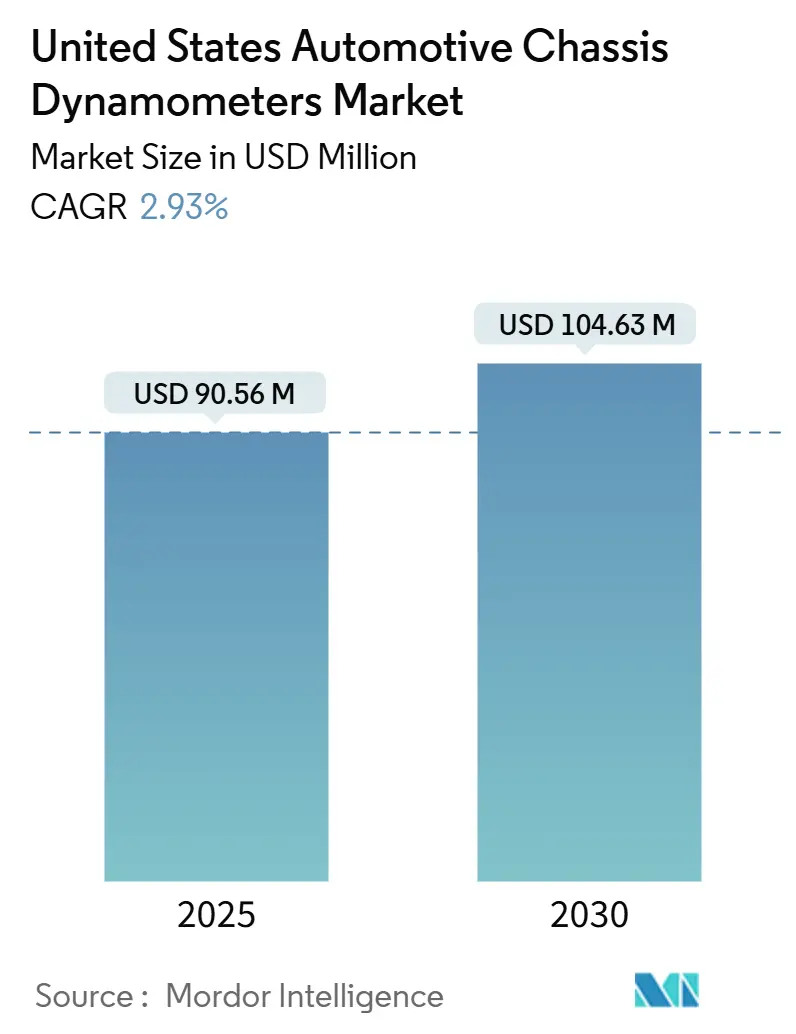
| Market Size (2025) | USD 90.56 Million |
| Market Size (2030) | USD 104.63 Million |
| Growth Rate (2025 - 2030) | 2.93% CAGR |
| Market Concentration | Medium |
Major Players
*Disclaimer: Major Players sorted in no particular order Image © Mordor Intelligence. Reuse requires attribution under CC BY 4.0. |
|
United States Automotive Chassis Dynamometers Market Analysis by Mordor Intelligence
The United States automotive chassis dynamometers market size stood at USD 90.56 million in 2025 and is forecast to register a 2.93% CAGR, lifting the value to USD 104.63 million by 2030. The steady trajectory reflects a maturing equipment segment where traditional ICE certification budgets tighten even as electric-powertrain validation outlays accelerate in response to evolving federal and state regulations. Stricter Phase 3 EPA greenhouse-gas rules for heavy-duty vehicles effective model year 2027, the California Air Resources Board’s (CARB) parallel standards, and Inflation Reduction Act incentives are the chief catalysts shaping near-term capital spending. Suppliers that offer multi-axle, energy-regenerative rigs aligned with Battery Electric Vehicle (BEV) protocols are positioned to benefit as OEMs re-tool their domestic labs for dual-compliance cycles. Meanwhile, independent laboratories are carving space by focusing on connected-vehicle testing services and turnkey regulatory reporting solutions, partially offsetting the slowdown in routine ICE work.
Key Report Takeaways
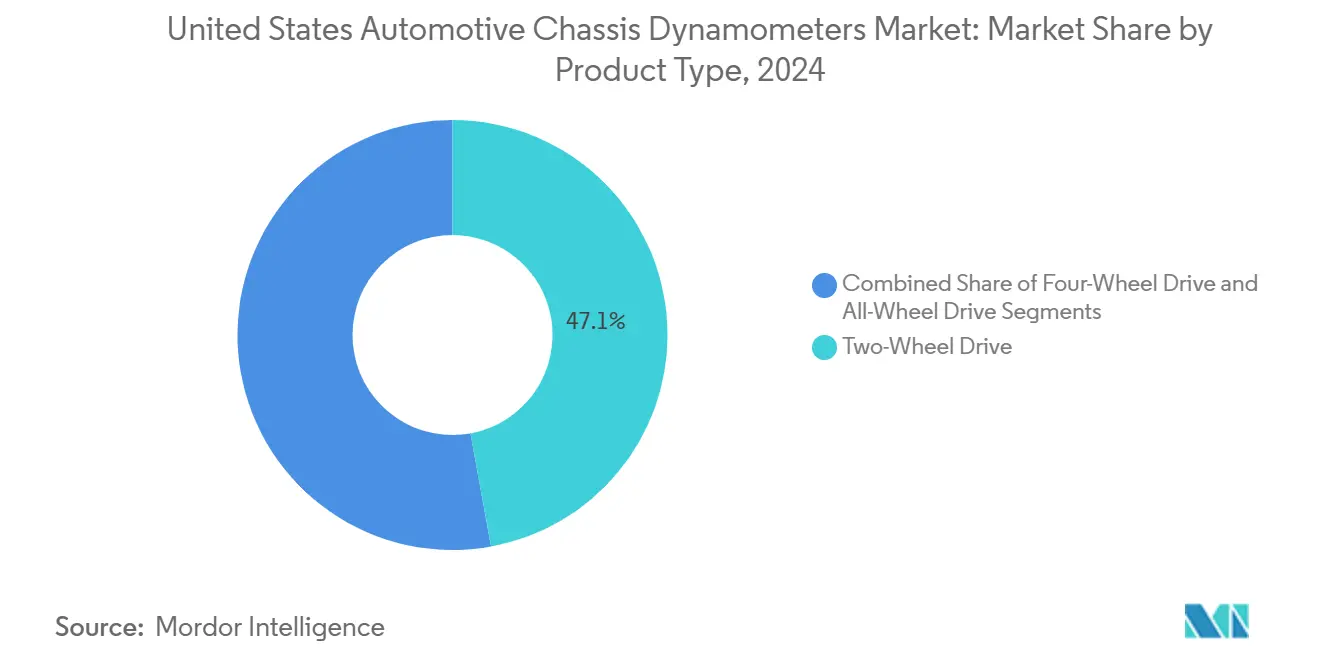
- By product type, two-wheel drive equipment led with 47.13% of United States automotive chassis dynamometers market share in 2024, while all-wheel drive rigs are tracking a 7.51% CAGR through 2030.
- By application, emissions testing accounted for 39.45% of United States automotive chassis dynamometers market size growth in 2024, while electric and autonomous component programs are expanding at the fastest 8.76% CAGR to 2030.
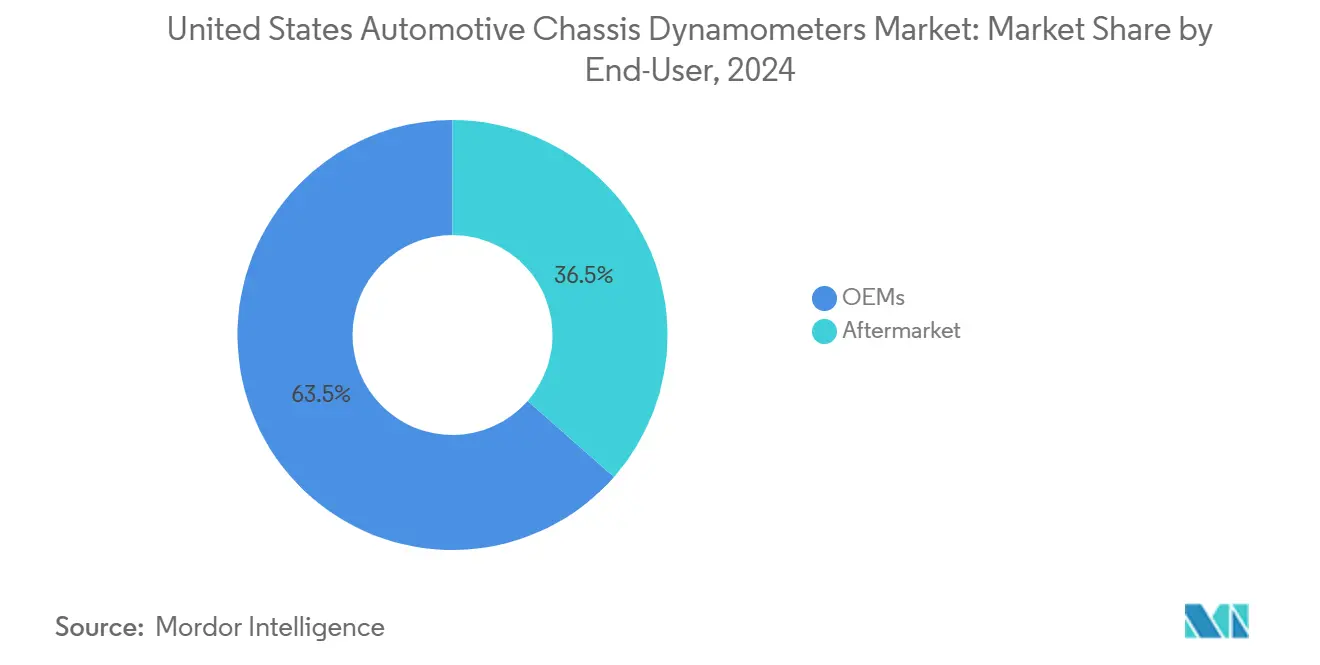
- By end-user, OEM facilities captured 63.53% revenue share in 2024; the aftermarket is projected to post the swiftest 7.93% CAGR outlook to 2030.
- By propulsion, internal-combustion engine vehicles commanded 55.33% share in 2024, while battery electric vehicle testing is projected to register 9.91% CAGR between 2025-2030.
Proportional positioning is established by comparing country level and regional contributions against the global total, including that of United states. The automotive chassis dynamometers market share in our global report expresses these relative weights.
United States Automotive Chassis Dynamometers Market Trends and Insights
Drivers Impact Analysis*
| Driver | (~) % Impact on CAGR Forecast | Geographic Relevance | Impact Timeline |
|---|---|---|---|
| EPA and CARB Emission Compliance | +1.0% | Nationwide, with California leading implementation | Medium term (2-4 years) |
| EV Powertrain Validation Investments | +0.8% | Michigan, California, Texas, Tennessee automotive corridors | Long term (≥ 4 years) |
| Growing AWD Vehicle Mix | +0.5% | Midwest and Mountain West regions, cold climate states | Medium term (2-4 years) |
| IRA Tax Credits | +0.4% | Nationwide, concentrated in manufacturing states | Medium term (2-4 years) |
| DOE CAV Energy-Efficiency | +0.3% | Research Triangle, Silicon Valley, Detroit Metro | Long term (≥ 4 years) |
| Pending Methane Rules | +0.2% | Texas, California, Interstate freight corridors | Short term (≤ 2 years) |
| Source: Mordor Intelligence | |||
Stricter EPA & CARB Emission Compliance Timelines
Phase 3 greenhouse-gas standards for heavy-duty vehicles effective model year 2027 usher in the most demanding chassis-based CO₂, CH₄, and N₂O verification ever enforced in the United States[1]United States Environmental Protection Agency, "Regulations for Emissions from Vehicles and Engines", epa.gov. Manufacturers must validate diverse configurations under compressed certification windows, driving immediate orders for multi-axle rigs capable of front- and rear-load synchronization. CARB’s Advanced Clean Cars Program forces dual-testing scenarios, prompting OEMs to harmonize rig specifications across all American labs to avoid redundant investments. Facility managers note that the volume of CARB Executive Orders—nearly 4,000 annually—illustrates how quickly throughput capacity must scale to prevent seasonal backlogs.
Accelerating EV Powertrain Validation Investments
Electric powertrains require regenerative dynamometers equipped with high-bandwidth controllers, battery emulators, and thermal-management interfaces that depart markedly from legacy ICE setups. SAE J1634 range-testing introduces multi-cycle procedures that cut lab time but raise control-precision demands[2]SAE International, "Battery Electric Vehicle Energy Consumption and Range Test Procedure J1634_202104", sae.org. Cummins’ recent upgrade in Indiana adds hydrogen and renewable-gas capabilities, signaling how end-users blend multiple zero-carbon fuels under one roof. California’s 2026+ zero-emission test protocol mandates electric dynamometer use, nudging labs nationwide to match specifications for fleet-wide consistency.
Growing AWD Vehicle Mix Boosting Dyno Demand
A majority of U.S. light-duty units produced in 2022 featured AWD or 4WD drivetrains. These configurations necessitate torque-synchronized rollers that emulate variable road-load splits, especially for high-altitude or snow-belt validation. The EPA’s Supplemental Federal Test Procedure requires independent speed control per axle, so capacity expansion centers on 4-roller systems able to replicate highly dynamic torque transfers. Electrified AWD hybrids add battery-recuperation layers, further complicating inertia-matching algorithms.
IRA Tax Credits for Advanced Test Equipment
The Inflation Reduction Act’s Alternative Fuel Vehicle Refueling Property Credit offers 30% offsets (capped at USD 100,000) when prevailing-wage rules are met, lowering payback cycles on regenerative dynamometers integrated with behind-the-meter storage[3]Internal Revenue Service (IRS), "Alternative Fuel Vehicle Refueling Property Credit", irs.gov. Section 48 energy-property provisions likewise recognize rigs linked to microgrids, enabling facility owners to claim combined hardware and energy-infrastructure incentives through 2032.
Restraints Impact Analysis*
| Restraint | (~) % Impact on CAGR Forecast | Geographic Relevance | Impact Timeline |
|---|---|---|---|
| High Capex For Multi-Axle Chassis | -0.6% | Nationwide, particularly affecting smaller facilities | Medium term (2-4 years) |
| Shrinking ICE Certification Budgets | -0.5% | Michigan, Ohio, traditional automotive manufacturing states | Short term (≤ 2 years) |
| Utility Interconnect Delays | -0.4% | Texas, California, grid-constrained regions | Medium term (2-4 years) |
| Calibration Engineers' Talent Gap | -0.3% | Nationwide, acute in emerging automotive regions | Long term (≥ 4 years) |
| Source: Mordor Intelligence | |||
High Capex for Multi-Axle Chassis Dynos
Independent testing laboratories and smaller OEM facilities across the United States face significant barriers due to the capital investments exceeding USD 10 million required for comprehensive facilities. These facilities are essential for testing all-wheel drive and heavy-duty vehicle configurations using multi-axle chassis dynamometer systems. Beyond hardware, building retrofits, NIST traceable torque cells, and regenerative-grid interfaces elevate total installed cost. Small labs often defer upgrades, creating supply-demand imbalances that inflate wait-times for AWD certification slots.
Shrinking ICE Certification Budgets
As US automotive manufacturers shift their focus and resources towards electric vehicle development and testing, traditional internal combustion engine certification budgets are feeling the squeeze. This pivot is posing challenges for the use of conventional chassis dynamometers in automotive facilities across the nation. OEM R&D allocations continue pivoting toward electrified platforms, squeezing traditional engine-program budgets in Michigan and Ohio. With fewer new engine families entering pipelines, some Tier-1 suppliers idle single-axle rigs or repurpose them for component durability tasks, softening short-term demand until BEV volumes fully compensate.
*Our forecasts treat driver/restraint impacts as directional, not additive. The impact forecasts reflect baseline growth, mix effects, and variable interactions.
Segment Analysis
By Product Type: AWD Systems Drive Innovation
Two-wheel drive rigs maintained a 47.13% slice of United States automotive chassis dynamometers market share in 2024, benefiting from cost-efficient compliance testing for passenger sedans and light trucks. However, the United States automotive chassis dynamometers market size segment linked to all-wheel drive is projected to outpace with a 7.51% CAGR through 2030 as OEMs align facilities to mirror rising AWD production volumes. Mustang Dynamometer’s Virtual Inertia™ technology exemplifies the shift toward precision load matching across independently driven axles, a prerequisite for modern stability-control calibration.
Outside legacy sedans, the surge in crossover models and electrified SUVs accelerates four-roller adoption. In mountain and snow-belt states, certification labs increasingly specify climate-controlled chambers paired with AWD rigs to replicate cold-start duty cycles. Multi-speed e-axles entering premium BEVs further pressure rollers to synchronize torque pulses below 100 milliseconds, amplifying controls-software complexity within the United States automotive chassis dynamometers industry.


By Application: Electric Testing Emerges
Emissions testing sustained the largest 39.45% revenue contribution in 2024, underlining continued regulatory priority for criteria-pollutant monitoring. Yet electric and autonomous component programs secure the quickest 8.76% CAGR, reflecting new mileage-accumulation and battery-aging protocols that underpin federal range-labeling and over-the-air update validation. The United States automotive chassis dynamometers market size devoted to hybrid-system fuel-efficiency analysis now couples transient ICE cycles with battery discharge-recharge mapping, doubling data-point density per test hour.
Research institutions capitalize on DOE vouchers by procuring open-interface rigs capable of Hardware-in-the-Loop experimentation, allowing machine-learning controllers to iterate drive strategies without full-vehicle prototypes. As a result, software-definable dynos gain traction, letting labs re-configure inertia profiles for Class 2b pickups in the morning and electric motorcycle modules by afternoon within the wider United States automotive chassis dynamometers market.
By End-User: OEM Dominance Persists
OEM-owned labs commanded 63.53% of 2024 revenue, a lead traced to in-house compliance imperatives and intellectual-property containment. United States automotive chassis dynamometers market share nonetheless tilts gradually as aftermarket and third-party labs log 7.93% CAGR, winning projects from start-up EV brands that prefer asset-light models. Large assemblers retain strategic rigs for program-confidentiality, yet they increasingly outsource time-intensive endurance cycles to specialists, boosting utilization rates in the independent tier of the United States automotive chassis dynamometers industry.
As vehicle systems grow more complex, the aftermarket sees a surge, especially with electric and autonomous components needing advanced validation protocols that outstrip traditional testing methods. Aftermarket growth dovetails with a service-based revenue model: subscription access to cloud-hosted drive-cycle databases, paired with lab time billed hourly. This flexibility helps smaller fleets prove compliance without capital outlay, broadening customer diversity beyond Michigan’s traditional OEM cluster.
By Propulsion Type: BEV Testing Accelerates
Internal-combustion vehicles remained dominant at 55.33% of 2024 rig hours, but BEV protocols deliver the fastest 9.91% CAGR through 2030 as zero-emission mandates firm. Hybrid platforms sustain a mid-single-digit expansion, demanding dual-mode cycles that toggle between electric-only and blended propulsion. Fuel-cell programs are niche yet strategically essential for Class 8 decarbonization pilots along coastal freight corridors.
High-current battery emulators integrated with chassis rollers unlock repeatable cold-soak and fast-charge sequences, critical for forthcoming EPA range-adjustment factors. Energy-recovery modules, once optional, become standard to curtail grid draw, aligning with IRA credit eligibility. Consequently, BEV-specific control loops represent the most active software-update field across the United States automotive chassis dynamometers market.
Geography Analysis
The Great Lakes region anchors the largest installed base owing to Michigan’s dense OEM and tier-supplier footprint where legacy ICE and emerging BEV programs co-exist. Regional labs routinely process vehicles destined for nationwide sale, ensuring synchronized validation against both EPA and CARB criteria. California records the fastest growth rate, propelled by CARB’s stringent zero-emission mandates that necessitate extra cycles beyond federal requirements. Local demand also captures start-up EV firms clustering around Silicon Valley and the Inland Empire, intensifying utilization rates at third-party labs.
Texas rises as a heavyweight on the back of new assembly plants near Austin and San Antonio paired with the state’s freight-transport focus. Heavy-duty engine makers leverage nearby shale-gas corridors to test low-carbon methane and hydrogen blends, supporting diverse propulsion research. Meanwhile, the Southeast corridor, stretching from Tennessee through Georgia, attracts foreign OEM investment in battery-assembly operations, spurring fresh orders for regenerative dynos able to replicate high-humidity climate profiles.
The Mountain West exhibits emergent demand as Colorado and Utah labs cater to high-altitude calibration where thinner air influences range and emissions. The Pacific Northwest leverages surplus hydroelectricity to offer competitively priced regenerative-dyno sessions, attracting customers aiming to minimize Scope 2 emissions footprints. Across all regions, utility-interconnect lead-times increasingly dictate equipment-commissioning schedules, particularly where renewable-energy penetration complicates grid-stability studies.
Mordor Intelligence examines the automotive chassis dynamometers market across diverse other regional markets as well, including Europe, while also offering granular country-level perspectives for China, Japan, India, and South Korea and more.
Competitive Landscape
The competitive field remains moderately concentrated. HORIBA Ltd. leverages turnkey lab solutions and long-standing U.S. customer relationships. AVL List GmbH, Siemens, and Dynojet round out the next tier, each emphasizing proprietary controls and data-analytics stacks that dovetail with OEM digital-twin initiatives. Suppliers differentiate through high-torque e-motor emulation, modular roller beds, and cybersecurity-hardened controllers that align with OEM IT standards.
Strategic investments underscore technology race dynamics. Cummins’ USD 70 million powertrain-test expansion adds hydrogen and renewable-gas capability, illustrating end-user preference for multi-fuel flexibility. Siemens integrates its Xcelerator software with chassis-dyno control layers, pitching closed-loop digital-thread offerings that cut prototype cycles. Mustang Dynamometer courts performance-tuning networks by pairing dynos with over-the-air telemetry, reflecting aftermarket evolution into data-rich services.
Barriers to entry include steep certification-audit costs and a talent shortage in electro-mechanical calibration. Established vendors mitigate the gap through operator-training academies and remote-diagnostics contracts, increasing customer lock-in. New entrants target niche segments, such as hub-dynos for robotics or steerable rigs for ADAS testing, but face scale disadvantages in servicing nationwide fleets.
United States Automotive Chassis Dynamometers Industry Leaders
-
HORIBA Ltd.
-
AVL List GmbH
-
Mustang Dynamometer
-
Dynojet Research Inc.
-
MAHA Maschinenbau Haldenwang
- *Disclaimer: Major Players sorted in no particular order

Recent Industry Developments
- May 2025: Cummins Inc. announced a USD 70 million expansion of its Indiana test center, adding multi-fuel chassis dynamometers for hydrogen, renewable natural gas, and battery-electric platforms.
- April 2025: Lucid Group, Inc. agreed to purchase former Nikola Corporation assets in Arizona, acquiring a full-size chassis dynamometer and battery-environmental chambers to accelerate BEV validation.
- January 2025: Ascential Technologies introduced a hub and steerable dyno aimed at electric and autonomous vehicle cycles, claiming faster setup times and improved repeatability.


United States Automotive Chassis Dynamometers Market Report Scope
| Two-Wheel Drive |
| Four-Wheel Drive |
| All-Wheel Drive |
| Powertrain Testing |
| Emissions Testing |
| Fuel-Efficiency Analysis |
| Electric and Autonomous Component Testing |
| Research and Development |
| Others |
| OEMs |
| Aftermarket |
| Internal-Combustion Engine Vehicles |
| Hybrid Electric Vehicles |
| Battery Electric Vehicles |
| Fuel-Cell Electric Vehicles |
| By Product Type | Two-Wheel Drive |
| Four-Wheel Drive | |
| All-Wheel Drive | |
| By Application | Powertrain Testing |
| Emissions Testing | |
| Fuel-Efficiency Analysis | |
| Electric and Autonomous Component Testing | |
| Research and Development | |
| Others | |
| By End-User | OEMs |
| Aftermarket | |
| By Propulsion Type | Internal-Combustion Engine Vehicles |
| Hybrid Electric Vehicles | |
| Battery Electric Vehicles | |
| Fuel-Cell Electric Vehicles |


Key Questions Answered in the Report
What is the projected value of the United States automotive chassis dynamometers market in 2030?
USD 104.63 million, based on a 2.93% CAGR from the 2025 baseline.
Which product configuration is growing fastest?
All-wheel drive chassis dynamometers, forecast at 7.51% CAGR through 2030.
Why are EV validation programs reshaping equipment specifications?
Battery-electric drivetrains require regenerative rollers, high-bandwidth controllers, and battery emulators that differ from legacy ICE test rigs.
How do Inflation Reduction Act incentives influence capital spending?
Section 48 and alternative-fuel property credits offset up to 30% of qualifying chassis-dyno investments, shortening payback periods.
Which U.S. region shows the quickest demand growth?
California leads due to CARB’s zero-emission mandates that introduce extra testing cycles beyond federal rules.
Page last updated on:


