Automotive Instrument Cluster Market Size and Share
Market Overview
| Study Period | 2019 - 2031 |
|---|---|
| Market Size (2026) | USD 11.04 Billion |
| Market Size (2031) | USD 16.13 Billion |
| Growth Rate (2026 - 2031) | 7.89% CAGR |
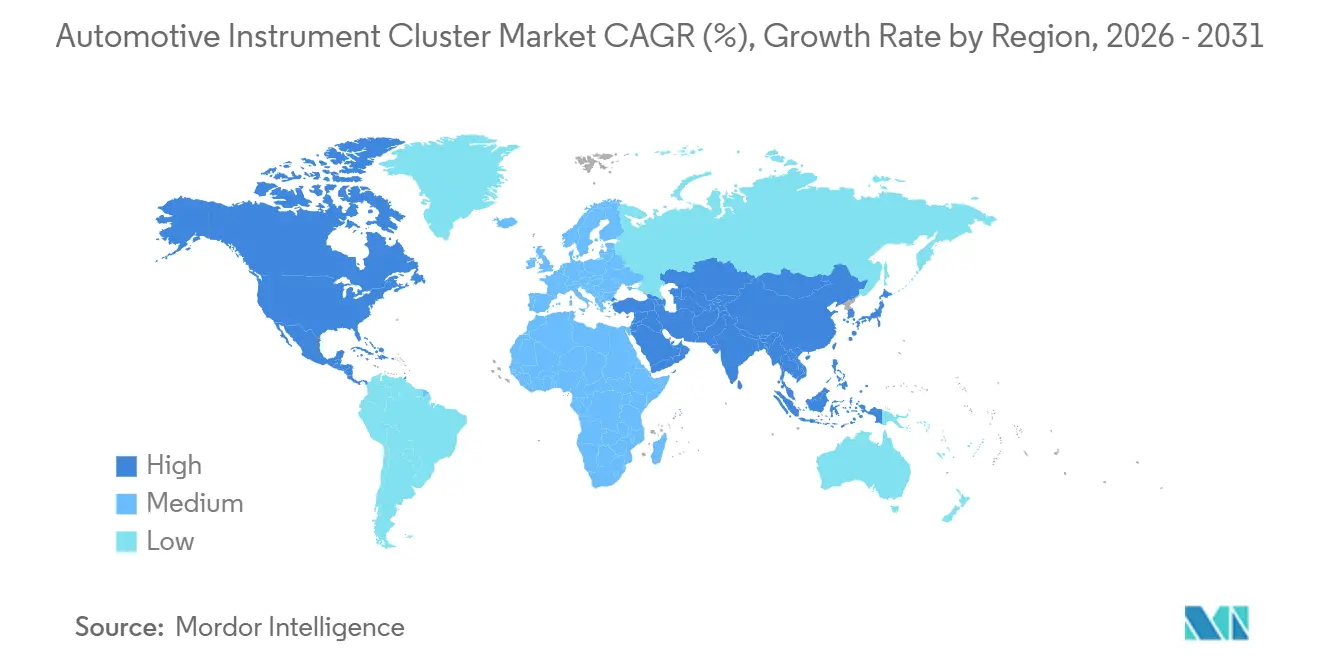
| Fastest Growing Market | Asia Pacific |
| Largest Market | North America |
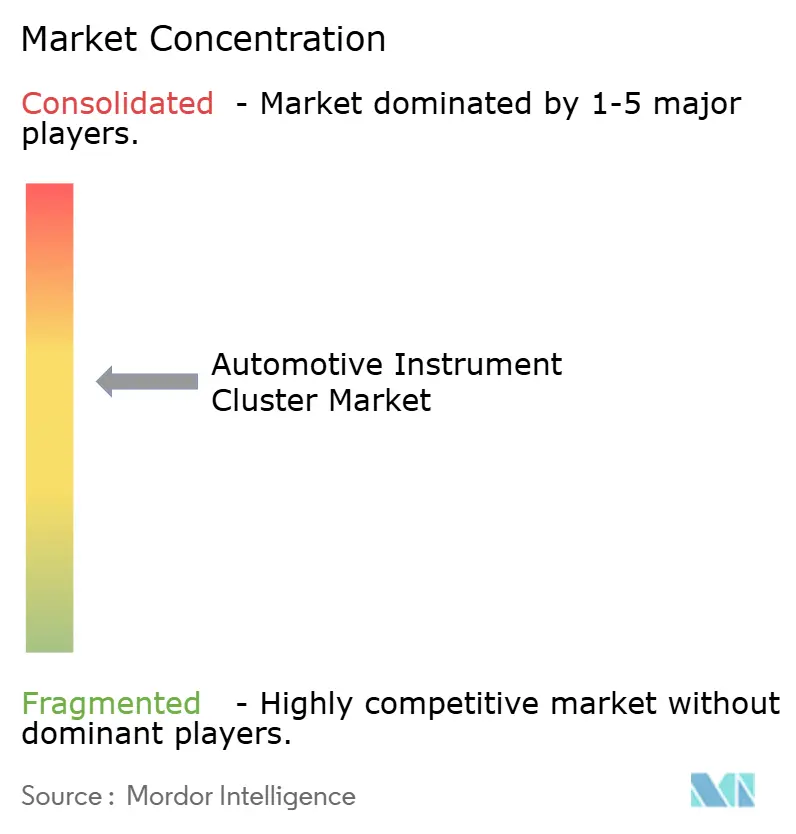
| Market Concentration | Medium |
Major Players
*Disclaimer: Major Players sorted in no particular order Image © Mordor Intelligence. Reuse requires attribution under CC BY 4.0. |
|
Automotive Instrument Cluster Market Analysis by Mordor Intelligence
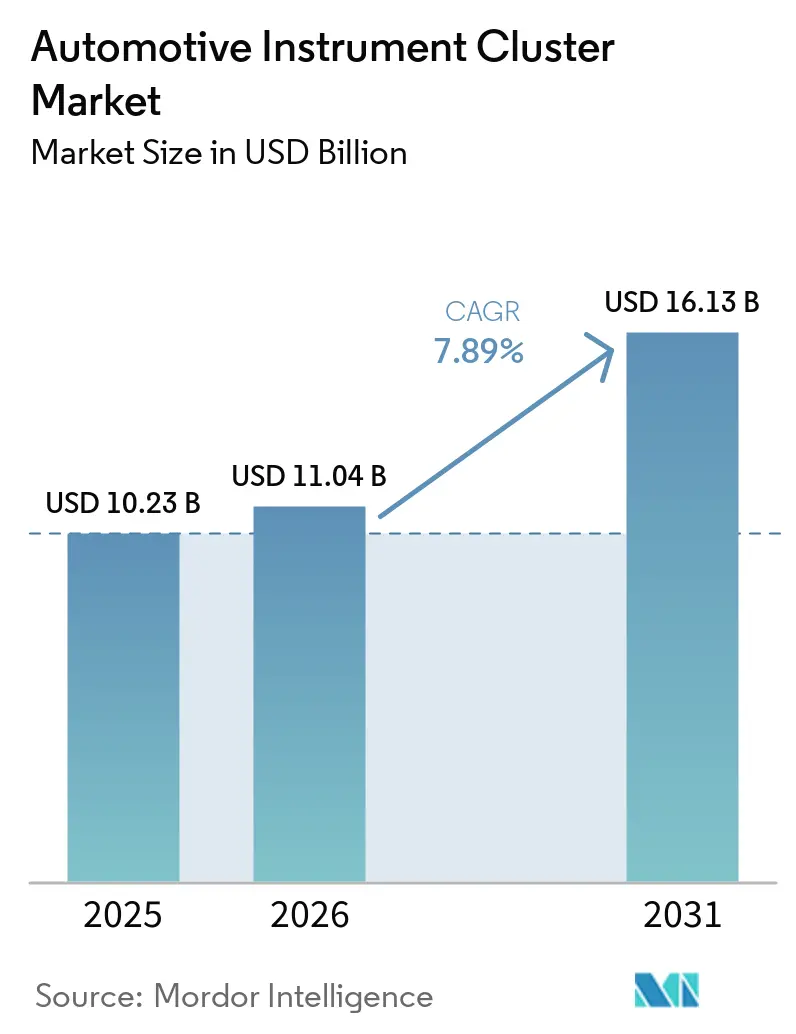
The automotive instrument cluster market size is projected to expand from USD 10.23 billion in 2025 and USD 11.04 billion in 2026 to USD 16.13 billion by 2031, registering a 7.89% CAGR between 2026 and 2031. Modern cockpit design is shifting cluster hardware from mechanical gauges to fully reconfigurable displays that blend speed, battery state, and driver-assistance alerts in a single field of view. Automakers now treat the cluster as a software-updatable canvas, capable of generating post-sale revenue from downloadable themes while meeting tighter distraction rules that require concise, glanceable data. Regulations are nudging this evolution: the United Nations’ R155 cybersecurity rule and R156 software-update rule became mandatory for new vehicle types in 2024, compelling suppliers to harden cluster software stacks[1]"Cybersecurity - New Challenges: ISO/SAE 21434, UNECE WP.29 R155 and R156," Robert Bosch GmbH, www.bosch-engineering.com. Hardware innovation keeps pace, with flexible panels enabling curved layouts that follow dashboard contours, and zonal electrical architectures delivering the graphics bandwidth needed for rich visualizations.
Key Report Takeaways
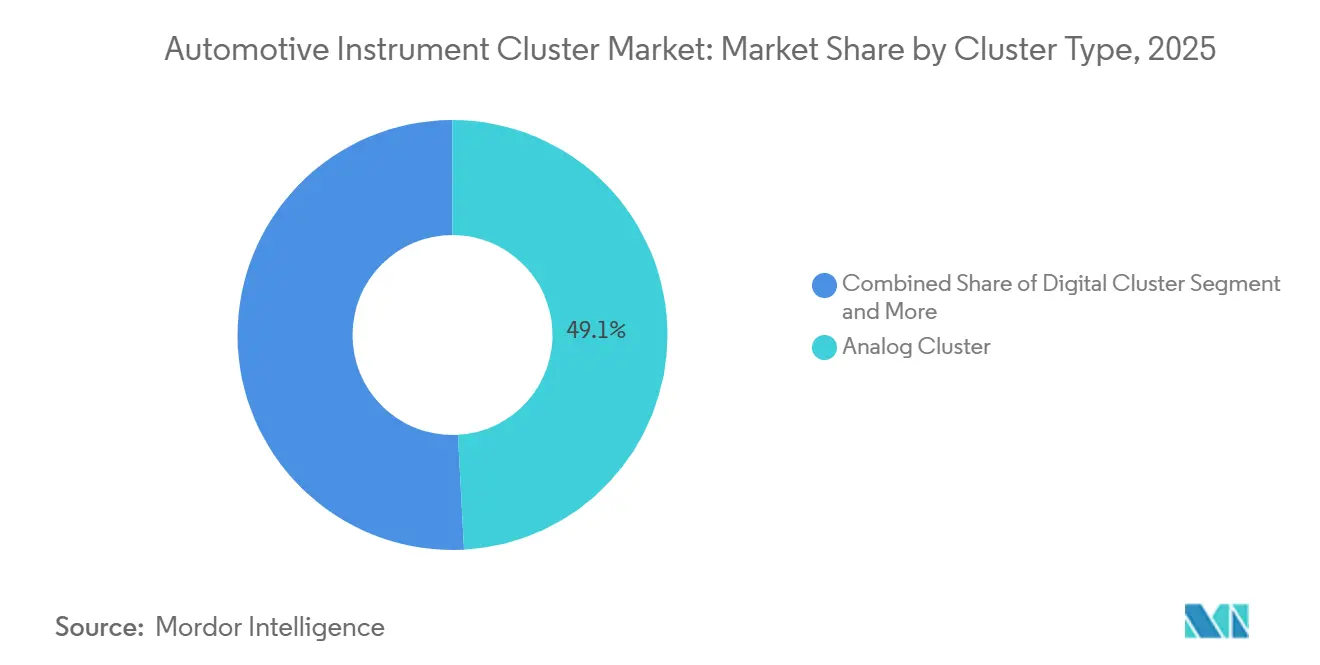
- By cluster type, analog clusters held 49.14% of the Automotive instrument cluster market share in 2025. Digital clusters are advancing at an 8.34% CAGR through 2031.
- By vehicle type, passenger cars led the Automotive instrument cluster market with 56.21% market share in 2025 and are forecast to grow at a 7.75% CAGR through 2031.
- By propulsion type, internal-combustion models commanded 71.35% of the Automotive instrument cluster market share in 2025. The battery electric sub-segment remains the fastest, expanding at a 9.92% CAGR through 2031.
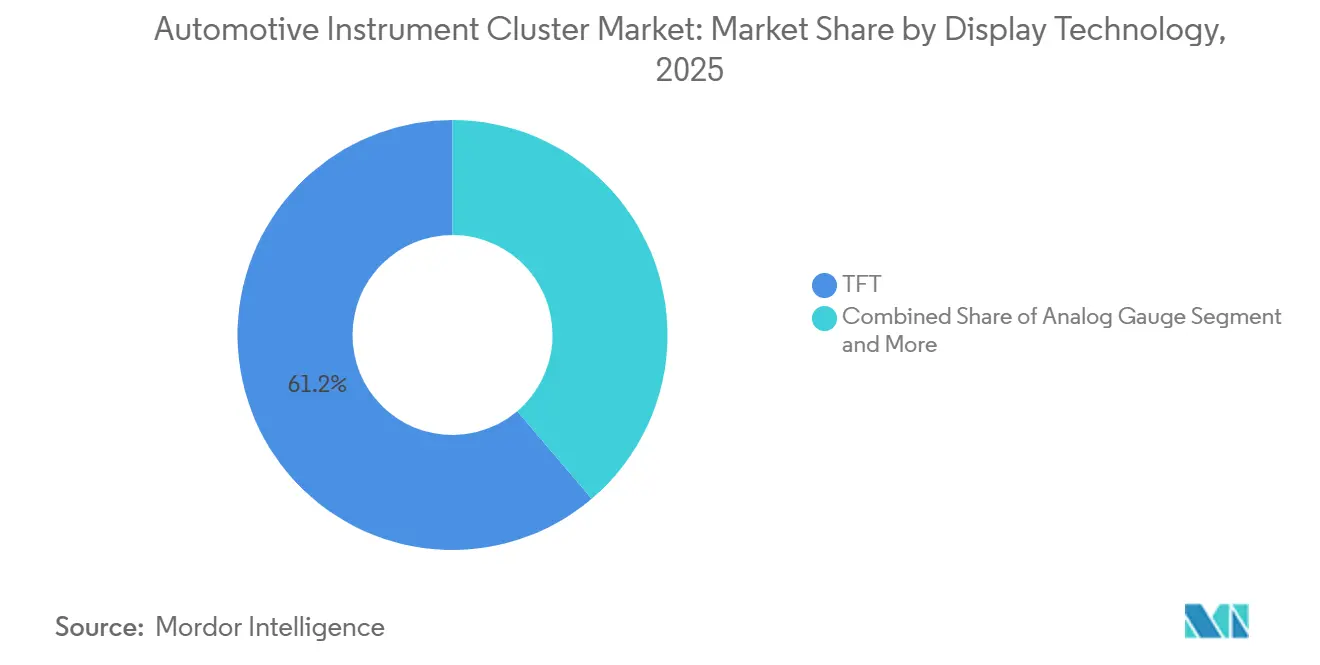
- By display technology, thin-film-transistor panels accounted for 61.22% of the Automotive instrument cluster market share in 2025, whereas organic-light-emitting-diode units are rising at an 8.76% CAGR through 2031.
- By sales channel, equipment sold directly to vehicle makers represented 87.41% of the Automotive instrument cluster market share in 2025. The retrofit aftermarket is increasing at 9.34% CAGR through 2031.
- By geography, North America led the Automotive instrument cluster market with 35.66% market share in 2025, and Asia-Pacific is set to record an 8.05% CAGR through 2031.
Note: Market size and forecast figures in this report are generated using Mordor Intelligence’s proprietary estimation framework, updated with the latest available data and insights as of January 2026.
Global Automotive Instrument Cluster Market Trends and Insights
Drivers Impact Analysis*
| Driver | (~) % Impact on CAGR Forecast | Geographic Relevance | Impact Timeline |
|---|---|---|---|
| Digital Clusters Replacing Analog Displays | +1.8% | Global (APAC and Europe lead) | Medium term (2-4 years) |
| EV Demand Increases Battery Displays | +1.5% | APAC core | Short term (≤ 2 years) |
| Integrating ADAS and Connected HMI | +1.2% | North America and the EU | Medium term (2-4 years) |
| Software-Defined Vehicle Architecture | +1.1% | Europe and North America first movers | Long term (≥ 4 years) |
| Flexible OLED Panels Reduce Cost | +0.9% | Global premium | Long term (≥ 4 years) |
| Immersive 3D/AR Cockpit Experiences | +0.6% | Global luxury | Long term (≥ 4 years) |
| Source: Mordor Intelligence | |||
Shift from Analog to Fully-Digital Clusters
Automakers are retiring mechanical gauges because software-only layouts cut tool-change expense, support over-the-air localization, and accommodate rich driver-assistance graphics. Japanese brands that once favored optitron dials now ship full-LCD meters across volume models, underscoring a global tipping point toward digital clusters. Ford’s 2025 recall, triggered by black-screen failures on certain pickups, highlighted the importance of rigorous validation when analog redundancy disappears[2]"Ford recalls more than 355,000 pickup trucks over instrument display failure on the dashboard", ET Auto, auto.economictimes.indiatimes.com. To reassure buyers who miss tactile pointers, premium marques are adding haptic feedback and high-contrast OLED panels that mimic physical depth. Suppliers that refine font legibility, color science, and instantaneous wake-up behavior are winning design contests as cluster reliability becomes a safety proxy.
Growing EV Production Needing Battery-State Displays
Battery-electric powertrains compel clusters to show granular energy data, state of charge, distance-to-empty, regenerative braking intensity, and temperature-linked range. Chevrolet’s Equinox EV cluster sets a new baseline, presenting charge percentage, energy history, and real-time power flow at a single glance. Driver anxiety over remaining range intensifies demand for dynamic visuals that adapt to terrain and weather. The cluster, therefore, evolves from a passive gauge set to an active coaching tool, nudging behavior that preserves battery health. As more jurisdictions announce combustion-engine phase-outs, instrument-cluster suppliers bundle battery analytics as a core feature rather than an electric-only add-on.
ADAS and Connected-Car Integration Into HMI
Regulation requires lane-keeping, emergency braking, and speed limit assistance alerts to be displayed in the driver’s forward view. The National Highway Traffic Safety Administration caps eyes-off-road time, pushing ADAS status lights into the instrument cluster where glance duration is brief. Silicon vendors now embed heterogeneous GPU cores that sustain rich 3D renderings without adding separate ECUs, making the cluster a primary canvas for sensor-fusion feedback. Collaboration between software HMI studios and Tier-1 integrators focuses on hierarchy, critical alerts surface instantly, while secondary cues tuck behind soft keys.
Software-Defined Vehicle Architectures Driving Re-Configurable Clusters
Zonal electrical layouts centralize compute so that a single domain controller can alter cluster graphics long after sale. Over-the-air updates unlock paid themes or add icons for new driver-assist packages, transforming the cluster into a post-purchase revenue channel. This flexibility also introduces new cyber-threat vectors. UNECE’s R155 cybersecurity rule obliges carmakers to implement threat monitoring throughout the vehicle's life, making secure boot, encrypted communications, and event logging mandatory. Tier-1s that certify compliance gain an edge, as carmakers avoid re-auditing multiple suppliers.
Restraints Impact Analysis*
| Restraint | (~) % Impact on CAGR Forecast | Geographic Relevance | Impact Timeline |
|---|---|---|---|
| High Cost and Price Sensitivity | −1.2% | Emerging markets | Short term (≤ 2 years) |
| Legacy Supply-Chain Shortages | −0.9% | Global | Medium term (2-4 years) |
| Cyber-Security Compliance Burden | −0.6% | EU and North America | Medium term (2-4 years) |
| Stricter Driver-Distraction Regulations | −0.4% | EU and North America | Long term (≥ 4 years) |
| Source: Mordor Intelligence | |||
High Cost and Price Sensitivity in Mass-Market Segments
Digital clusters still add material cost compared to analog units, an obstacle in entry-level cars and motorcycles, where buyers favor lower transaction prices. Aftermarket kits demonstrate consumer demand for modern displays but also reveal willingness-to-pay thresholds. Suppliers pursue vertical integration, owning back-light, touch sensor, and board assembly, to shave every dollar. Some OEMs tier options, reserving full digital clusters for premium trims, yet that fragments scale economies and dilutes purchasing leverage.
Legacy Supply-Chain Shortages for ICs / Displays
China will require physical selectors for key functions from July 2027, forbidding screen-only gear selection and ensuring that clusters are not overloaded with touch inputs. Similar pulse checks appear in U.S. and EU distraction guidelines, effectively capping the number of menu layers a driver must navigate. Designers therefore simplify layouts, adopt larger icons, and prioritize context-aware dimming to safeguard glance dwell time. The rule set nudges HMI teams to balance wow factor with regulatory scrutiny, favoring clear typography over ornamental graphics.
*Our forecasts treat driver/restraint impacts as directional, not additive. The impact forecasts reflect baseline growth, mix effects, and variable interactions.
Segment Analysis
By Cluster Type: Digital Gains Despite Analog Dominance
Analog units retained 49.14% of the Automotive instrument cluster market share in 2025, underpinned by cost-driven models and commercial fleets that value rugged simplicity. Yet fully digital clusters, growing at 8.34% CAGR, anchor next-generation cockpits that merge navigation, ADAS alerts, and personalization. Suppliers leverage emissive panels to achieve deep blacks and low latency, enabling context-sensitive themes that switch between sport, eco, and autonomous modes. Regulatory mandates to surface driver-assist status make physical pointers insufficient, accelerating the pivot. Enthusiast circles still admire the tactile sweep of a needle, and heritage brands sometimes blend analog rings with center screens as a bridge to nostalgia.
The Automotive instrument cluster market responds by aligning supply with digital demand. Manufacturers invest in graphics pipelines that compile once and deploy across screen sizes, reducing engineering overhead. As clusters synchronize with head-up displays, redundant warnings fade, freeing real estate for richer maps. Analog holdouts increasingly serve emerging-market two-wheelers or niche off-highway machinery, where glare, vibration, and glove-friendly controls trump styling. Even there, hybrid solutions creep in, a compact TFT inserts between mechanical gauges to satisfy minimum information sets without re-engineering entire dashboards.


By Vehicle Type: Passenger Cars Lead, Two-Wheelers Digitize
Passenger cars captured 56.21% of the Automotive instrument cluster market share in 2025 and are also the fastest-growing segment at 7.75% CAGR through 2031, reflecting lion ’s-share production volumes and consumer appetite for connected interiors. Electric crossovers and premium sedans frequently debut large digital clusters that cascade to mid-segments within model-cycle refreshes. Two-wheelers, once content with speed and fuel needles, now adopt small TFT screens to show navigation arrows and call alerts, mirroring smartphone culture among urban riders. Fleet vans and medium trucks lag, yet regulatory data-logging requirements nudge them toward digital dashboards that standardize driver-score feedback.
Within the Automotive instrument cluster market, passenger-car dominance seeds scale economies that bleed into motorcycles and light commercial vehicles, lowering entry barriers. Riders appreciate instantaneous gear-position cues and Bluetooth music prompts, turning compact clusters into lifestyle statements. Carmakers unify design language across multiple body styles, so an SUV and a hatchback share underlying graphics while toggling color accents. The approach reduces software validation overhead, which is crucial as update cadence accelerates. Commercial operators watch reliability metrics; once solid-state clusters prove durable in the field, adoption broadens to buses and last-mile delivery trikes with escalating cargo-visibility needs.
By Propulsion Type: ICE Dominates, BEVs Accelerate
Internal-combustion vehicles held 71.35% of the Automotive instrument cluster market share in 2025, maintaining numerical supremacy through established manufacturing footprints and fuel-price pragmatism. Battery electric vehicles, expanding at 9.92% CAGR, inject new data layers, charge rate, regenerative intensity, and thermal conditioning into the cluster canvas. Hybrid drivetrains further complicate visuals, as drivers juggle petrol range with battery charge, prompting gauge architectures that flip seamlessly between modes. Fuel-cell electric prototypes require hydrogen pressure and stack status readouts, foreshadowing future gauge sets.
The Automotive instrument cluster market is thus segmented by propulsion-specific widgets rather than screen type alone. Graphics toolkits include modular tiles, state-of-charge bars, efficiency rings, and boost indicators that activate based on the powertrain. This configurable approach sidesteps costly hardware variants, supporting assembly line flexibility. Car buyers migrating to electric platforms already expect crisp, informative displays; clusters that lag smartphone smoothness risk damaging brand perception. Consequently, suppliers treat BEV clusters as the spearhead for innovation, later back-porting learnings to combustion models still in high-volume production.
By Display Technology: TFT Leads, OLED Gains Premium
Thin-film-transistor panels accounted for 61.22% of the Automotive instrument cluster market share in 2025, owing to mature, high-yield fabs and stable backlights. Organic light-emitting diode panels, growing at a 8.76% CAGR, appeal to luxury marques seeking bezel-less curves and perfect black levels that elevate perceived cabin quality. LCD and analog gauges persist where budget constraints dictate, though even entry trims increasingly pair basic LCD squares with pointer rings. Head-up displays supplement, but seldom replace, the cluster, reinforcing its role as the primary information hub.
As the Automotive instrument cluster market adopts emissive screens, suppliers face longevity concerns about OLED burn-in. Software mitigations include pixel-shifting and adaptive brightness maps that even out wear. On the plus side, flexible substrates shed weight and let designers wrap screens across dashboard wings, delivering panoramic layouts without seam gaps. TFT suppliers counter with advanced in-cell touch and mini-LED back-lights, narrowing visual disparity.
By Sales Channel: OEM Dominates, Aftermarket Retrofits Surge
Original-equipment shipments represented 87.41% of the Automotive instrument cluster market share in 2025 because carmakers specify clusters during platform development and tie them into vehicle networks. Retrofit kits, however, grow at a 9.34% CAGR as enthusiasts modernize their dashboards without buying new cars. Plug-and-play clusters replicate factory fit yet add smartphone mirroring and theme switching; some even retain warranty by using official part numbers.
Inside the Automotive instrument cluster market, the aftermarket breeds creativity, and smaller vendors embed micro-telematics modules that bypass the vehicle CAN bus, delivering cloud-based over-the-air updates without automaker involvement. Yet the tide favors OEM-supplied hardware, as zonal architectures merge cluster and infotainment logic onto a single SoC, making substitution technically daunting. Regulation also matters: cybersecurity approval processes dissuade many retrofit businesses from touching mission-critical displays, slowing grey-market proliferation.
Geography Analysis
North America secured 35.66% of the Automotive instrument cluster market share in 2025, aided by strong pickup and SUV output and consumers eager for large, configurable screens. Federal distraction guidelines press Detroit automakers to validate font clarity and alert priorities, influencing global design language. The region also pilots over-the-air updates that monetize theme bundles, giving suppliers a North American test bed before global rollout. Supply disruptions during semiconductor shortages spurred interest in near-shoring, driving fresh investment in Mexican electronics plants that can meet USMCA rules while shortening lead times. Emerging state-level mandates for haptic feedback and minimum luminance during night driving further shape the back-light requirements for clusters.
Asia-Pacific is the fastest climber, slated for an 8.05% CAGR through 2031. China’s electrification push demands clusters tuned to battery analytics, while its 2027 mandate for physical switches safeguards critical controls, confirming the cluster’s enduring role. India, the world’s largest two-wheeler market, is seeing rapid adoption of TFT displays as riders seek navigation prompts and call alerts. Local assembly of panel modules in Andhra Pradesh reduces tariff load and secures supply. Japan leverages deep display expertise to export high-contrast panels, although plant consolidations signal a shift toward higher-margin OLED lines. Southeast Asian nations welcome budget electric scooters with small color clusters, opening new volume tiers.
Europe remains a technology trendsetter despite slower overall expansion. Luxury OEMs experiment with curved OLED clusters spanning the driver and passenger zones, using software to dynamically allocate space between navigation and entertainment. Cybersecurity governance, anchored by UNECE regulations, adds certification costs but also underwrites trust among premium buyers. The continent’s safety rules require clusters to host driver-assist icons, coaxing analog holdouts toward hybrid or full digital systems. Geopolitical energy volatility nudges fleets to electrified vans whose dashboards showcase eco-driving scores. Eastern European contract manufacturers attract assembly programs that hedge Western brands against single-country risk, and EU carbon border rules may further promote local sourcing of critical sub-components within their clusters.

Competitive Landscape
The Automotive instrument cluster market shows moderate concentration. Five Tier-1 integrators dominate long-term supply agreements with global carmakers, yet agile newcomers exploit white space in niche electric brands. Continental, Denso, Bosch, Visteon, and Nippon Seiki collectively anchor platform design wins, drawing on proprietary graphics middleware and in-house toolchains that sync with automaker over-the-air servers. Recent recalls, for example, such as Ford’s dark-screen event, underscore why reliability and field-failure analytics remain key differentiators.
Chinese display giants scale aggressively, leveraging high-volume consumer-electronics fabs to offer automotive-grade panels at compelling cost. Their entry reshapes the sourcing map, prompting incumbent Tier-1s to deepen alliances with software companies that add perception-layer visuals and cloud analytics. Cyber-security certifications under R155 elevate barriers to entry; vendors that ship pre-audited secure-boot frameworks shorten carmaker validation cycles. Cooperative deals, such as joint development of driver-assist visualization pipelines, signal a shift from hardware margins to software subscription value.
Aftermarket specialists cultivate brand-enthusiast communities, releasing clusters tailored to specific model lines with factory look-and-feel. Yet as OEMs lock VIN-based cryptography into new architectures, retrofit installations require official provisioning tokens and throttle gray imports. Partnerships between Tier-1s and chipmakers aim to integrate ISP blocks for camera feeds directly into cluster SoCs, consolidating the bill of materials while enabling mirror-replacement video. Over the forecast period, success hinges on balancing compliance discipline with rapid HMI innovation; firms that master both are poised to expand their footprint in the Automotive instrument cluster market.
Automotive Instrument Cluster Industry Leaders
-
Continental AG
-
Denso Corporation
-
Robert Bosch GmbH
-
Visteon Corporation
-
Nippon Seiki Co., Ltd.
- *Disclaimer: Major Players sorted in no particular order

Recent Industry Developments
- April 2026: Leapmotor selected BlackBerry QNX as the core operating system for its upcoming premium electric SUV, enabling a unified controller to manage both cluster graphics and driver-assistance logic.
- January 2026: Mack Trucks launched a refreshed digital cluster on the TerraPro model, adding the Co-Pilot interface that streams telematics alerts and fuel-economy data directly to the driver.


Global Automotive Instrument Cluster Market Report Scope
The Automotive Instrument Cluster market is analyzed across cluster type, vehicle type, propulsion type, display technology, sales channel, and geography.
By Cluster Type, the market is segmented into Analog, Digital, and Hybrid Clusters. By Vehicle Type, the market is segmented into Two-Wheelers, Three-Wheelers, Passenger Cars, Light Commercial Vehicles, Medium and Heavy Commercial Vehicles, and Buses and Coaches. By Propulsion Type, the market is segmented into Internal Combustion Engine (ICE), Battery Electric Vehicle (BEV), Plug-in Hybrid Electric Vehicle (PHEV), Hybrid Electric Vehicle (HEV), and Fuel Cell Electric Vehicle (FCEV). By Display Technology, the market is segmented into Analog Gauge, LCD, OLED, TFT, and HUD (Head-Up Display). By Sales Channel, the market is segmented into OEM and Aftermarket. By Geography, the market is segmented into North America (United States, Canada, and Rest of North America), South America (Brazil, Argentina, and Rest of South America), Europe (United Kingdom, Germany, Spain, Italy, France, Russia, and Rest of Europe), Asia-Pacific (India, China, Japan, South Korea, and Rest of Asia-Pacific), and Middle East and Africa (United Arab Emirates, Saudi Arabia, Turkey, Egypt, South Africa, and Rest of Middle East and Africa).
Market forecasts are provided in terms of Value (USD).
| Analog Cluster |
| Digital Cluster |
| Hybrid Cluster |
| Two-Wheelers |
| Three-Wheelers |
| Passenger Cars |
| Light Commercial Vehicles (LCV) |
| Medium and Heavy Commercial Vehicles (MHCVs) |
| Buses and Coaches |
| Internal Combustion Engine (ICE) |
| Battery Electric Vehicle (BEV) |
| Plug-in Hybrid Electric Vehicle (PHEV) |
| Hybrid Electric Vehicle (HEV) |
| Fuel Cell Electric Vehicle (FCEV) |
| Analog Gauge |
| LCD |
| OLED |
| TFT |
| HUD (Head-Up Display) |
| Original Equipment Manufacturer (OEM) |
| Aftermarket |
| North America | United States |
| Canada | |
| Rest of North America | |
| South America | Brazil |
| Argentina | |
| Rest of South America | |
| Europe | United Kingdom |
| Germany | |
| Spain | |
| Italy | |
| France | |
| Russia | |
| Rest of Europe | |
| Asia-Pacific | India |
| China | |
| Japan | |
| South Korea | |
| Rest of Asia-Pacific | |
| Middle East and Africa | United Arab Emirates |
| Saudi Arabia | |
| Turkey | |
| Egypt | |
| South Africa | |
| Rest of Middle East and Africa |
| By Cluster Type | Analog Cluster | |
| Digital Cluster | ||
| Hybrid Cluster | ||
| By Vehicle Type | Two-Wheelers | |
| Three-Wheelers | ||
| Passenger Cars | ||
| Light Commercial Vehicles (LCV) | ||
| Medium and Heavy Commercial Vehicles (MHCVs) | ||
| Buses and Coaches | ||
| By Propulsion Type | Internal Combustion Engine (ICE) | |
| Battery Electric Vehicle (BEV) | ||
| Plug-in Hybrid Electric Vehicle (PHEV) | ||
| Hybrid Electric Vehicle (HEV) | ||
| Fuel Cell Electric Vehicle (FCEV) | ||
| By Display Technology | Analog Gauge | |
| LCD | ||
| OLED | ||
| TFT | ||
| HUD (Head-Up Display) | ||
| By Sales Channel | Original Equipment Manufacturer (OEM) | |
| Aftermarket | ||
| By Geography | North America | United States |
| Canada | ||
| Rest of North America | ||
| South America | Brazil | |
| Argentina | ||
| Rest of South America | ||
| Europe | United Kingdom | |
| Germany | ||
| Spain | ||
| Italy | ||
| France | ||
| Russia | ||
| Rest of Europe | ||
| Asia-Pacific | India | |
| China | ||
| Japan | ||
| South Korea | ||
| Rest of Asia-Pacific | ||
| Middle East and Africa | United Arab Emirates | |
| Saudi Arabia | ||
| Turkey | ||
| Egypt | ||
| South Africa | ||
| Rest of Middle East and Africa | ||


Key Questions Answered in the Report
How large is the Automotive instrument cluster market in 2026 and how fast will it grow?
The Automotive instrument cluster market size is projected to expand from USD 10.23 billion in 2025 and USD 11.04 billion in 2026 to USD 16.13 billion by 2031, registering a 7.89% CAGR between 2026 and 2031.
Which vehicle category buys the most clusters?
Passenger cars accounted for 56.21% of global revenue in 2025, making them the single-largest buyer group.
What technology currently dominates cluster displays?
Thin-film-transistor panels lead with 61.22% market share due to mature supply chains and stable pricing.
Why are digital clusters critical for electric vehicles?
Digital layouts reveal battery state, regenerative braking intensity and real-time range predictions, all essential for managing driver range anxiety and complying with EV safety rules.
Page last updated on:


