Zambia Telecom Towers Market Size and Share
Market Overview
| Study Period | 2019 - 2030 |
|---|---|
| Forecast Data Period | 2025 - 2030 |
| Historical Data Period | 2019 - 2023 |
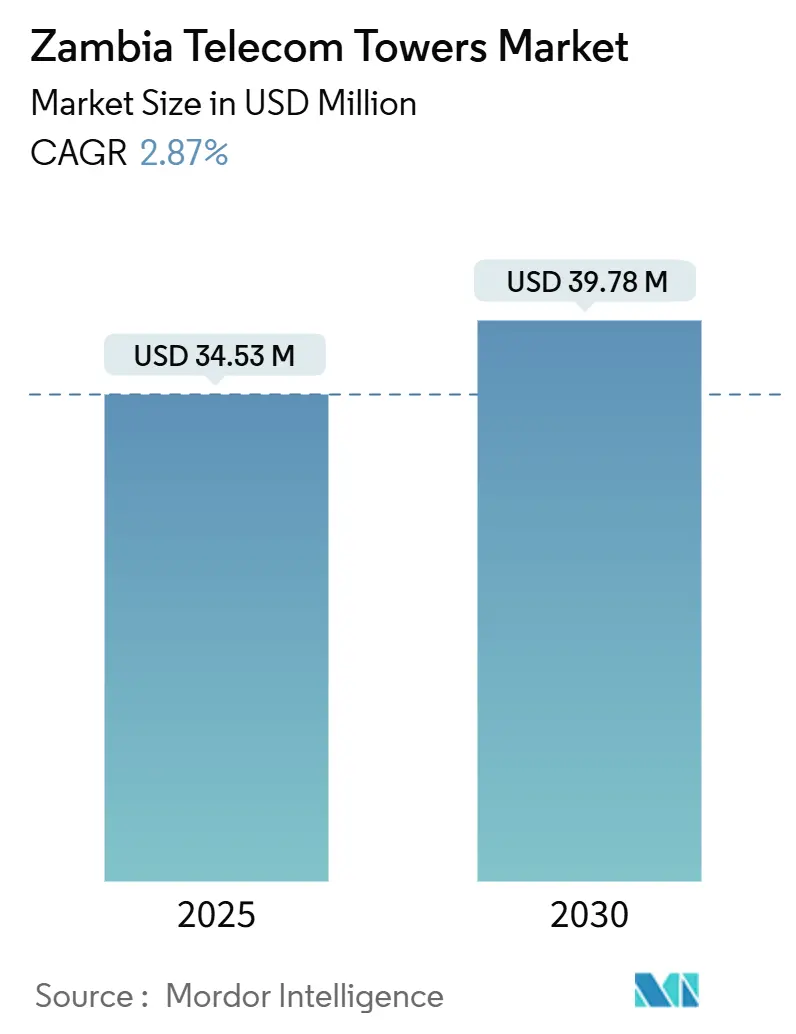
| Market Size (2025) | USD 34.53 Million |
| Market Size (2030) | USD 39.78 Million |
| Growth Rate (2025 - 2030) | 2.87% CAGR |
| Market Concentration | High |
Major Players *Disclaimer: Major Players sorted in no particular order Image © Mordor Intelligence. Reuse requires attribution under CC BY 4.0. | |
Zambia Telecom Towers Market Analysis by Mordor Intelligence
The Zambia Telecom Towers Market size is estimated at USD 34.53 million in 2025, and is expected to reach USD 39.78 million by 2030, at a CAGR of 2.87% during the forecast period (2025-2030). In terms of installed base, the market is expected to grow from 3.63 thousand units in 2025 to 3.91 thousand units by 2030, at a CAGR of 1.45% during the forecast period (2025-2030).
The measured expansion reflects a maturing infrastructure segment dealing with persistent power-supply risk, currency volatility, and regulatory realignment that collectively temper headline growth. Independent tower companies continue to consolidate assets as operators migrate toward asset-light models, while ground-based towers remain the backbone of national coverage despite steadily rising rooftop deployments in Lusaka and the Copperbelt. Investment momentum stems from the World Bank-backed Digital Zambia Acceleration Project, the government’s 171-site build program, and mobile data traffic that has spiked following 4G densification and early-stage 5G launches. At the same time, severe load shedding has pushed operating costs higher, intensifying the shift toward solar-battery power systems and Power-as-a-Service contracts that guarantee uptime.
Key Report Takeaways
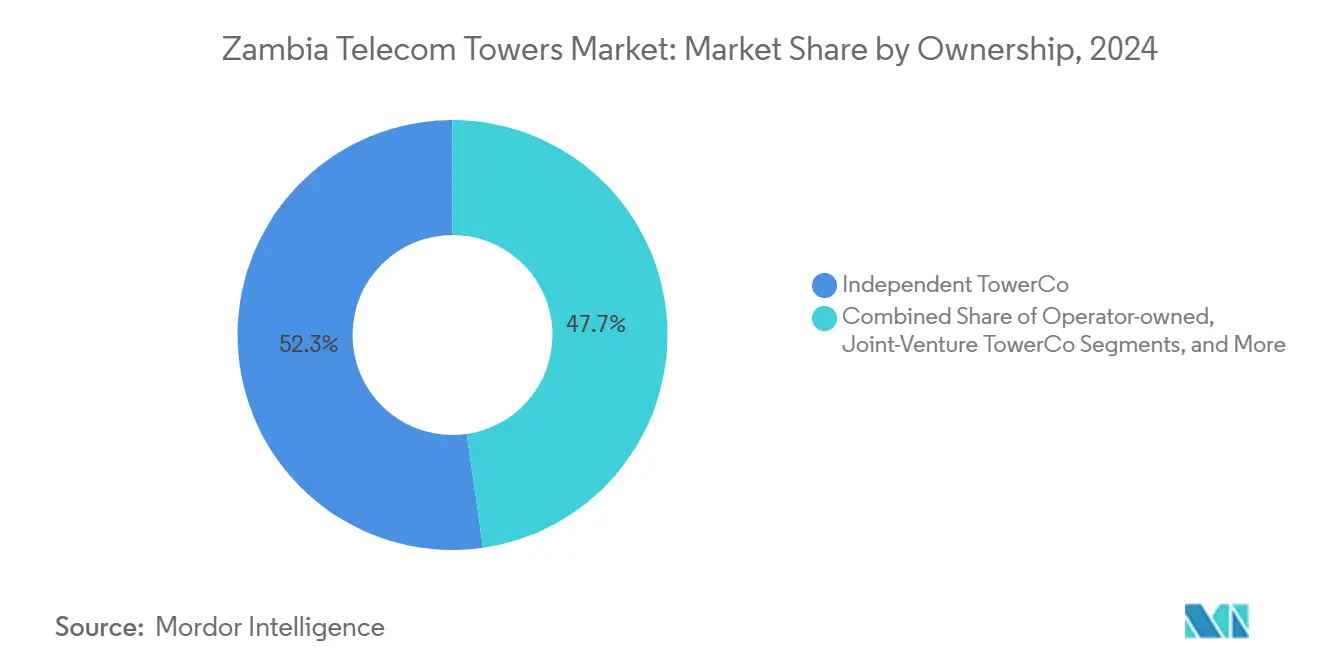
- By ownership, independent tower companies held 52.26% of the Zambia telecom tower market share in 2024 and are expanding at a CAGR of 5.95% through 2030.
- By installation type, the ground-based category commanded 78.80% share of the Zambia telecom tower market size in 2024; rooftop sites are projected to expand at a 7.59% CAGR through 2030.
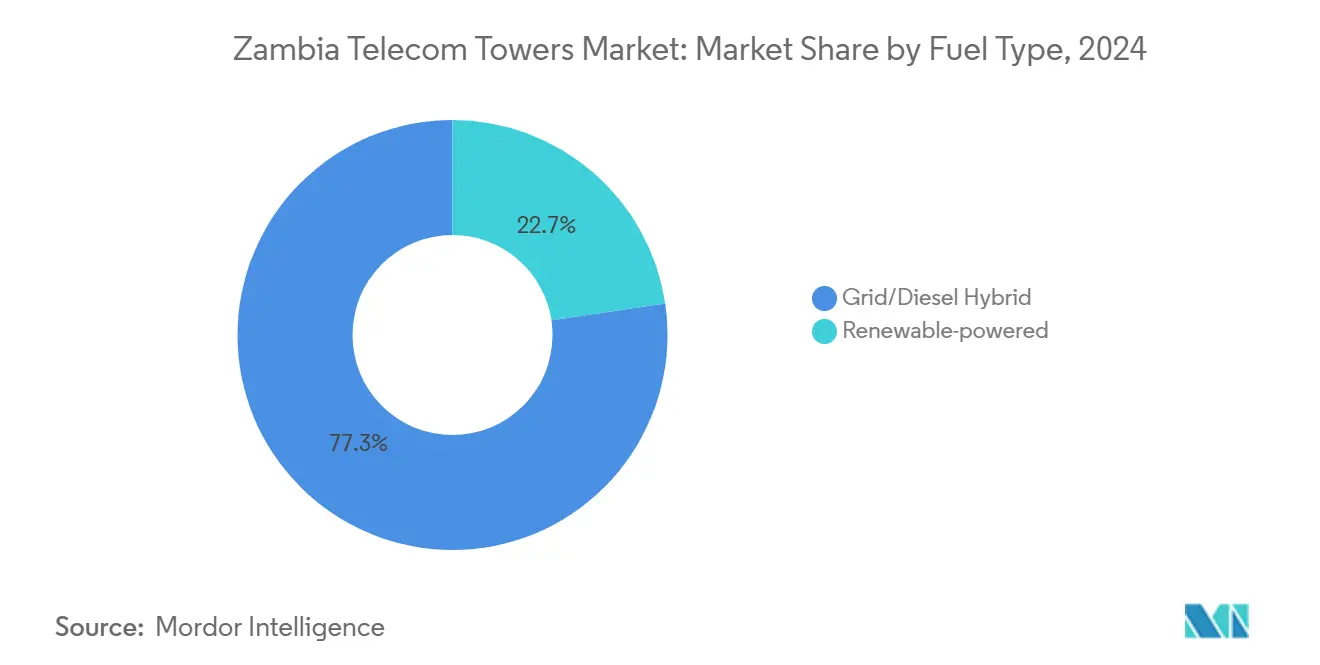
- By fuel type, grid/diesel hybrid systems accounted for 77.34% share of the Zambia telecom tower market size in 2024, whereas renewable-powered towers are advancing at a 16.58% CAGR to 2030.
- By tower type, monopole structures led with 36.93% of the Zambia telecom tower market share in 2024; stealth and concealed solutions are the fastest-growing segment, rising at a 10.66% CAGR to 2030.
Zambia Telecom Towers Market Trends and Insights
Drivers Impact Analysis*
| Driver | (~) % Impact on CAGR Forecast | Geographic Relevance | Impact Timeline |
|---|---|---|---|
| Rapid surge in mobile data traffic and 4G / early-stage 5G roll-outs | +1.2% | National, concentrated in Lusaka, Copperbelt, Ndola | Short term (≤ 2 years) |
| World Bank-backed "Digital Zambia Acceleration Project" last-mile funding | +0.8% | National, prioritizing rural and underserved areas | Medium term (2-4 years) |
| USD 14 Million Airtel-IHS program to add 152 rural and suburban sites | +0.3% | Rural and suburban areas nationwide | Short term (≤ 2 years) |
| Mobile subscriber base forecast to hit 24.5 million by 2025, raising tenancy demand | +0.5% | National, with urban concentration | Short term (≤ 2 years) |
| Grid unreliability spurring hybrid-solar tower retrofits and Power-as-a-Service | +0.4% | National, especially off-grid and rural areas | Medium term (2-4 years) |
| Prospective sale of IHS Zambia operations opens neutral-host M&A window | +0.2% | National infrastructure assets | Short term (≤ 2 years) |
| Source: Mordor Intelligence | |||
Rapid surge in mobile data traffic and 4G / early-stage 5G roll-outs
Data consumption is rising sharply as smartphone penetration surpasses 42% across Airtel Africa’s footprint, including Zambia [1]Staff Reporter, “Airtel Africa Grows Customer Base Despite Currency Challenges,” Developing Telecoms, developingtelecoms.com. MTN Zambia’s November 2022 5G launch in six cities, followed by Airtel’s July 2023 deployment, requires structural tower upgrades to accommodate heavier antennas and heightened backhaul needs. Densification targets 65% population coverage in Lusaka, Kitwe, and Ndola, spurring incremental tower builds where existing macro sites cannot meet latency or capacity thresholds. With only 1.3% of Zambia’s 3,568 towers hosting 5G equipment, the expansion runway for new sites and colocation leases is sizeable [2]Freedom House Analysts, “Zambia – Freedom on the Net 2024,” Freedom House, freedomhouse.org. Power systems also need reinforcement, nudging owners toward integrated solar-battery packs that stabilize energy availability during load shedding.
World Bank-backed “Digital Zambia Acceleration Project” last-mile funding
The USD 100 million facility marks the country’s largest coordinated broadband investment and directs capital into unserved rural districts, where fewer than 25% of citizens currently use the Internet [3]Parliament Secretariat, “Friday Sitting – 27 September 2024,” National Assembly of Zambia, parliament.gov.zm. The Smart Zambia Institute streamlines permitting and enforces passive-infrastructure sharing, minimizing deployment friction and incentivizing neutral-host models. Tower firms gain predictable tenancy pipelines as government grants offset otherwise poor rural economics. Alignment with the national target of 96% broadband coverage by end-2024 elevates demand for ground-based and rooftop towers alike, broadening the Zambia telecom tower market’s addressable footprint.
USD 14 million Airtel-IHS program to add 152 rural and suburban sites
The bilateral capex plan expands Airtel’s coverage while lifting IHS tenancy ratios. Rural focus areas benefit from pre-designed solar-battery kits that generate 24-hour uptime at diesel-equivalent cost parity after duty-free PV imports. The initiative creates a template for future operator-TowerCo collaborations that share energy infrastructure risk, helping stabilize lease yields in the Zambia telecom tower market.
Mobile subscriber base forecast to hit 24.5 million by 2025, raising tenancy demand
Connections reached 16.4 million in December 2022 and are trending toward 24.5 million by 2025. Colocation ratios remain sub-optimal, so adding additional operators at existing sites provides margin-accretive growth for tower owners. Mobile money volumes, which widened 75% to USD 14.8 billion in 2022, suggest elevated data intensity that pushes capacity upgrades and co-investment in high-backhaul locations, especially along the Lusaka-Copperbelt corridor.
Restraints Impact Analysis*
| Restraint | (~) % Impact on CAGR Forecast | Geographic Relevance | Impact Timeline |
|---|---|---|---|
| Kwacha depreciation and double-digit inflation inflating lease and capex costs | -0.7% | National, affecting all infrastructure investments | Short term (≤ 2 years) |
| Hydropower-driven load-shedding boosting diesel OPEX and downtime risk | -0.9% | National, particularly rural and off-grid areas | Short term (≤ 2 years) |
| Slow commercial launch of fourth MNO Beeline delaying projected tenancies | -0.3% | National network deployment areas | Medium term (2-4 years) |
| Draft capital-gains tax on passive-infra divestments dampening valuations | -0.2% | National, affecting tower asset transactions | Medium term (2-4 years) |
| Source: Mordor Intelligence | |||
Kwacha depreciation and double-digit inflation inflating lease and capex costs
Local currency weakness has raised imported steel, concrete, and RF equipment prices, while USD-denominated lease obligations expose tower firms to foreign-exchange loss. Inflation near 10% compresses operator cash flow, reducing near-term build commitments. Smaller tower entities face higher financing costs, delaying project mobilization and moderating the Zambia telecom tower market’s annual rollout cadence. International investors adopt a wait-and-see posture, driving companies to rely on domestic credit lines with steeper interest rates.
Hydropower-driven load-shedding boosting diesel OPEX and downtime risk
Kariba North Bank’s partial shutdown in September 2024 removed 1,080 MW from the grid, triggering 20-hour daily blackouts. Diesel generators now supply as much as 60% of tower-site energy, inflating OPEX and accelerating maintenance cycles. Service interruptions erode MNO revenue and push tower owners to fast-track solar-battery retrofits, but up-front capex burdens strain liquidity. Sites in rural provinces suffer most because logistics add another layer of fuel cost, tightening the Zambia telecom tower market’s profitability band.
*Our forecasts treat driver/restraint impacts as directional, not additive. The impact forecasts reflect baseline growth, mix effects, and variable interactions.
Segment Analysis
By Ownership: Independent TowerCos Drive Infrastructure Efficiency
Independent TowerCos control 52.26% of installed sites, underpinning the Zambia telecom tower market’s structural pivot toward neutral-host models that unlock multi-tenant economics. The sub-segment’s 5.95% CAGR outpaces operator-owned portfolios as MNOs divest assets to free capital for spectrum and 5G upgrades. The Zambia telecom tower market size for independent players is projected to expand faster than the total market value through 2030, as consolidation opportunities emerge if IHS exits the country. Operator captivity persists for high-priority urban nodes, yet regulatory incentives for sharing keep deal pipelines active.
Efficiencies stem from optimized energy management and targeted rural builds where the World Bank and the Ministry of Technology and Science partially underwrite project debt. As tenancy ratios lift from sub-1.3 toward the regional 1.6 benchmark, independent portfolios generate stronger cash yields, cementing their role as growth engines of the Zambia telecom tower market.


By Installation: Ground-Based Dominance Amid Urban Rooftop Growth
Ground-based towers make up 78.80% of 2024 deployments and will retain share leadership because land remains accessible across most provinces. However, rooftop solutions are scaling quickly, clocking a 7.59% CAGR as Lusaka’s skyline densifies. Liberalized permitting has cut average rooftop site acquisition time by 60 days, supporting faster 5G roll-outs and boosting the Zambia telecom tower market size linked to urban infill projects.
Rooftop installations trim capex and circumvent community opposition to macro structures. They also pair naturally with solar panels that help mitigate chronic blackouts. By 2030, rooftops could represent one in five new Zambia telecom tower market additions in metropolitan clusters, reshaping vendor product mixes toward lighter monopoles and integrated concealment kits.
By Fuel Type: Renewable Transition Accelerates Energy Independence
Grid/diesel hybrid towers still own 77.34% share, yet renewable-powered sites exhibit a breakneck 16.58% CAGR, the fastest across any segmentation. Duty-free solar imports and VAT holidays introduced in 2024 sliced payback periods to as little as one year when diesel costs exceed USD 0.50/kWh. Consequently, the Zambia telecom tower market size devoted to renewable systems will more than double by 2030.
Power-as-a-Service contracts shift capex off tower owners’ balance sheets and guarantee 99.8% uptime, appealing to MNOs that prize service continuity. Lithium-ion batteries dominate storage selections because they support deeper discharge cycles and reduced maintenance, improving the lifetime economics of rural renewable towers.
By Tower Type: Stealth Solutions Lead Innovation Drive
Monopoles capture 36.93% share thanks to a balance of height and cost, yet stealth installations are logging a 10.66% CAGR as zoning bodies enforce stricter aesthetic codes in premium districts. The Zambia telecom tower market share for camouflage designs is still modest, but their high average revenue per site compensates for added fabrication costs.
Lattice towers remain indispensable for expansive rural coverage because they accommodate multiple tenants and heavy antenna loads, while guyed designs fill niche roles in ultra-remote regions. Regulatory agencies such as ZICTA now offer expedited approvals for stealth projects that incorporate community-friendly facades, making them an increasingly common choice for 5G street-level sites.
Geography Analysis
The Lusaka metropolitan area and the Copperbelt jointly house more than half of the national tower assets, driven by dense population clusters, industrial demand, and higher tenancy ratios that enhance site economics. In these hubs, the Zambia telecom tower market size associated with ground-based macro structures is complemented by a rising stock of rooftops atop commercial buildings. Network traffic in Lusaka surged 28% year-on-year in 2024, reinforcing the business case for incremental co-locations and micro-cell overlays to backhaul 5G small cells.
Central, Southern, and Eastern Provinces lag in coverage, with tower penetration hovering below 0.15 per km². Public funding under the 171-tower ZICTA build program directs capital into these underserved zones, lowering entry barriers for independent TowerCos that previously shunned sparsely populated areas because of low tenancy prospects. Renewable-first design templates dominate rural deployments where grid reach is limited and diesel distribution costs are prohibitive.
Border regions along major trade arteries toward Tanzania and the Democratic Republic of Congo are strategic for roaming and fiber gateway connectivity. Here, new tower placements support cross-border traffic and amplify lease opportunities from logistics firms and mining operators, underpinning incremental additions to the Zambia telecom tower market. Yet, chronic load shedding in these peripheral provinces complicates operations, cementing solar-battery hybrids as the default power architecture.
Competitive Landscape
Market structure remains consolidated: MTN controls 42% of mobile subscribers, Airtel 40%, and state-run Zamtel 16%. Zed Mobile’s 2024 license brings a fourth MNO, though commercial scale remains nascent. Independent TowerCos, led by IHS with 719 sites, dominate ownership; Infratel Corporation and Africa Mobile Networks fill secondary niches.
Strategic focus centers on portfolio resilience, energy transition, and rural coverage. MTN and Airtel offloaded non-core towers to fund 5G spectrum, pushing TowerCos to enhance power solutions. IHS committed USD 200 million to its Project Green renewable program, aiming to halve emissions intensity by 2030. Infratel piloted satellite backhaul for 30 sites, diversifying connectivity paths where fiber build-outs lag.
Regulation mandates passive-infrastructure sharing and environmental compliance. ZICTA’s faster permit process benefits neutral-host proposals that add rooftop or stealth sites in congested districts. TowerCos is able to guarantee over 99% uptime with hybrid-solar systems, gain pricing leverage, raise average rentals, and still cut MNO energy OPEX.
Zambia Telecom Towers Industry Leaders
IHS Towers Zambia
Infratel Corporation Ltd.
Africa Mobile Networks (AMN)
MTN Zambia
Airtel Zambia
- *Disclaimer: Major Players sorted in no particular order

Recent Industry Developments
- December 2024: Copperbelt Energy Corporation Renewables issued a USD 97 million green bond to expand the Itimpi Solar PV Plant to 236 MW, improving grid stability for telecom sites.
- November 2024: MTN Group launched 5G in Benin and Congo, underscoring a regional network upgrade cycle that informs vendor and spectrum strategies in Zambia.
- September 2024: The government confirmed completion of 202 new towers, including 171 financed by ZICTA at ZMW 409 million (USD 15.3 million), expanding rural coverage.


Zambia Telecom Towers Market Report Scope
| Operator-owned |
| Independent TowerCo |
| Joint-Venture TowerCo |
| MNO Captive |
| Rooftop |
| Ground-based |
| Renewable-powered |
| Grid/Diesel Hybrid |
| Monopole |
| Lattice |
| Guyed |
| Stealth / Concealed |
| By Ownership | Operator-owned |
| Independent TowerCo | |
| Joint-Venture TowerCo | |
| MNO Captive | |
| By Installation | Rooftop |
| Ground-based | |
| By Fuel Type | Renewable-powered |
| Grid/Diesel Hybrid | |
| By Tower Type | Monopole |
| Lattice | |
| Guyed | |
| Stealth / Concealed |


Key Questions Answered in the Report
How large is the Zambia telecom towers market in 2025?
It is valued at USD 34.53 million, with a forecast to reach USD 39.78 million by 2030 at a 2.87% CAGR.
Which ownership model leads Zambia’s tower landscape?
Independent TowerCos lead, holding 52.26% share in 2024 and growing faster than operator-owned portfolios.
What is driving rooftop tower growth in Zambia?
Urban densification, expedited permits, and 5G roll-outs support a 7.59% CAGR for rooftop installations through 2030.
How are power shortages shaping tower investments?
Chronic load shedding accelerates adoption of solar-battery systems, propelling renewable-powered towers at a 16.58% CAGR.
Which tower type is expanding quickest?
Stealth and concealed structures, favored in urban areas for aesthetic reasons, are growing at a 10.66% CAGR.
What impact will the Digital Zambia Acceleration Project have?
The USD 100 million program finances last-mile towers in underserved districts, expanding rural coverage and lifting tenancy demand.
Page last updated on:


