Philippines Telecom Towers Market Size and Share
Market Overview
| Study Period | 2020 - 2031 |
|---|---|
| Forecast Data Period | 2026 - 2031 |
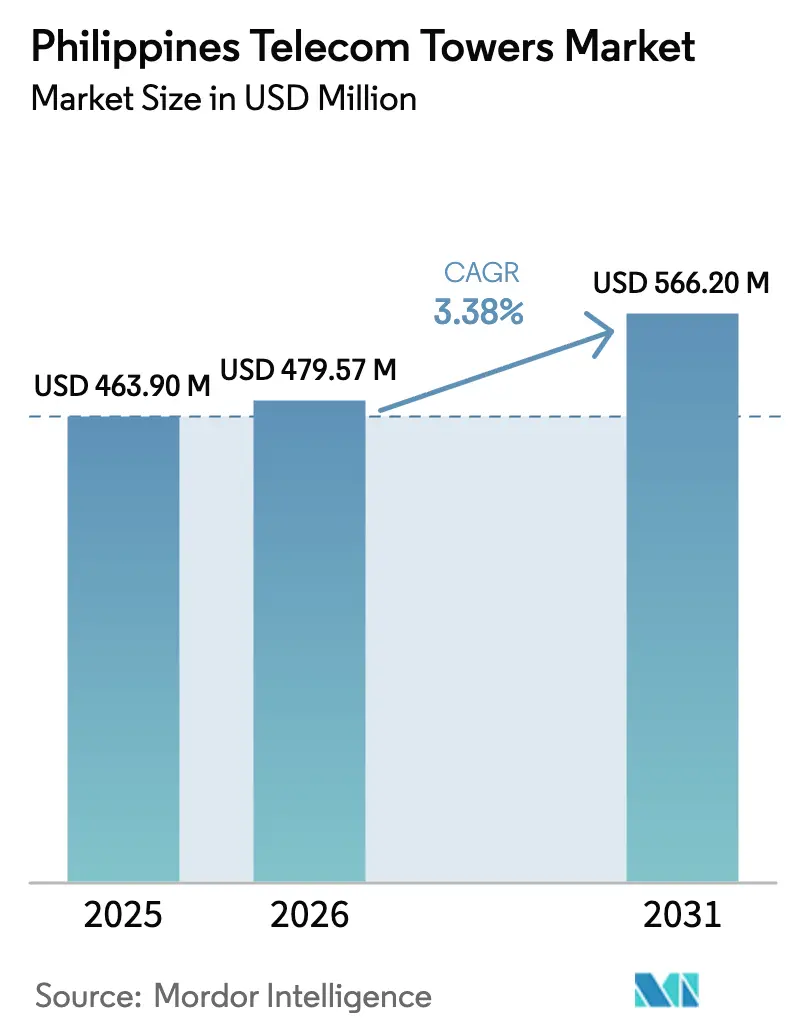
| Base Year Market Size (2025) | USD 463.90 Million |
| Market Size (2026) | USD 479.57 Million |
| Market Size (2031) | USD 566.2 Million |
| Growth Rate (2026 - 2031) | 3.38% CAGR |
| Market Concentration | High |
Major Players *Disclaimer: Major Players sorted in no particular order Image © Mordor Intelligence. Reuse requires attribution under CC BY 4.0. | |
Philippines Telecom Towers Market Analysis by Mordor Intelligence
The Philippines Telecom Towers Market size was valued at USD 463.90 million in 2025 and estimated to grow from USD 479.57 million in 2026 to reach USD 566.2 million by 2031, at a CAGR of 3.38% during the forecast period (2026-2031).
Demand now pivots from large-scale greenfield rollout toward portfolio optimization, energy efficiency, and colocation growth. Independent tower companies continue to acquire assets from mobile network operators, unlocking capital for 5G densification and network modernization. The push for renewable-powered sites, the Common-Tower Policy, and streamlined permitting have cut average site-build time, while sustained 5G traffic growth is keeping tenancy ratios on an upward trend. At the same time, typhoon-resilient design mandates, labor shortages, and right-of-way disputes temper the overall growth tempo of the Philippines telecom towers market.
Key Report Takeaways
- By ownership, Independent TowerCo entities held 34.25% of Philippines telecom towers market share in 2025 and are forecast to grow at a 10.31% CAGR through 2031.
- By installation, ground-based structures commanded 57.05% revenue share in 2025, while rooftop deployments are advancing at a 4.41% CAGR to 2031.
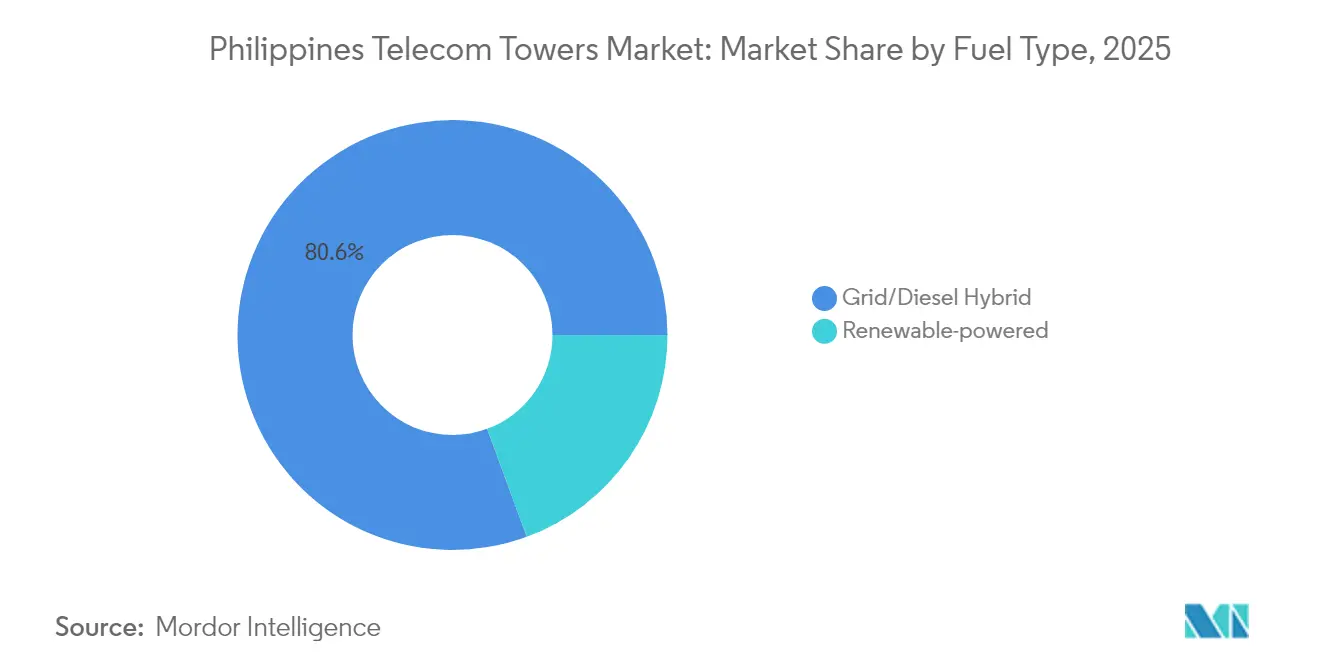
- By fuel type, grid/diesel hybrids accounted for 80.62% of Philippines telecom towers market size in 2025; renewable systems are expected to expand at an 18.22% CAGR through 2031.
- By tower type, monopole designs led with 50.05% share of Philippines telecom towers market size in 2025, whereas stealth variants post the fastest 4.83% CAGR to 2031.
- Smart Communications, Globe Telecom, and DITO Telecommunity together operated more than 16,000 sites in 2024, a combined footprint equating to 68% of active infrastructure nationwide.
Note: Market size and forecast figures in this report are generated using Mordor Intelligence’s proprietary estimation framework, updated with the latest available data and insights as of 2026.
Philippines Telecom Towers Market Trends and Insights
Drivers Impact Analysis*
| Driver | ( ~ ) % Impact on CAGR Forecast | Geographic Relevance | Impact Timeline |
|---|---|---|---|
| Common-Tower Policy and streamlined permitting | +0.8% | Nation-wide; early gains in Metro Manila, Cebu, Davao | Medium term (2-4 years) |
| 5G rollout fuelling data-traffic growth | +1.2% | Urban clusters and economic zones | Short term (≤ 2 years) |
| Operator sale-and-leaseback monetization wave | +0.6% | Country-wide | Short term (≤ 2 years) |
| Typhoon-resilient monopole replacement mandate | +0.4% | Eastern seaboard and Mindanao | Long term (≥ 4 years) |
| Micro-grid and renewable hybrids enabling remote-island builds | +0.3% | Remote islands and GIDA locations | Long term (≥ 4 years) |
| Meralco pole-attachment corridors for urban densification | +0.2% | Metro Manila | Medium term (2-4 years) |
| Source: Mordor Intelligence | |||
5G Rollout Fuelling Data-Traffic Growth
Mobile data traffic nearly doubled between 2023 and 2024 as Globe and Smart switched on more than 5,000 additional 5G sites, improving download speeds and coverage reliability. Globe now covers 97% of Metro Manila with outdoor 5G while Smart surpasses 2,600 live 5G sites nationwide. [1]Globe Telecom, “Investor Presentation Q1 2025,” globe.com.phHigher spectral efficiency demands denser site grids, which raises average tenancy per tower from 1.21 in 2024 to 1.38 by 2026. Independent tower companies benefit from this uplift because every incremental tenant improves rental yield with limited extra opex. Despite capex compression among operators, 5G traffic keeps pressuring networks to secure new colocations or small cell rooftops, ensuring sustained order pipelines for the Philippines telecom towers market.
Operator Sale-and-Leaseback Monetization Wave
PLDT and Globe together divested more than 15,000 towers between mid-2023 and late-2024, unlocking PHP 194 billion that is being rerouted to spectrum fees and core systems. [2]PLDT Inc., “Tower Sale Factsheet,” pldt.comThe asset-light strategy transfers maintenance risk to neutral hosts while granting operators 15-year master lease agreements. Independent TowerCo platforms gain scale, lower procurement costs, and negotiate better power contracts. The wave also changes bargaining dynamics, because fewer but larger landlords can standardize average lease rates and introduce power-as-a-service add-ons, which lift recurring revenue per site and accelerate EBITDA margin expansion.
Common-Tower Policy and Streamlined Permitting
Executive Order 32 obliges local agencies to process a complete tower application in 16 working days. Since its rollout, more than 8,300 permits have cleared the system, compared with fewer than 4,000 annually before 2023. The one-stop digital portal eliminates redundant documentary requirements and caps local fees, reducing average build cycle from 240 days to below 150 days. It also makes sharing compulsory in priority GIDA locations, creating anchor-tenant commitments that de-risk rural projects. Faster approvals and mandated colocation underpin the Philippines telecom towers market because quicker time-to-revenue tightens the payback period and unlocks new greenfield locations previously deemed uneconomical.
Typhoon-Resilient Monopole Replacement Mandate
Over 20 tropical cyclones typically hit the archipelago each year. In response, the National Telecommunications Commission has upgraded wind-load specifications to 330 kph in coastal Luzon and 300 kph in Visayas. Tower owners began replacing aging lattice assets with high-grade monopoles that hold tighter sway tolerances. EdgePoint retrofitted 420 towers in 2024 using galvanized steel rated for typhoon resistance. The replacement program mitigates downtime penalties and improves network resilience, translating into premium lease rates in exposed zones. Although the mandate raises capex per tower by 11% on average, operators accept the hike to secure service continuity and protect brand equity during extreme weather.
Restraints Impact Analysis*
| Restraint | ( ~ ) % Impact on CAGR Forecast | Geographic Relevance | Impact Timeline |
|---|---|---|---|
| Land-acquisition and right-of-way disputes persist | -0.7% | Urban cores and ancestral domains | Medium term (2-4 years) |
| MNO capex squeeze from flat ARPU | -0.9% | Nationwide | Short term (≤ 2 years) |
| Grid-tie delays to renewable-hybrid sites | -0.3% | Remote islands | Long term (≥ 4 years) |
| Shortage of certified tower climbers | -0.4% | Major build corridors | Medium term (2-4 years) |
| Source: Mordor Intelligence | |||
MNO Capex Squeeze from Flat ARPU
Blended mobile ARPU remained at PHP 126 per month during 2024, limiting revenue headroom. Globe trimmed 2025 capex to below USD 1 billion and PLDT sliced outlays to USD 1.3 billion, redirecting funds toward debt service and digital platforms. Leaner budgets translate into fewer build-to-suit orders and longer renewal negotiations. Even so, operators are locked into long-term leases signed during divestitures, which partly cushions the pullback for tower owners. To adapt, Independent TowerCos diversify into energy-as-a-service, fiber backhaul, and edge shelter leasing, tapping incremental revenue pools to offset softer new-build demand.
Land-Acquisition and ROW Disputes Persist
Negotiating land leases can take over 300 days in Metro Manila where titles frequently overlap and residents contest visual impact. In ancestral domains, consent procedures under Republic Act 8371 add extensive community consultations. Such disputes delay commissioning schedules and drag on cash flows. Tower firms increasingly pivot to rooftop leases, electric-utility poles, and flyover under-deck locations that circumvent fresh land purchases. Nonetheless, litigation over right-of-way continues to erode velocity, shaving an estimated 0.7 percentage points off forecast CAGR for the Philippines telecom towers market.
*Our forecasts treat driver/restraint impacts as directional, not additive. The impact forecasts reflect baseline growth, mix effects, and variable interactions.
Segment Analysis
By Ownership: Independent TowerCos Drive Consolidation
Independent TowerCos control 34.25% of active sites and are expanding at 10.31% CAGR to 2031. The Philippines telecom towers market size for this segment reached USD 158.9 million in 2025. Scale acquisitions, such as PhilTower-MIDC’s merger that formed a 3,300-site portfolio, improve bargaining power with suppliers and tenants. The higher tenancy ratio, averaging 1.46 versus 1.18 for operator-owned assets, bolsters free cash flow and accelerates debt amortization. Joint-venture TowerCos operate as transitional vehicles, often spinning out to full independence once maturity thresholds are met. MNO captive towers remain vital in high-security or mission-critical zones, yet their share continues to slip as carriers shift toward capital-light models.
Competitive intensity among neutral hosts heightens as EdgePoint, Unity Digital, and edotco vie for the same pipelines. The winning strategies revolve around rapid colocation onboarding, integrated power services, and predictive maintenance powered by digital twins. A focused buy-and-build playbook is expected to push Independent TowerCo share close to 45% by 2031, reshaping the overall power balance within the Philippines telecom towers market.


By Installation: Ground-Based Dominance with Rooftop Acceleration
Ground-based sites held 57.05% revenue in 2025, equal to 11,200 active structures. Growth moderates to 2.0% annually as most macro coverage obligations have been met along national highways and suburban clusters. Meanwhile, rooftop installations post a 4.41% CAGR, rising from 4,720 units in 2025 to more than 6,100 by 2031. The densification requirement in dense barangays and business districts encourages operators to prefer rooftops that shortcut land-use conflicts. The Philippines telecom towers market share skew remains toward ground-based sites in rural Luzon and Mindanao, but metro areas will see half of all new urban nodes sited on building tops or utility poles. Rooftop deals also suit power-as-a-service models where the building owner’s grid connection supplies primary electricity.
By Fuel Type: Renewable Transition Accelerates
Grid/diesel hybrids retained 80.62% of Philippines telecom towers market share in 2025, translating to a Philippines telecom towers market size of roughly USD 374 million that year. Their dominance stems from grid reach across Luzon and reliable diesel backup during frequent outages. Yet operating costs keep rising because diesel logistics can account for 35% of site opex in remote islands, prompting owners to replace gensets with solar-battery kits wherever irradiation and rooftop area allow. Frontier Tower Associates converted 220 sites to solar hybrids in 2024, cutting fuel truck rolls by 70% and narrowing payback to 30 months. The business case improves further when inverter-battery packages are bundled under 10-year power-as-a-service contracts that lock in flat escalators.
Renewable-powered systems make up the remaining 19.38% of installed base but are scaling at an 18.22% CAGR, the fastest among all segment types. EdgePoint demonstrated a 78% carbon-dioxide reduction on 160 solar-only sites while maintaining 99.95% uptime, convincing lenders such as the Asian Development Bank to extend green-bond financing at sub-6% coupons. For island provinces like Palawan and Samar, renewables now underwrite project feasibility because diesel delivery adds USD 0.30 per kWh to lifecycle costs. DICT also grants two-year spectrum-fee rebates for solar-hybrid builds in Geographically Isolated and Disadvantaged Areas, improving internal rates of return by up to 180 basis points. As panel prices tumble and lithium-iron-phosphate batteries last beyond 6,000 cycles, renewable share of Philippines telecom towers market size is expected to exceed 30% by 2031.
By Tower Type: Monopole Leadership with Stealth Growth
Monopole structures commanded 50.05% of Philippines telecom towers market size in 2025, equal to more than 9,800 standing sites. These single-shaft towers combine higher wind-load tolerance with reduced land footprint, meeting the typhoon-resilience mandate that applies to coastal Luzon and Eastern Visayas. Construction costs average USD 120,000 per monopole—15% cheaper than four-leg lattice—while erection time falls below 18 days, accelerating revenue recognition for Independent TowerCos. Their structural simplicity also supports quick antenna swaps when tenants refarm bands for 5G, sustaining the format’s popularity even as rollout momentum moderates.
Stealth or concealed towers account for only 6.5% of inventory but post the fastest 4.83% CAGR to 2031 as local governments tighten zoning aesthetics. Globe installed 72 camouflaged monopines in gated subdivisions during 2024 to win homeowner association approvals without public hearings. Meanwhile, Meralco pilots fiberglass lamp-post hides attached to its pole network in Ortigas, blending telecom equipment with street furniture. The extra cladding adds 18% to capex yet lifts lease rates by up to PHP 7,500 per month because operators can market 5G coverage in high-income neighborhoods sooner. Lattice and guyed towers still serve high-capacity corridors, but their combined share keeps slipping as stealth formats resolve visual-impact objections that once stalled urban densification initiatives.
Geography Analysis
Metro Manila concentrates over 28.10% of installed towers, underpinned by 97% outdoor 5G coverage achieved by Globe and Smart. Cebu and Davao represent the second tier of activity, accounting for 11.85% and 8.92% of the national footprint, respectively. Despite saturation in these urban hubs, average tenancy continues to climb because corporate 5G and fixed-wireless rollouts demand additional spectrum layers. Central Visayas and Northern Mindanao exhibit rising new-build share, driven by manufacturing export zones and the Build Better More infrastructure program.
Remote islands like Palawan, Samar, and Batanes log the fastest build rates following DICT mandates obliging neutral hosts to extend service. Renewable-hybrid systems dominate here, given constrained grid availability and high diesel logistics cost. Coastal Luzon and Eastern Visayas remain a specialized niche where typhoon-grade monopoles command premium lease escalators. Across regions, policy pressure for universal service is steering capital toward under-served clusters, balancing commercial return with social objectives and shaping the regional mix of the Philippines telecom towers market.
Competitive Landscape
The market evolved from a tri-polar structure in 2023 to a moderate-consolidation scenario by 2025. The top five tower companies now own 63% of total sites. Frontier Tower Associates operates the largest estate at 4,100 sites, followed by PhilTower-MIDC at 3,300 and EdgePoint at 2,800. Each is investing in network operations centers, digital monitoring, and drone-based inspections to cut downtime. Power supply costs represent more than 35% of opex, prompting aggressive solar-hybrid retrofits. Meralco’s entry via Miescor Infrastructure introduces a utility-backed player able to bundle grid access with tower leasing, intensifying competition.
Strategic differentiation increasingly turns on value-added services. EdgePoint offers guaranteed uptime SLAs with liquefied petroleum gas backup for critical nodes, while Unity Digital pilots on-site edge compute cabinets for content caching. International investors such as KKR and GIC continue to pour equity, attracted by regulated lease terms and Philippines telecom towers market growth visibility. The evolving field positions scale, power innovation, and digital asset management as the primary success factors.
Philippines Telecom Towers Industry Leaders
Frontier Tower Associates PH (FTAP)
PhilTower-MIDC JV
EdgePoint Towers PH
Unity Digital Infrastructure
EDOTCO Philippines
- *Disclaimer: Major Players sorted in no particular order


Recent Industry Developments
- March 2025: Globe Telecom arranged PHP 20 billion in loans from BDO Unibank and Metrobank to fund 2025 network projects.
- February 2025: Globe Telecom posted 2024 service revenue of PHP 165.02 billion, a 2% year-on-year increase.
- January 2025: DITO Telecommunity allocated PHP 9 billion for 800 additional towers over 3 years.
- November 2024: PhilTower Consortium acquired 1,350 towers from Globe in a PHP 20 billion deal.


Philippines Telecom Towers Market Report Scope
Telecommunication towers come in various structures, such as monopoles, tripoles, lattice towers, guyed towers, self-supporting towers, poles, masts, and similar configurations. These towers house one or more telecommunication antennas, facilitating radio communication. They can be situated on the ground or atop a building, often including storage for equipment and electronic components. While these towers do not need constant staffing, they do require periodic maintenance. Driven by the rollout of 5G infrastructure, the expansion of telecom towers is poised to persist during the forecast period.
The Philippine telecom towers market is segmented by ownership (operator-owned, private-owned, and MNO captive), installation (rooftop and ground-based), and fuel type (renewable and non-renewable). The market sizes and forecasts are provided in terms of value in USD in for all the above segments.
| Operator-owned |
| Independent TowerCo |
| Joint-Venture TowerCo |
| MNO Captive |
| Rooftop |
| Ground-based |
| Renewable-powered |
| Grid/Diesel Hybrid |
| Monopole |
| Lattice |
| Guyed |
| Stealth / Concealed |
| By Ownership | Operator-owned |
| Independent TowerCo | |
| Joint-Venture TowerCo | |
| MNO Captive | |
| By Installation | Rooftop |
| Ground-based | |
| By Fuel Type | Renewable-powered |
| Grid/Diesel Hybrid | |
| By Tower Type | Monopole |
| Lattice | |
| Guyed | |
| Stealth / Concealed |


Key Questions Answered in the Report
What is the current value of the Philippines telecom towers market?
It is valued at USD 479.57 million in 2026 and is projected to rise to USD 566.2 million by 2031.
How fast is the tower sector growing in the Philippines?
The market is forecast to expand at a 3.38% CAGR from 2026 to 2031, driven by 5G densification and Independent TowerCo expansion.
Which ownership model is expanding the quickest?
Independent TowerCos show the highest growth, rising at a 10.31% CAGR through 2031 as operators divest assets to them.
Why are renewable-powered tower sites gaining traction?
Solar-hybrid systems cut diesel usage, lower carbon emissions, and improve uptime on remote islands with unstable grids.
How does 5G impact tower demand?
5G services require denser site grids, raising tenancy ratios and sustaining orders for both new builds and rooftop deployments.
What challenges slow tower rollout in urban areas?
Prolonged land-acquisition disputes and right-of-way issues can delay projects by up to 300 days in city centers.
Page last updated on:


