Europe Telecom Towers Market Size and Share
Market Overview
| Study Period | 2020 - 2031 |
|---|---|
| Forecast Data Period | 2026 - 2031 |
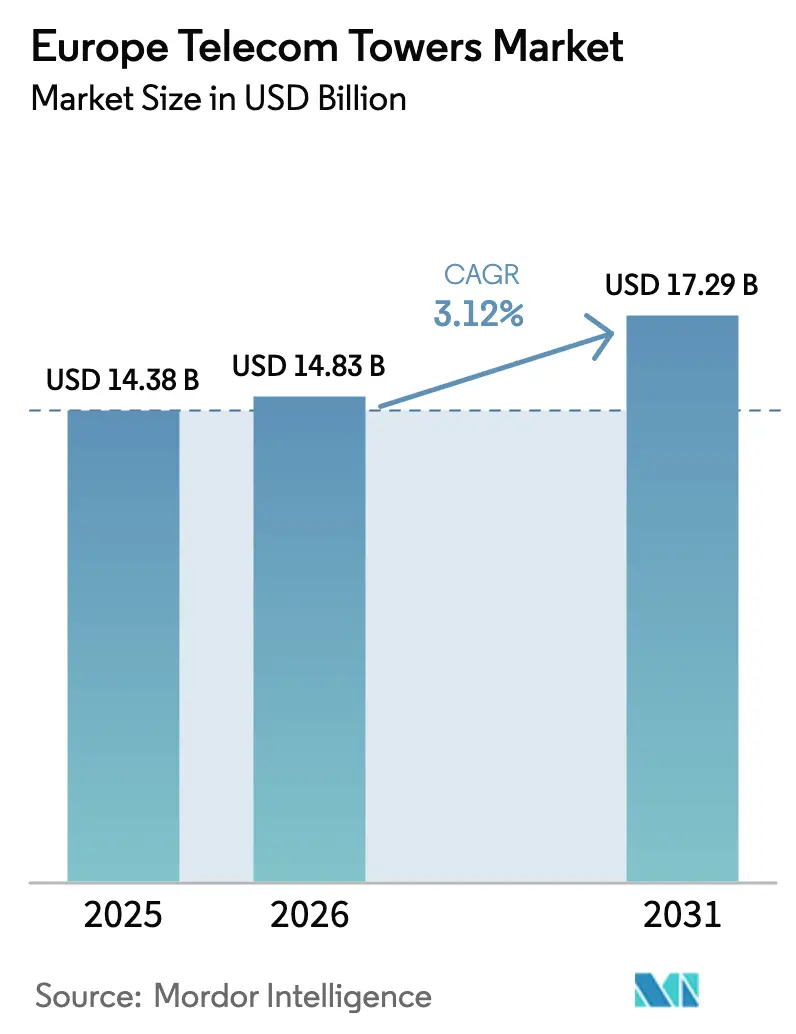
| Base Year Market Size (2025) | USD 14.38 Billion |
| Market Size (2026) | USD 14.83 Billion |
| Market Size (2031) | USD 17.29 Billion |
| Growth Rate (2026 - 2031) | 3.12% CAGR |
| Market Concentration | Medium |
Major Players *Disclaimer: Major Players sorted in no particular order Image © Mordor Intelligence. Reuse requires attribution under CC BY 4.0. | |
Europe Telecom Towers Market Analysis by Mordor Intelligence
The Europe Telecom Towers Market size was valued at USD 14.38 billion in 2025 and estimated to grow from USD 14.83 billion in 2026 to reach USD 17.29 billion by 2031, at a CAGR of 3.12% during the forecast period (2026-2031).
This growth unfolds as carriers offload passive assets to independent owners, triggering a decisive shift toward neutral-host infrastructure. Robust 5G rollouts, fiber-backhaul densification, and EU Green Deal incentives collectively sustain tower demand, while asset-light strategies free operator capital for service innovation. Independent TowerCos leverage multi-tenant economics to widen rural and urban coverage, and their scale advantages encourage the adoption of renewable power solutions. At the same time, municipal permitting delays in heritage zones and energy-price volatility temper short-term expansion plans.
Key Report Takeaways
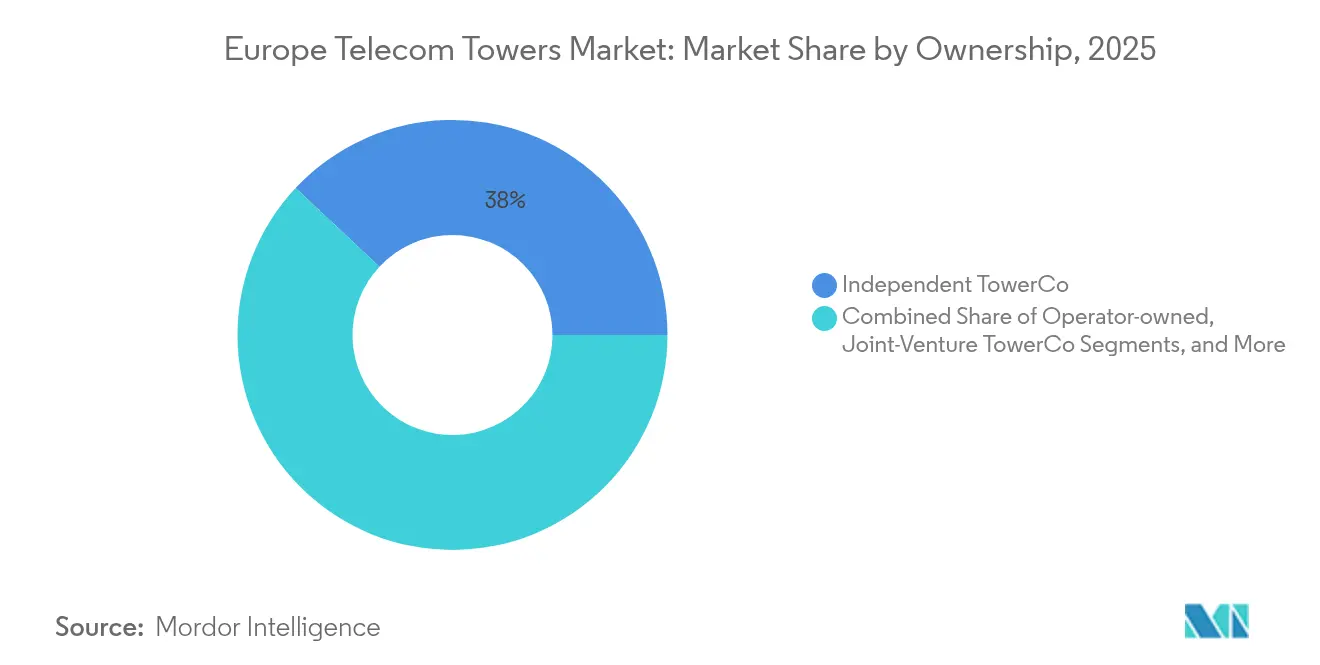
- By ownership, independent TowerCos led with 38.02% Europe telecom towers market share in 2025, and are expanding at a 8.85% CAGR to 2031.
- By installation, ground-based sites held 54.10% of the Europe telecom towers market size in 2025, and rooftop deployments are set to grow at a 3.76% CAGR to 2031.
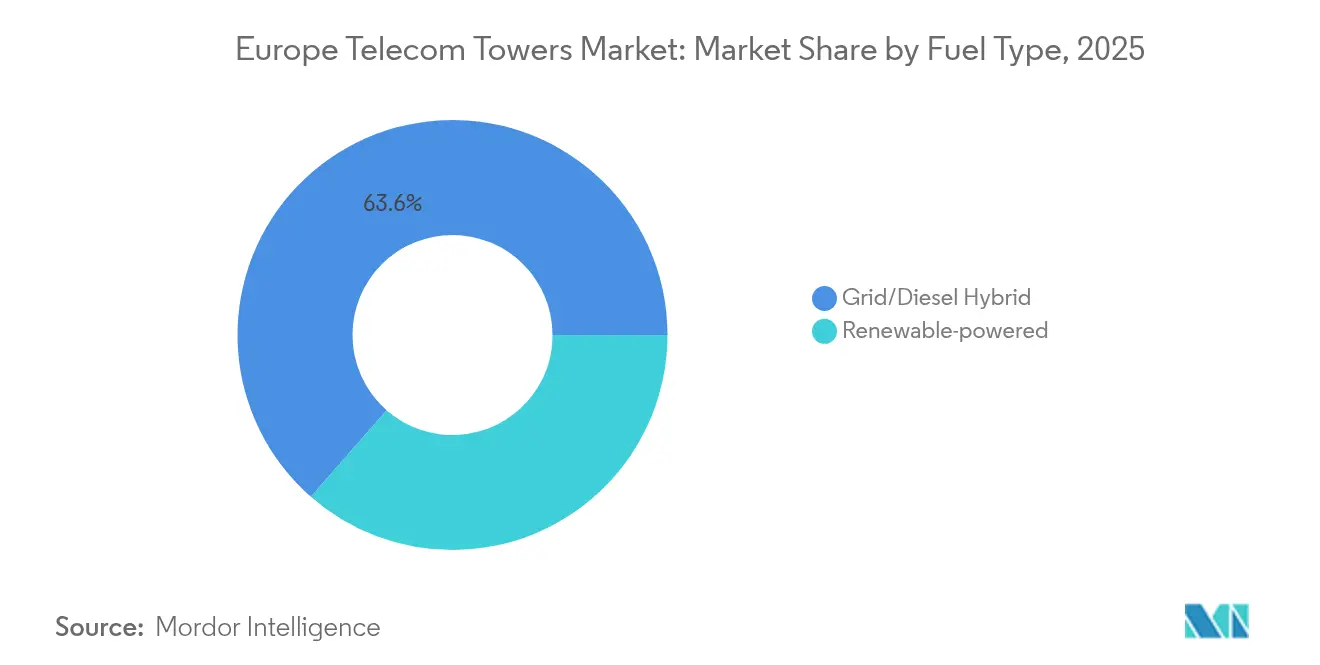
- By fuel type, grid/diesel hybrids accounted for 63.55% share of the Europe telecom towers market size in 2025, and renewable-powered sites are poised for a 13.78% CAGR through 2031.
- By tower type, monopoles commanded 49.75% Europe telecom towers market share in 2025, and stealth and concealed structures will expand at a 5.79% CAGR through 2031.
- By country, the rest of Europe held a 20.20% share of the Europe telecom towers market size in 2025, and will grow at a 5.82% CAGR by 2031.
Note: Market size and forecast figures in this report are generated using Mordor Intelligence’s proprietary estimation framework, updated with the latest available data and insights as of 2026.
Europe Telecom Towers Market Trends and Insights
Drivers Impact Analysis*
| Driver | (~) % Impact on CAGR Forecast | Geographic Relevance | Impact Timeline |
|---|---|---|---|
| Explosive 5G rollout requiring ≥70 k new macro sites | +1.5% | Germany, UK, France core markets | Medium term (2-4 years) |
| Fiber-backhaul densification favoring neutral-host models | +1.2% | Urban centers across Western Europe | Long term (≥4 years) |
| EU Green Deal incentives for renewable-powered sites | +0.8% | EU-wide with Nordic leadership | Long term (≥4 years) |
| Carriers’ aggressive network-light strategies (sale-lease-backs) | +0.6% | Germany, UK, Italy, Spain | Short term (≤2 years) |
| Integrated small-cell+ DAS contracting in transport hubs | +0.4% | Major metropolitan areas | Medium term (2-4 years) |
| AI-optimized siting cutting TCO by 15-20% | +0.3% | Nordics, Germany, Netherlands | Medium term (2-4 years) |
| Source: Mordor Intelligence | |||
5G Infrastructure Acceleration Reshapes Tower Demand
Europe needs roughly 70,000 additional macro sites by 2030 to sustain 5G performance requirements, propelling fresh opportunities for the Europe telecom towers market [1]GSMA, “5G Observatory Q4 2024,” gsma.com. 5G population coverage reached 76% in 2024, but industrial IoT and ultra-reliable services still require dense, low-latency networks. Independent TowerCos win the majority of new contracts as operators seek capital efficiency. Finland’s 85% availability showcases Nordic leadership that spurs competitive deployments in Western Europe. Network slicing multiplies revenue streams per structure, turning each tower into a shared digital platform.
Fiber-Backhaul Integration Drives Neutral-Host Adoption
High-capacity 5G traffic makes fiber connectivity essential, with backhaul representing 15-20% of site opex. Neutral-host models lower this cost by spreading fiber expenses across multiple tenants, supporting the European telecom towers market expansion. Orange’s TOTEM leverages fiber-rich footprints to attract incremental carriers [2]Orange Group, “TOTEM Fiber Strategy,” orange.com. Transport hubs in Germany and the Netherlands exemplify the synergy, demonstrating that delegated fiber provisioning accelerates small-cell rollouts and maximizes tower utilization.
EU Green Deal Incentives Accelerate Renewable Adoption
EU taxonomy rules require measurable carbon reductions, prompting TowerCos to retrofit or build renewable-powered sites. Cellnex targets net-zero emissions across 138,000 sites by 2030, guiding capital toward solar, wind, and battery systems [3]Cellnex Telecom, “2024 Results Presentation,” cellnex.com . Denmark and Finland already exceed 60% renewable penetration, setting regulatory benchmarks for the European telecom towers industry. Energy-as-a-service contracts emerge, enabling operators to convert upfront capex into predictable opex while insulating themselves from volatile electricity markets.
Carrier Network-Light Strategies Drive Sale-Leaseback Activity
Major operators unlock 15-20× EBITDA valuations by monetizing towers and leasing capacity back, freeing cash for spectrum and core upgrades. Deutsche Telekom’s exploration of options for GD Towers and Orange’s expansion of TOTEM highlight the asset-light trend. The European telecom towers market benefits as independent owners gain portfolios that produce stable, inflation-linked lease revenues.
Restraints Impact Analysis*
| Restraint | (~) % Impact on CAGR Forecast | Geographic Relevance | Impact Timeline |
|---|---|---|---|
| Slow municipal permitting cycles in heritage zones | -0.7% | Rome, Paris, Prague | Long term (≥4 years) |
| Rising energy-price volatility inflating opex | -0.5% | Germany, Netherlands, Belgium | Short term (≤2 years) |
| Anti-aggregation clauses in long-term MLAs | -0.4% | UK, Germany, France | Medium term (2-4 years) |
| Scarcity of rural power and fiber forcing costly micro-grids | -0.3% | Rural areas across Eastern Europe | Long term (≥4 years) |
| Source: Mordor Intelligence | |||
Municipal Permitting Constraints Slow Heritage-Zone Deployments
Approval cycles in protected city centers extend 18-24 months beyond standard timelines as regulators enforce strict aesthetic requirements. Brussels caps electromagnetic fields at 6 V/m, well below EU guidelines, adding complexity to 5G densification. Specialized stealth designs cost 40-60% more than standard monopoles, squeezing returns for the European telecom towers market in iconic urban areas. Streamlined Dutch planning reforms show progress, yet resident opposition still delays rooftop conversions [4]Government of the Netherlands, “Planning Law Reforms 2024,” government.nl.
Energy-Price Volatility Pressures Operating Margins
Electricity expenses can reach 85% of site opex. German industrial tariffs of EUR 0.15-0.20 per kWh in 2024 nearly doubled prior-year averages, tightening lease-rate negotiations. Limited pass-through clauses push TowerCos to install energy-management systems and renewables, though the initial capex can deter smaller players from entering the European telecom towers market.
*Our forecasts treat driver/restraint impacts as directional, not additive. The impact forecasts reflect baseline growth, mix effects, and variable interactions.
Segment Analysis
By Ownership: Independent Consolidation Accelerates
Independent TowerCos held 38.02% share of the European telecom towers market in 2025 and are forecast to record a 8.85% CAGR, underscoring the appeal of scale and neutrality. Their portfolios attract multiple tenants, raising revenue per tower by 15–20% through targeted co-location strategies. In contrast, operator-owned towers remain dominant in select Nordic markets where strategic control and spectrum coordination still matter.
Joint-venture models such as GD Towers blend carrier control with infrastructure-investor capital, while MNO captive structures persist mainly for strategic or regulatory reasons. Independent players keep expanding into Central and Eastern Europe, using build-to-suit contracts to capture first-mover advantages. Regulatory agencies increasingly advocate neutral-host solutions to enhance coverage, a stance that solidifies the growth path for independent owners within the European telecom towers market.


By Installation: Urban Densification Drives Rooftop Growth
Ground-based towers controlled 54.10% of the European telecom towers market size in 2025, reflecting decades of macro-coverage build-outs. Rooftop sites, though smaller in volume, are set to expand at a 3.76% CAGR, pushed by urban 5G densification and land scarcity.
Metropolitan authorities prefer rooftops that minimize street-level clutter and expedite small-cell deployment. Transport hubs and commercial blocks now integrate rooftop structures with distributed antenna systems to handle high traffic densities. Digital engineering tools shorten design-to-permit cycles, while standardized tenancy agreements encourage landlords to open premium rooftops to the European telecom towers market.
By Fuel Type: Renewable Transition Accelerates Despite Grid Dominance
Grid/diesel hybrids comprised 63.55% of the European telecom towers market share in 2025, yet their dominance erodes as stricter EU carbon targets loom. Renewable-powered configurations are climbing at 13.78% CAGR, supported by feed-in tariffs and green-loan facilities.
Nordic TowerCos already deploy solar-battery packs paired with wind micro-turbines in remote clusters, achieving operational savings and regulatory compliance. Energy-as-a-service providers assume capex, turning fuel spend into predictable service fees, thereby derisking the renewable transition for newcomers to the European telecom towers industry.
By Tower Type: Stealth Solutions Address Urban Constraints
Monopoles commanded 49.75% Europe telecom towers market share in 2025, favored for cost efficiency and simple siting. Stealth and concealed variants will grow at a 5.79% CAGR as heritage-zone regulations tighten across major capitals.
Lattice and guyed designs remain viable for rural reach, but cities increasingly demand camouflaged installations that blend with architecture. AI-driven siting models help TowerCos choose optimal form factors, trimming total cost of ownership by up to 20%. These innovations enable the European telecom towers market to reconcile connectivity goals with aesthetic preservation.
Geography Analysis
The rest of Europe led with a 20.20% share in 2025, powered by Central and Eastern states channeling EU structural funds into 5G and fiber. Poland, the Czech Republic, and Hungary show double-digit site additions as international TowerCos exploit greenfield prospects. Emerging investors such as Phoenix Tower International scale rapidly via build-to-suit contracts that accelerate regional parity with Western peers.
Germany remains the single largest national cluster in the European telecom towers market. Vantage Towers, operating alongside regional independents, profits from dense industrial corridors and robust fiber backbones. Regulatory clarity on site-sharing encourages co-location, improving capital efficiency and accelerating rooftop conversions in Berlin and Munich.
Nordic countries exemplify mature, tech-forward deployments. Telia Towers Finland integrates AI-based digitization for predictive maintenance, trimming outages, and opex. UK post-Brexit rules bring modest divergence on spectrum policy, but neutral-host frameworks remain aligned with continental practices. France sustains organic growth as TOTEM professionalizes Orange’s domestic inventory, and Italy’s INWIT drives nationwide densification under collaborative models with Vodafone.
Competitive Landscape
Independent TowerCos pursue pan-European scale, while national specialists defend entrenched positions. Cellnex controls around 138,000 sites across 12 countries, leveraging centralized procurement and multi-tenant pricing to boost economic returns. Vantage Towers collaborates on cross-border 5G corridors, indicating a strategic pivot toward integrated transport use cases.
Technology adoption supplies fresh differentiation. Operators deploy AI-enabled monitoring to predict component failures and schedule just-in-time maintenance, reducing downtime and field costs. Renewable power partnerships mitigate energy-price risk and align with ESG mandates, pleasing both regulators and investors in the European telecom towers industry.
Regulatory scrutiny focuses on anti-aggregation clauses that can limit competition. The European Wireless Infrastructure Association lobbies for balanced rules that encourage organic network expansion while preventing monopolistic land deals. Competitive tension, therefore, gravitates around the capability to integrate new technologies, deliver green solutions, and navigate evolving policy landscapes.
Europe Telecom Towers Industry Leaders
Cellnex Telecom
Vantage Towers
GD Towers (Deutsche Telekom)
American Tower Corporation
TOTEM (Orange Group)
- *Disclaimer: Major Players sorted in no particular order


Recent Industry Developments
- July 2025: Phoenix Tower International entered exclusive talks to acquire Infracos from Bouygues Telecom and SFR, adding 3,700 French sites.
- January 2025: Vantage Towers, TOTEM, Orange, and Telefónica collaborated on a cross-border 5G highway corridor enabling connected-vehicle services.
- October 2024: INWIT and Vantage Towers joined the European Wireless Infrastructure Association to strengthen neutral-host advocacy.
- August 2024: Telia Towers Finland partnered with Shapemaker to deploy AI-driven digitization for network automation.


Europe Telecom Towers Market Report Scope
| Operator-owned |
| Independent TowerCo |
| Joint-Venture TowerCo |
| MNO Captive |
| Rooftop |
| Ground-based |
| Renewable-powered |
| Grid/Diesel Hybrid |
| Monopole |
| Lattice |
| Guyed |
| Stealth / Concealed |
| United Kingdom |
| Germany |
| France |
| Italy |
| Spain |
| Denmark |
| Finland |
| Rest of Europe (Austria, Belgium, Bulgaria, and Others) |
| By Ownership | Operator-owned |
| Independent TowerCo | |
| Joint-Venture TowerCo | |
| MNO Captive | |
| By Installation | Rooftop |
| Ground-based | |
| By Fuel Type | Renewable-powered |
| Grid/Diesel Hybrid | |
| By Tower Type | Monopole |
| Lattice | |
| Guyed | |
| Stealth / Concealed | |
| By Country | United Kingdom |
| Germany | |
| France | |
| Italy | |
| Spain | |
| Denmark | |
| Finland | |
| Rest of Europe (Austria, Belgium, Bulgaria, and Others) |


Key Questions Answered in the Report
How large is the Europe telecom tower market in 2026?
The market is valued at USD 14.83 billion in 2026.
What growth rate is forecast for Europe’s tower segment to 2031?
A 3.12% CAGR is projected, lifting value to USD 17.29 billion.
Which ownership model is expanding fastest?
Independent TowerCos are growing at a 8.85% CAGR due to sale-leaseback activity.
Why are rooftop installations gaining traction?
Urban densification and limited ground space push carriers toward rooftop sites that ease permitting and integrate small cells efficiently.
How is the energy transition influencing tower operations?
EU Green Deal incentives are driving a 13.78% CAGR for renewable-powered sites, reducing carbon footprints and opex.
What challenges slow deployments in historic cities?
Extended permitting cycles and strict aesthetic regulations lengthen build timelines by up to two years in heritage zones.
Page last updated on:


