Agriculture Nets Market Size and Share
Market Overview
| Study Period | 2021 - 2031 |
|---|---|
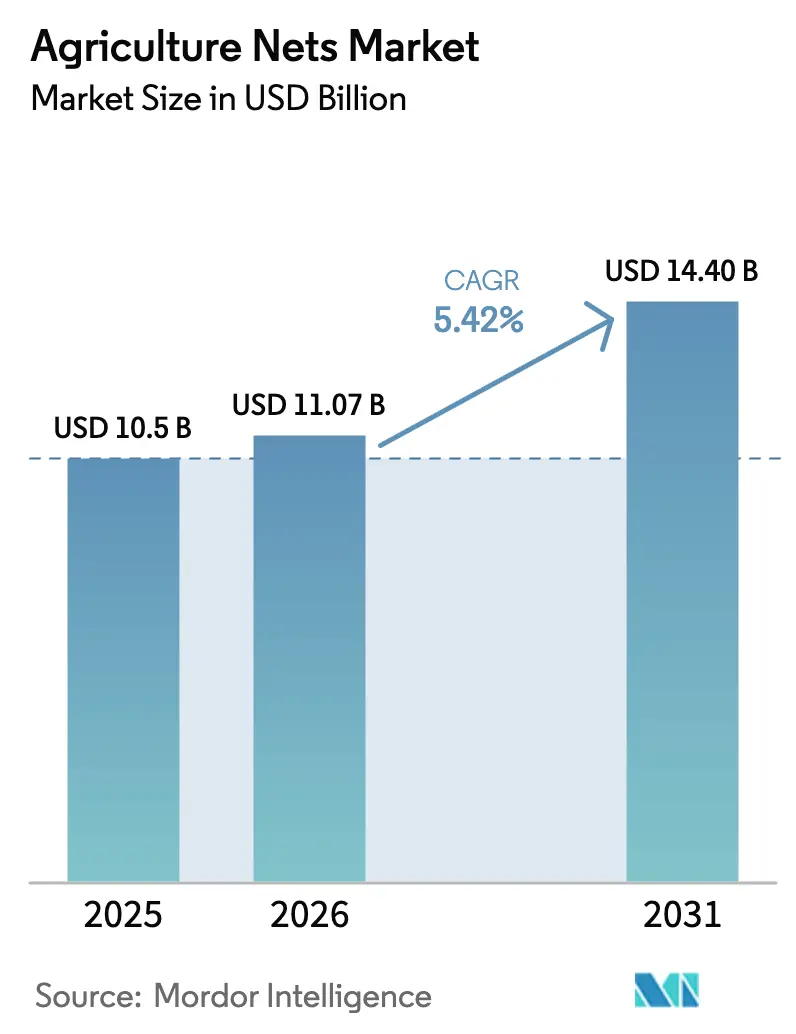
| Market Size (2026) | USD 11.07 Billion |
| Market Size (2031) | USD 14.4 Billion |
| Growth Rate (2026 - 2031) | 5.42% CAGR |
| Fastest Growing Market | Africa |
| Largest Market | Asia Pacific |
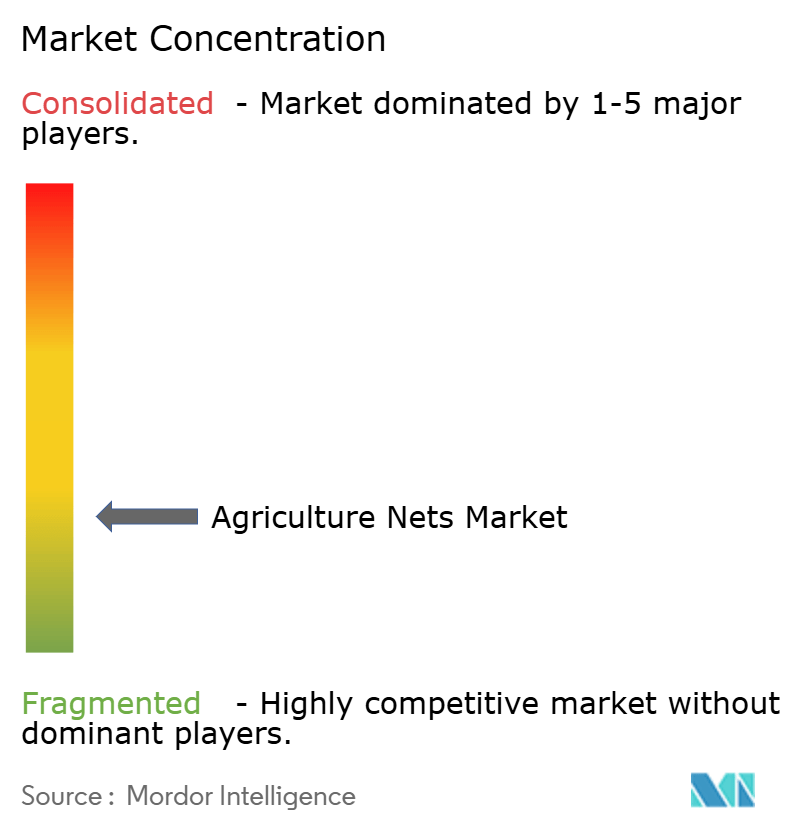
| Market Concentration | Low |
Major Players *Disclaimer: Major Players sorted in no particular order Image © Mordor Intelligence. Reuse requires attribution under CC BY 4.0. | |
Agriculture Nets Market Analysis by Mordor Intelligence
The agricultural nets market size in 2026 is estimated at USD 11.07 billion, growing from 2025 value of USD 10.5 billion with 2031 projections showing USD 14.4 billion, growing at 5.42% CAGR over 2026-2031. Robust demand stems from growers’ need to cushion crops against erratic weather, rising pest pressure, and stricter food safety rules. Tighter Maximum Residue Limits (MRLs) across major importing regions are steering producers toward physical barriers that cut pesticide use yet maintain export-grade quality[1]Source: European Commission, “EU Pesticide Maximum Residue Limits,” ec.europa.eu. The rapid proliferation of mid-size commercial greenhouses, especially in North America, Europe, and Asia-Pacific, further fuels the agricultural nets market by embedding nets into integrated climate-control systems. Meanwhile, pilot agri-photovoltaic projects prove that semi-transparent photovoltaic shade nets can deliver crop protection and renewable energy from the same footprint.
Key Report Takeaways
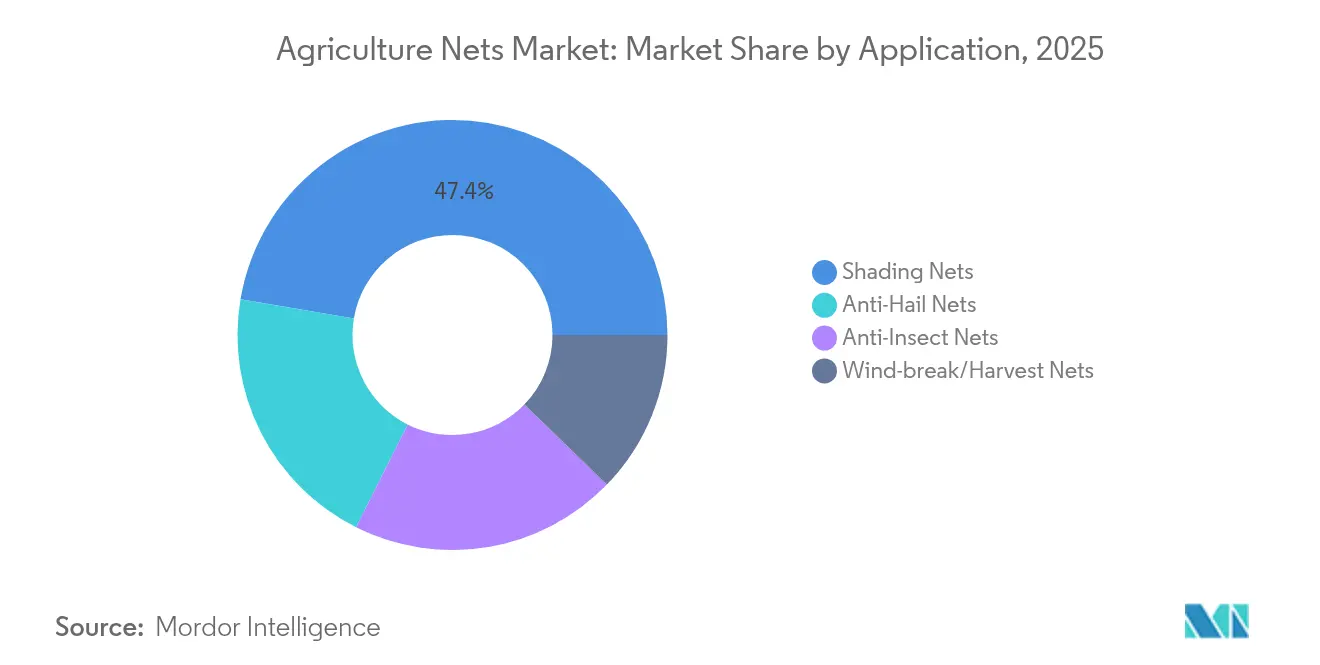
- By application, shade nets led with a 47.35% revenue share of the agricultural nets market in 2025, while anti-insect nets are advancing at an 8.45% CAGR through 2031.
- By material, HDPE monofilament accounted for 60.35% of the agricultural nets market size in 2025, and bio-based polymers are set to expand at an 11.1% CAGR between 2026 and 2031.
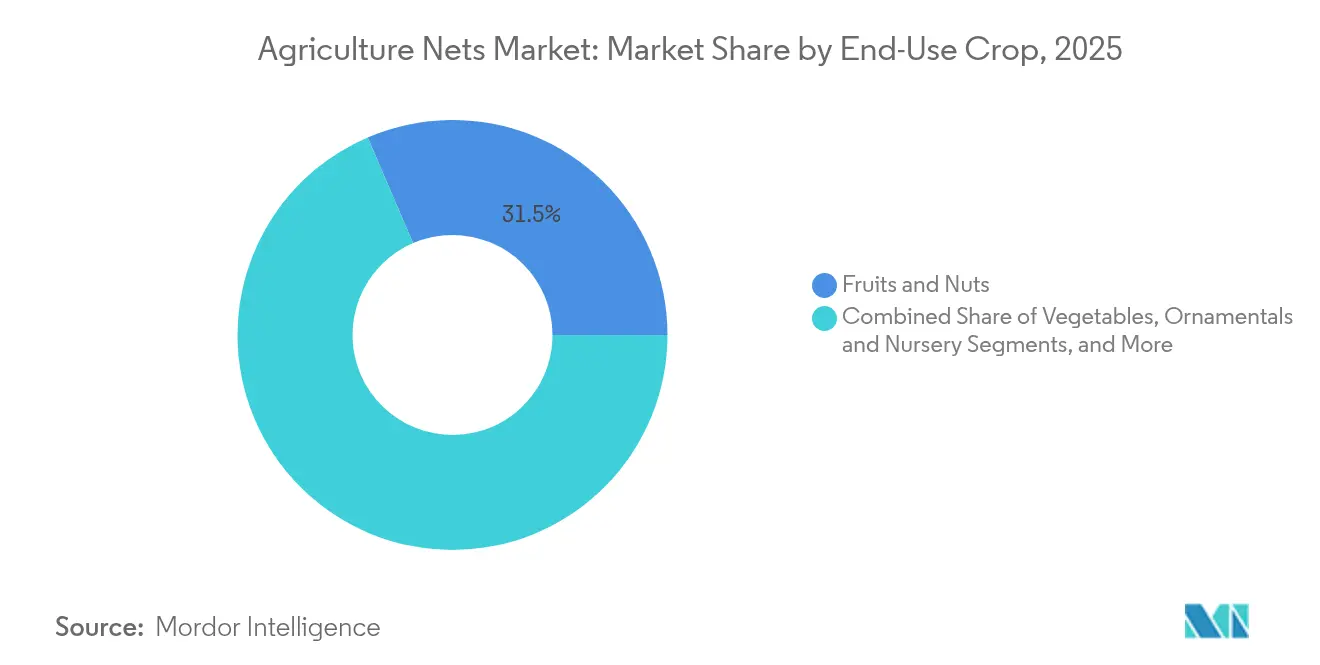
- By end-use crop, fruits and nuts commanded a 31.45% share of the agricultural nets market size in 2025 and are projected to grow at 5.86% CAGR by 2031.
- By distribution channel, agri-input dealers held 41.75% of the agricultural nets market share in 2025, while turn-key greenhouse integrators recorded the highest CAGR at 9.05% through 2031.
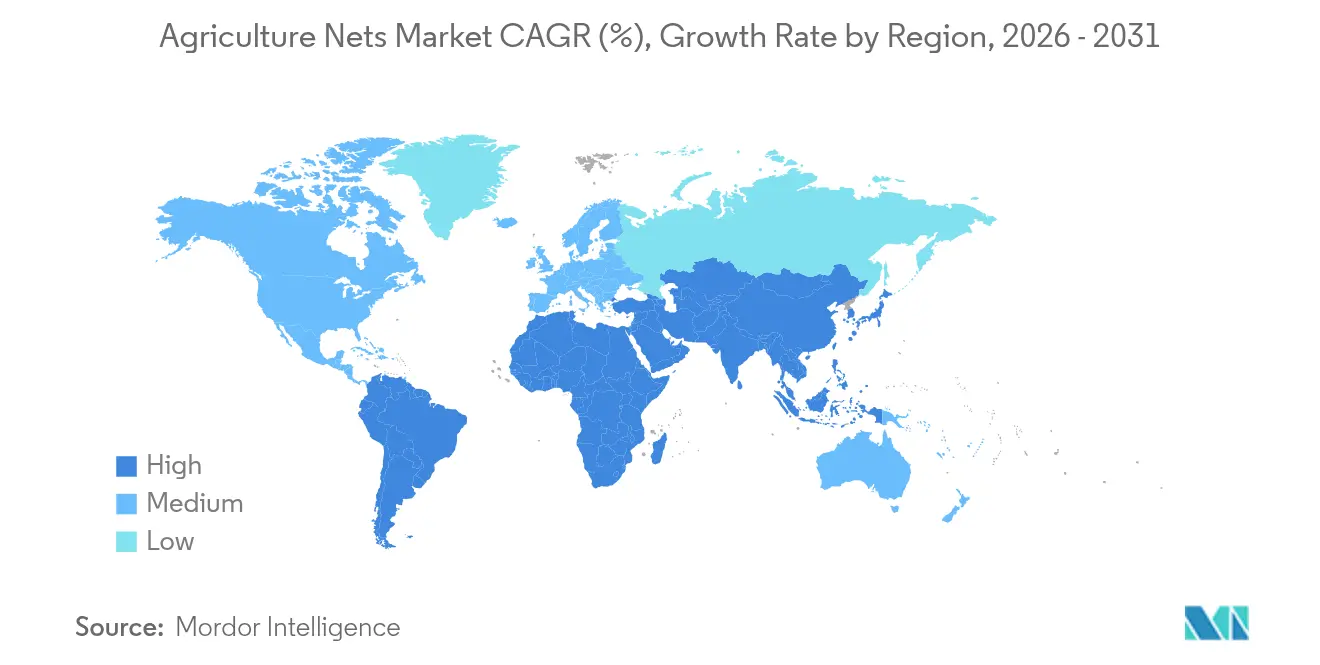
- By region, Asia-Pacific contributed 37.10% agricultural nets market share in 2025, and Africa is the fastest-growing region at 8.86% CAGR to 2031.
Note: Market size and forecast figures in this report are generated using Mordor Intelligence’s proprietary estimation framework, updated with the latest available data and insights as of 2026.
Global Agriculture Nets Market Trends and Insights
Drivers Impact Analysis*
| Driver | (~) % Impact on CAGR Forecast | Geographic Relevance | Impact Timeline |
|---|---|---|---|
| Rising Pest Pressure in Open-Field and Greenhouse Farming | +1.2% | Global, with the highest impact in Asia-Pacific and Africa | Medium term (2-4 years) |
| Expansion of Mid-Size Commercial Greenhouses | +0.9% | North America, Europe, and Asia-Pacific core markets | Long term (≥ 4 years) |
| Stricter Maximum Residue Limits Driving Non-Chemical Alternatives | +1.1% | Europe, North America, with spillover to emerging markets | Short term (≤ 2 years) |
| Government Subsidies for Protected Cultivation infrastructure | +0.8% | India, Mexico, Brazil, with selective programs in Africa | Medium term (2-4 years) |
| Climate-linked insurance premiums discounted for net-protected orchards | +0.4% | Mediterranean regions, Australia, California | Long term (≥ 4 years) |
| Adoption of photovoltaic shade-net hybrids for Agri-PV projects | +0.6% | Europe, Japan, and emerging in North America | Long term (≥ 4 years) |
| Source: Mordor Intelligence | |||
Rising Pest Pressure in Open-Field and Greenhouse Farming
Escalating temperatures and shifting rainfall patterns extend insect lifecycles and heighten infestation intensity, trimming yields in staples such as wheat by 10% and barley by 13%[2]Source: Senthold Asseng, “Climate change impact on global crop yields,” pnas.org. Trials in Tanzania show marketable cucumber yields jumping to 70.9-96.9 metric tons/hectare under net houses versus open plots. These results validate physical exclusion as a cost-effective pillar of integrated pest management. Ongoing pesticide resistance issues reinforce the shift, nudging investment toward long-life nets that provide both pest and mild-climate moderation.
Expansion of Mid-Size Commercial Greenhouses
In Spain, Morocco, and coastal China, mid-scale facilities marry advanced climate control with flexible crop rotations. Each greenhouse typically specifies multiple net types for shade to lower radiation, insect to bar entry, and windbreak to guard structures, creating recurrent orders across construction booms. As more growers target year-round supply contracts, the agricultural nets market finds durable, installation-linked volumes that outlast one-time capex cycles.
Stricter Maximum Residue Limits Driving Non-Chemical Alternatives
The EU’s harmonized MRL framework now spans 315 fresh commodities and roughly 1,100 actives. New Zealand added a refreshed Food Notice in 2025 that tightens thresholds for several fungicides[3]Source: LIFE VINOSHIELD Project Summary, ec.europa.eu. Export-oriented growers thus chase tactics that lower spray frequency by 25-50%, and colored nets that exploit insect vision are gaining ground after field trials on onion thrips cut damage with minimal chemistry. Compliance urgency feeds the agricultural nets market because nets offer an immediately deployable path toward residue-safe harvests without re-registering actives or investing in novel biopesticides.
Government Subsidies for Protected Cultivation Infrastructure
India’s National Horticulture Board reimburses up to 50% of net-house costs, while Telangana state tops that at 75-95% for disadvantaged farmer groups. Mexico channels grants through FIRA and state programs to spur the export of vegetables under the mesh. These incentives collapse payback periods for small and mid-scale investors, fostering local demonstration effects that ripple through neighboring districts. As subsidy-backed projects mature and profits surface, follow-on self-financed expansion raises baseline demand for replacement nets every 3-5 years, anchoring revenue visibility for suppliers.
Restraints Impact Analysis*
| Restraint | (~) % Impact on CAGR Forecast | Geographic Relevance | Impact Timeline |
|---|---|---|---|
| High upfront Capital Expenditure versus short pay-back for smallholders | -1.3% | Sub-Saharan Africa, South Asia smallholder zones | Short term (≤ 2 years) |
| Limited efficacy on broad-acre field crops | -0.8% | North America, Australia, Argentina grain belts | Medium term (2-4 years) |
| Disposal and recycling challenges for UV-stabilised HDPE nets | -0.6% | Europe, other eco-strict markets | Long term (≥ 4 years) |
| Competing low-cost Chinese imports | -0.9% | Global, highest in price-sensitive emerging markets | Short term (≤ 2 years) |
| Source: Mordor Intelligence | |||
High Upfront Capital Expenditure Versus Short pay-back for Smallholders
Basic 100 m² poly houses in USD 750 and still outstrip many smallholders’ liquidity, even after rebates. Access to credit remains thin, so projects stall despite persuasive agronomic benefits. Similar barriers appear in Kenya and Peru, where microfinance covers inputs but seldom larger structures. The agricultural nets market, therefore, skews toward commercial farms, leaving a latent pool of subsistence growers underserved until financing models or pay-per-use services evolve.
Limited Efficacy on broad-acre Field Crops
Per-hectare net costs spike when stretched over commodity grains, and wind load engineering multiplies capital needs on vast plains. Even though climate shifts have already shaved 4-13% off global maize, wheat, and barley yields, margins in those crops rarely justify netting. Adoption thus clusters around high-value horticulture, capping penetration across the bulk of arable acreage.
*Our forecasts treat driver/restraint impacts as directional, not additive. The impact forecasts reflect baseline growth, mix effects, and variable interactions.
Segment Analysis
By Application: Shade Nets Anchor Multi-Purpose Protection
Shade nets held 47.35% of the agriculture nets market share in 2025, underscoring their broad utility in moderating light stress and heat burden. Research confirms that 30-50% shading keeps photosynthetically active radiation within ideal bands while lowering canopy temperatures by 2-5 °C. Anti-insect nets are projected to climb by 2031, translating to an 8.45% CAGR as residue regulations toughen.
Anti-hail and windbreak variants find firm niches in orchards and vineyards prone to convective storms. Advanced combinations such as red or pearl-colored meshes alter light spectra to disrupt pest orientation, allowing farmers to cut insecticide sprays by roughly 30% without yield penalties. This pipeline of multifunctional offerings differentiates premium suppliers, shielding them from low-price commodity pressure.


By Material: HDPE Dominance Meets Bio-Based Acceleration
HDPE monofilament generated good sales in 2025, aided by reliable tensile strength and the ready availability of UV stabilizers. It accounts for 60.35% of the agricultural nets market size but faces scrutiny over microplastic shedding. The agricultural nets market observes bio-based polymers rising 11.1% per year as PLA-PBAT blends approach parity on field life and tear resistance.
Material developers now graft hydrophobic coatings onto PLA yarns, boosting contact angles above 140° to repel moisture and fungal spores. Resin diversification offers manufacturers a hedge against forthcoming plastic tax regimes.
By End-Use Crop: Fruits and Nuts Lead Premium Payback
By end-use crop, fruits and nuts commanded a 31.45% share of the agricultural nets market size in 2025 and are projected to grow at a 5.86% CAGR by 2031. Vegetables remain the volume engine, spinach, lettuce, and tomato producers bought USD 4.83 billion of nets in 2025, using them for exclusion, trellising, and harvesting.For broad-acre cereals, adoption stays marginal, but pilot trials in Israel show wheat yields increasing 12% under light-diffusing mesh, signaling a niche growth pocket if material costs fall.
By Distribution Channel: Turn-Key Integrators Gain Momentum
Agri-input dealers still supplied 41.75% of 2025 shipments as farmers replaced worn nets via familiar retail networks. Yet turn-key greenhouse integrators posted 9.05% CAGR and are poised to surpass wholesalers for large projects. The agricultural nets market size for integrator-led packages is growing at a high pace in 2025 and benefits from projects such as a 60-hectare tomato complex in Virginia that will embed high-albedo shade nets throughout.
Integrators bundle design, steel, climate control, and IoT sensors with nets, ensuring compatibility and single-point warranties. Direct-to-grower e-commerce channels nibble at smaller farm orders through webshops offering custom cut lengths and next-day delivery, but their growth is capped by the complexity of specifying net porosity, grammage, and UV rating without expert guidance.
Geography Analysis
Asia-Pacific maintained a 37.10% agricultural nets market share in 2025, underpinned by China’s economies of scale and India’s subsidy-driven protected-cultivation boom. Government schemes reimburse up to 95% of net-house spend for tribal farmers in Telangana, fast-tracking Adoption across hot plains where open-field losses reach 30%. Southeast Asian countries, led by Vietnam and Thailand, invest in shade nets to stabilize durian and dragon-fruit yields as heatwaves intensify. Japan experiments with photovoltaic mesh in grape prefectures, hoping to double land-use efficiency while meeting renewable targets.
Africa is the fastest-growing region, with a 8.86% CAGR by 2031. Ethiopia channels public-private funds into coffee under-canopy shading that pairs pest exclusion with moisture retention. Kenya’s floriculture exports embrace insect mesh to safeguard zero-tolerance European Union thresholds, leveraging mobile apps for remote microclimate alerts. Field research in Tanzania recorded cucumber yields above 90 tons/ha in netted tunnels versus 20 tons/ha outdoors. North America and Europe represent mature but innovation-rich clusters. The LIFE VINOSHIELD project will shield 16,500 ha of Mediterranean vineyards with multifunctional nets that also temper excessive solar load. Canada’s berry belt integrates fine-mesh exclusion to combat spotted wing drosophila, cutting cull rates by 65%. Meanwhile, Middle Eastern growers deploy reflective shade to save irrigation water in desert lettuce systems.

Competitive Landscape
Competition is fragmented, the ten largest manufacturers together control under 50% of global sales. Garware Technical Fibres, a key listed player, grew its profit by 17% in 2025 and is scouting a USD 20 million European acquisition to localize supply and shorten lead times. Europe’s Tenax and Israel’s Polysack emphasize colored and photo-selective technology to escape commodity pricing. Chinese firms such as Shandong Binzhou Hongtong export black shade rolls at 15-20% below regional averages, pressuring margins for mid-tier brands.
Product differentiation pivots on multi-functionality. Garware’s patented V5 net lifts tomato yield by 15% by balancing light diffusion and ventilation, while its V2 copper-impregnated fishing mesh underscores cross-segment R&D leverage. Start-ups focus on biodegradable yarns, and the Italian consortium Novamont teamed with universities to field-test PLA nets that decompose within two years in soil without residue. Integrator alliances deepen, and Dutch group KUBO specifies proprietary netting within its high-tech Ultra-Clima houses to guarantee uniform microclimates.
Smart agriculture overlays emerge as the next battleground. Israeli company Sensilize embeds optical fibers into anti-hail canopies to transmit real-time PAR data, while Spanish researchers pair RFID tags with harvest nets to monitor tension fatigue. Suppliers are able to integrate sensors, data dashboards, and maintenance alerts to secure recurring service revenue, partially shielding them from raw material swings. Yet price rivalry remains pronounced in standard HDPE rolls, keeping overall market concentration low.
Agriculture Nets Industry Leaders
Garware Technical Fibres Limited
Arrigoni S.p.A
Gintec Shade Technologies
Joyeyou (Shanghai Hongdu Industry Co., Ltd.)
Ginegar Plastics Products Ltd. (Ginegar Group)
- *Disclaimer: Major Players sorted in no particular order

Recent Industry Developments
- June 2025: The EU launched LIFE VINOSHIELD with a EUR 4.1 million budget to deploy multifunctional textile nets across 16,500 ha of vineyards.
- May 2025: Deere & Company acquired drone specialist Sentera to enhance aerial crop-scouting, supporting digital monitoring of net-covered orchards.
- May 2025: GrainFox merged with AgResource to combine predictive analytics with market intel for diversified growers.
- December 2024: Intelligent Growth Solutions and Empire State Greenhouses announced a 385,000 ft² carbon-negative vertical farm in New York featuring 100 stackable towers.


Research Methodology Framework and Report Scope
Market Definitions and Key Coverage
Our study defines the agriculture nets market as the worldwide manufacturer-level revenue generated from purpose-built polymer mesh, chiefly UV-stabilized HDPE, LDPE, and polypropylene, that growers install above, around, or beneath crops to provide shade, repel insects, break hail, and support climbing plants. Nets for greenhouses, open-field orchards, vineyards, and nursery cultivation are fully included. Values are expressed in USD at factory gate.
Scope exclusion: Scaffold safety netting and household insect screens are outside this study.
Segmentation Overview
- By Application
- Shading Nets
- Anti-Hail Nets
- Anti-Insect Nets
- Wind-break/Harvest Nets
- By Material
- HDPE (Monofilament)
- LDPE/LLDPE
- Polypropylene
- Bio-based/Compostable Polymers
- By End-use Crop
- Fruits and Nuts
- Vegetables
- Ornamentals and Nursery
- Field Crops and Cereals
- By Distribution Channel
- Direct to Grower
- Agri-input Dealers
- Turn-key Greenhouse Integrators
- By Geography
- North America
- United States
- Canada
- Mexico
- Rest of North America
- Europe
- Germany
- United Kingdom
- France
- Spain
- Russia
- Rest of Europe
- Asia-Pacific
- China
- India
- Japan
- Australia
- Rest of Asia-Pacific
- South America
- Brazil
- Argentina
- Rest of South America
- Middle East
- Saudi Arabia
- Rest of Middle East
- Africa
- South Africa
- Rest of Africa
- North America
Detailed Research Methodology and Data Validation
Primary Research
Mordor analysts held interviews with agri-input dealers in India, Spain, Kenya, and Mexico, plus horticulture consultants and greenhouse procurement heads. These talks verified typical selling prices, replacement cycles, and the likelihood of subsidy programs, giving us live checks on secondary findings.
Desk Research
We opened with hard data from FAO, Eurostat, USDA-NASS, and the China Ministry of Agriculture that quantify greenhouse floor space and fruit acreage; these volumes anchor the demand pool. UN Comtrade and Volza import-export codes let us cross-check regional supply gaps, while peer-reviewed papers in Agricultural Water Management helped relate shading ratios to yield gains. Company filings, investor presentations, and D&B Hoovers snapshots clarified net-specific revenue shares for listed makers, and International Greenhouse Association briefs traced UV-additive price swings. The sources named here are illustrative only; many further open databases and press releases informed our desk analysis.
Market-Sizing & Forecasting
A top-down model converts protected-cultivation area into required net surface, multiplies by validated installation ratios, then applies region-specific average selling prices gathered in primary work. Select bottom-up roll-ups of manufacturers' reported net sales corroborate the totals. Key variables include greenhouse stock, expansion of fruit orchards in warm climates, polymer resin prices, subsidy intensity, and extreme-weather incidence. Five-year forecasts use multivariate regression blended with scenario analysis to reflect climate policy shifts. Any missing supplier datapoints are back-filled with channel-check averages.
Data Validation & Update Cycle
Outputs undergo a two-analyst variance review against import volumes and quarterly earnings indicators before senior sign-off. We refresh every twelve months, or sooner if resin costs move beyond fifteen percent or new subsidy schemes emerge, so clients receive a current view.
Why Mordor's Agriculture Nets Baseline Stands Reliable
Published estimates often differ because firms mix construction mesh with farm nets, pick different base years, or apply flat price escalators that ignore volatile polymer costs.
Key gap drivers we observe are scope creep beyond agriculture, single-source ASP assumptions, and refresh cycles longer than a year that miss rapid subsidy changes.
Benchmark comparison
| Market Size | Anonymized source | Primary gap driver |
|---|---|---|
| USD 10.5 B (2025) | Mordor Intelligence | - |
| USD 9.85 B (2024) | Global Consultancy A | Excludes anti-hail nets; single regional ASP |
| USD 11.82 B (2024) | Industry Association B | Includes household insect screens |
| USD 9.29 B (2025) | Market Insights C | Uses constant resin price from 2021 survey |
These contrasts show how our disciplined scope, live price checks, and annual refresh combine to deliver a balanced, transparent baseline that users can trace to clear variables and repeatable steps.


Key Questions Answered in the Report
What is the current and forecast market size of the agricultural nets market?
The agricultural nets market size stands at USD 11.07 billion in 2026 and is forecast to rise to USD 14.4 billion by 2031.
Which application segment dominates the agricultural nets market?
Shade nets lead with 47.35% revenue share in 2025 due to their broad use in light and heat management across diverse crops.
Why are anti-insect nets growing faster than other segments?
An 8.45% CAGR through 2031 is driven by stricter residue limits and integrated pest management, prompting growers to swap chemicals for physical exclusion.
How do bio-based materials influence the agricultural nets industry outlook?
Bio-based polymers are expanding 11.1% annually as European Union circular-economy policies reward compostable nets and buyers seek low-plastic-footprint solutions.
Which region is projected to post the highest growth?
Africa is projected to grow at 8.86% CAGR due to vertical farming investments and infrastructure programs in Nigeria, Ethiopia, and Kenya.
What keeps market concentration low?
Aggressive low-cost Chinese exports and varied local requirements fragment share, so the top five producers together hold below 50% of global revenue.
Page last updated on:


