
Market Overview
| Study Period | 2021 - 2031 |
|---|---|
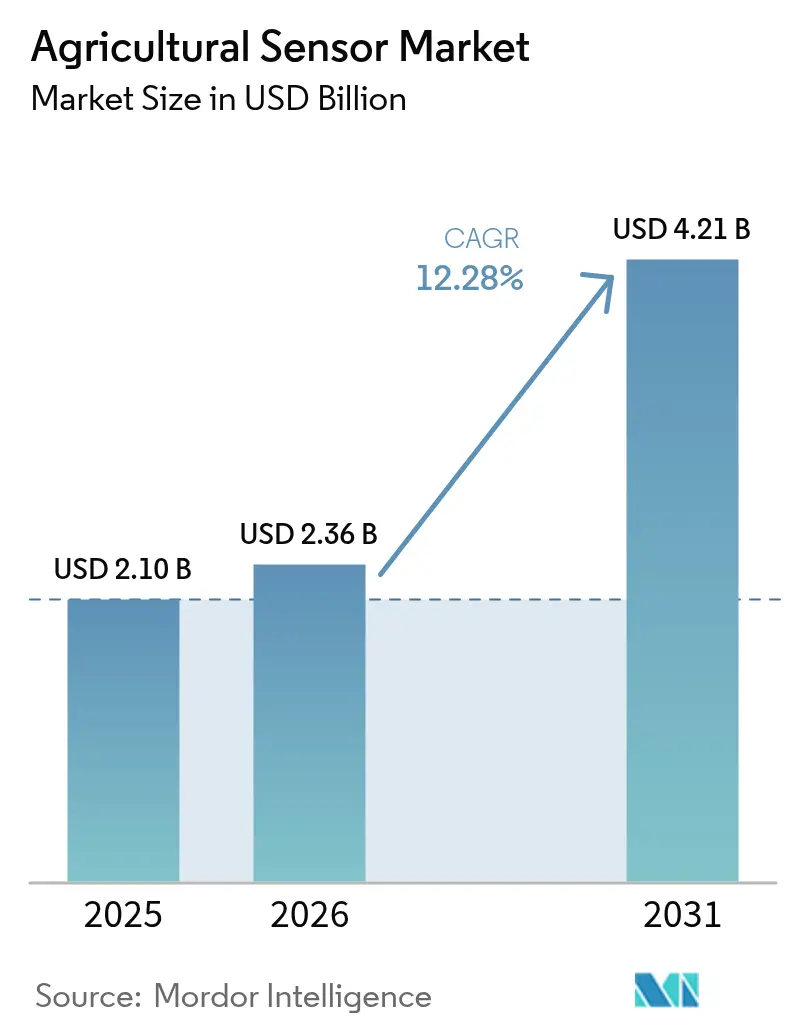
| Market Size (2026) | USD 2.36 Billion |
| Market Size (2031) | USD 4.21 Billion |
| Growth Rate (2026 - 2031) | 12.28 % |
| Fastest Growing Market | Asia Pacific |
| Largest Market | North America |
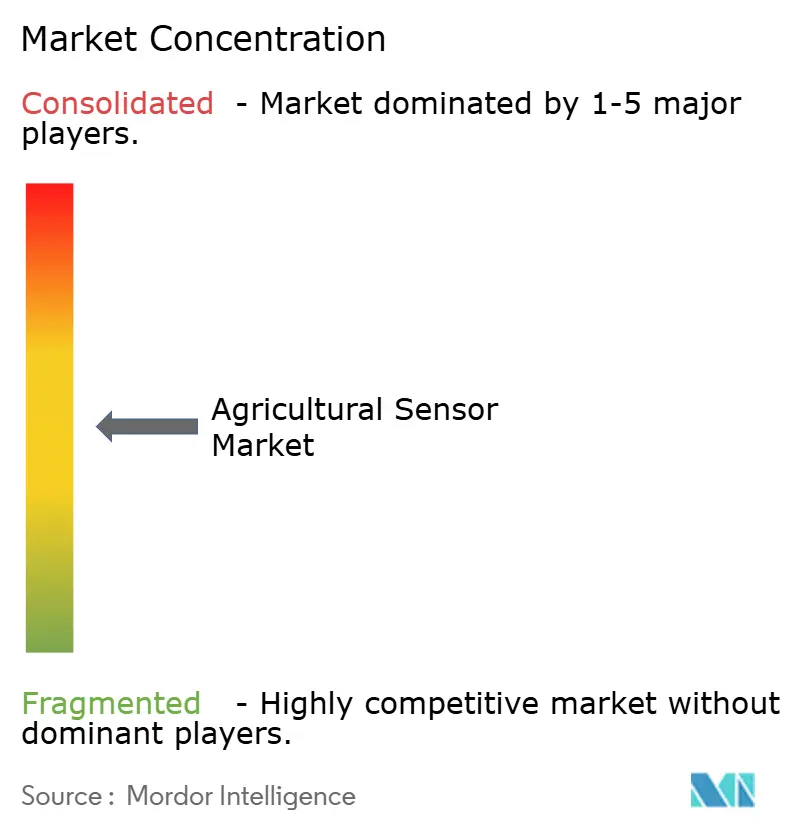
| Market Concentration | Medium |
Major Players *Disclaimer: Major Players sorted in no particular order Image © Mordor Intelligence. Reuse requires attribution under CC BY 4.0. | |
Agricultural Sensor Market Analysis by Mordor Intelligence
Agricultural sensor market size in 2026 is estimated at USD 2.36 billion, growing from 2025 value of USD 2.1 billion with 2031 projections showing USD 4.21 billion, growing at 12.3% CAGR over 2026-2031. The market growth is driven by climate variability, government digitization initiatives, and increasing adoption of data-driven farming practices. As farmers move away from traditional methods, sensor technologies have become essential components of modern agriculture. Government research funding continues to support the development and implementation of these technologies in food production.[1]Source: USDA National Institute of Food and Agriculture, “Agriculture and Food Research Initiative,” nifa.usda.gov Water conservation needs have increased the adoption of soil-moisture sensors for irrigation optimization and waste reduction. In the livestock sector, AI-enabled biosensors are becoming popular among dairy farmers for automated health monitoring and reproductive management, improving herd productivity while reducing manual labor requirements. Industry participants are expanding beyond sensor hardware by integrating analytics and automation capabilities. This integration demonstrates the increasing importance of software-based insights and service-oriented business models. Agricultural sensors are becoming fundamental components in developing sustainable, efficient, and resilient agricultural systems.
Key Report Takeaways
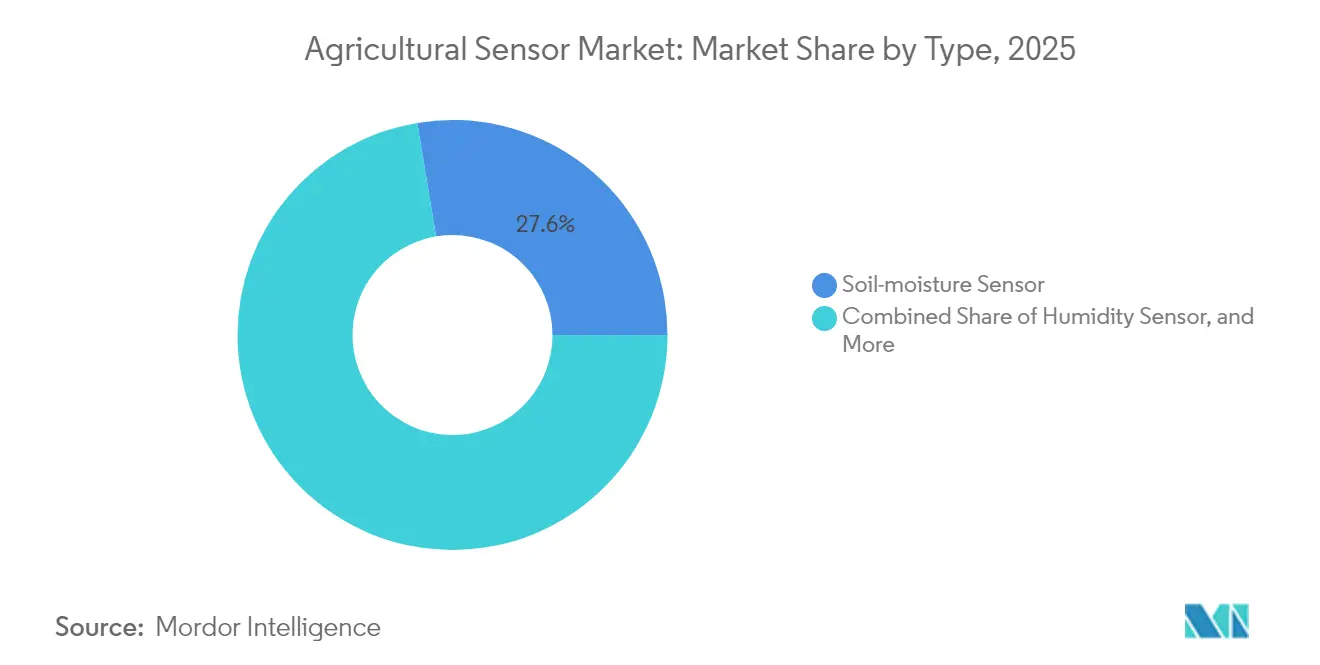
- By type, soil-moisture sensors captured 27.62% of the agricultural sensor market share in 2025, while livestock biosensors recorded the fastest 9.35% CAGR through 2031.
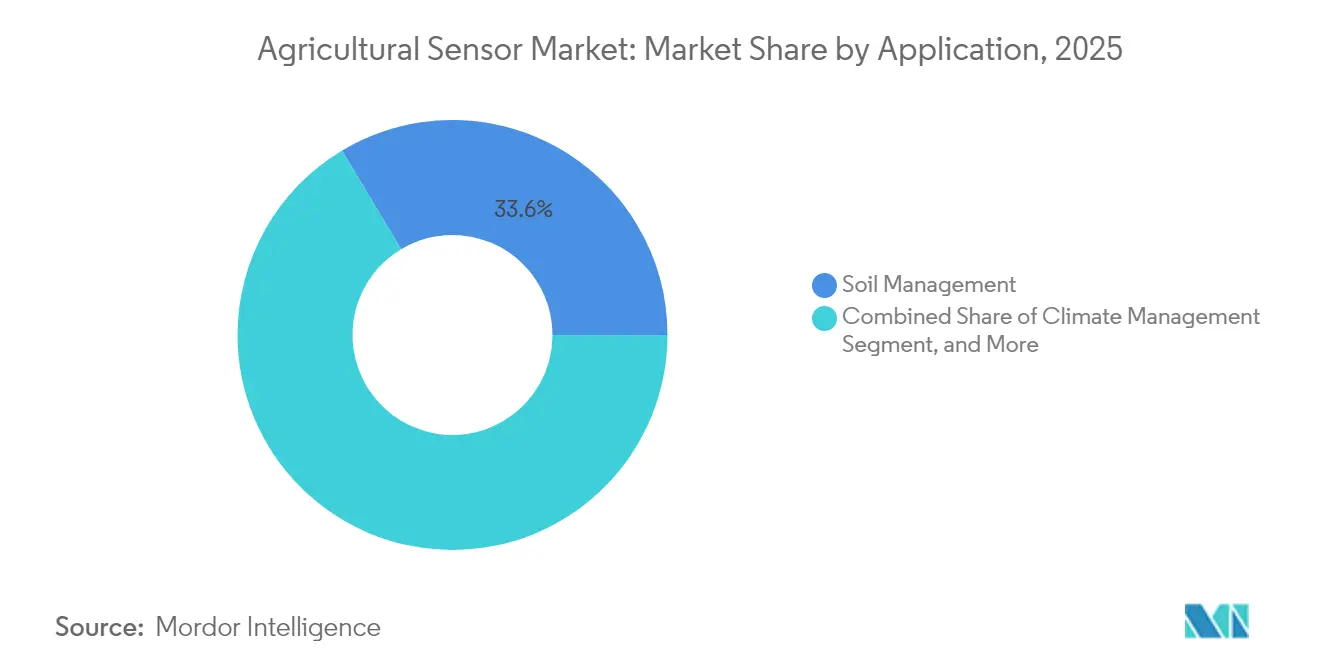
- By application, soil management accounted for 33.58% of the agricultural sensor market size in 2025, and climate management is expanding at an 8.18% CAGR to 2031.
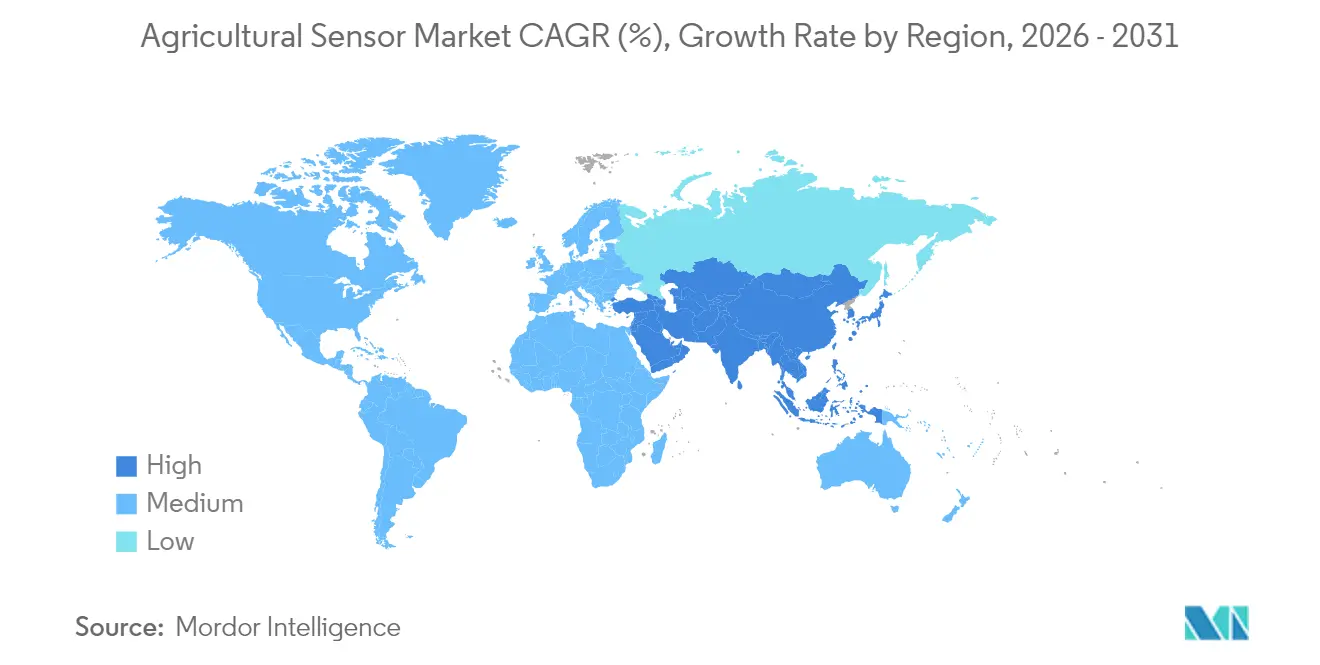
- By geography, North America held a 30.55% share of the agricultural sensor market in 2025, and Asia-Pacific is rising at a 7.44% CAGR through 2031.
Note: Market size and forecast figures in this report are generated using Mordor Intelligence’s proprietary estimation framework, updated with the latest available data and insights as of 2026.
Market Trends and Insights
Drivers Impact Analysis of Agricultural Sensor Market*
| Driver | (~) % Impact on CAGR Forecast | Geographic Relevance | Impact Timeline |
|---|---|---|---|
| Subsidies for Precision-agriculture Equipment | +2.1% | North America, Europe, and extending to Asia-Pacific | Medium term (2–4 years) |
| Rising Demand for Real-time Crop Monitoring | +1.8% | Global; highest in developed markets | Short term (≤ 2 years) |
| Growing Adoption of IoT in Agriculture | +1.5% | Core in Asia-Pacific; spill-over to Middle East and Africa | Medium term (2–4 years) |
| Climate Change Driving Micro-environment Data Needs | +1.3% | Global; acute in drought-prone regions | Long term (≥ 4 years) |
| Sensor-as-a-service Financing Bundles | +0.9% | North America, Europe, and emerging in Asia-Pacific | Short term (≤ 2 years) |
| Agri-drones as Flying Sensor Platforms | +0.7% | Global; regulation dependent | Medium term (2–4 years) |
| Source: Mordor Intelligence | |||
Subsidies for Precision-agriculture Equipment
Government-backed cost-share programs are improving access to precision-agriculture tools by reducing financial barriers. These initiatives provide direct support to farmers, making advanced sensor technologies more affordable and increasing adoption across regions. Long-term policy commitments from major agricultural economies ensure consistent demand and predictable order volumes for vendors. Government subsidies for equipment purchases reduce payback periods and encourage investment in modern farming infrastructure.[2]Source: USDA Natural Resources Conservation Service, “Environmental Quality Incentives Program,” nrcs.usda.gov This support enables manufacturers to expand production and advance innovation. As small-scale farmers gain access to digital tools, farming practices become more efficient and sustainable. These programs provide stability for growth in the agricultural technology sector, supporting the transition from conventional methods to data-driven decision-making.
Rising Demand for Real-time Crop Monitoring
The transition from reactive to predictive farming is increasing demand for real-time crop monitoring technologies. Environmental regulations require growers to maintain detailed records, driving adoption of sensors that automate data collection and compliance reporting.[3]Source: FDA, “FSMA Produce Safety Rule,” fda.gov Climate volatility makes traditional forecasting methods less reliable. Local sensor data enables farmers to optimize irrigation, spraying, and harvesting decisions, improving yield consistency and resource efficiency. These tools help manage risks from unpredictable weather and changing soil conditions. As producers work to stabilize output and reduce waste, real-time monitoring becomes crucial for maintaining profitability and meeting quality standards. The integration of these technologies into farm operations advances smart, resilient agriculture.
Growing Adoption of IoT in Agriculture
Interconnected devices are transforming agriculture by converting isolated data points into actionable intelligence. Sensors communicate across networks to provide comprehensive monitoring of field conditions, equipment status, and crop health. Improved wireless technology has enhanced rural connectivity, enabling real-time control of irrigation systems and autonomous machinery. Edge-computing capabilities allow sensors to process data locally, reducing cloud infrastructure dependence and response times. This development supports precision farming practices that respond immediately to environmental changes. As farms become digitally integrated, IoT-enabled systems provide increased productivity and operational flexibility. The movement toward intelligent automation is changing how farmers manage inputs, monitor performance, and make strategic decisions.
Climate Change Driving Micro-environment Data Needs
Weather unpredictability increases the need for detailed, field-level data in agriculture. Regional forecasts often miss microclimate variations within individual farm blocks, where temperature and humidity fluctuate significantly. Dense sensor networks detect these subtle changes and guide timely interventions. Industrial sensors often struggle in agricultural conditions, necessitating specialized calibration protocols. Farmers increasingly rely on accurate, localized measurements to protect yields and optimize inputs as climate risks increase. Carbon credit programs encourage the use of in-soil sensors to verify organic matter accumulation. These developments demonstrate the importance of reliable, high-performance sensing technologies in climate adaptation and sustainable farming.
Restraints Impact Analysis of Agricultural Sensor Market*
| Restraint | (~) % Impact on CAGR Forecast | Geographic Relevance | Impact Timeline |
|---|---|---|---|
| High Upfront Cost for Smallholders | -1.4% | Global; most acute in developing markets | Short term (≤ 2 years) |
| Limited Rural Connectivity | -1.1% | Asia-Pacific, Middle East and Africa, and pockets of North America | Medium term (2–4 years) |
| Farm-data Privacy Concerns | -0.8% | Europe, North America, and emerging in Asia-Pacific | Long term (≥ 4 years) |
| Fragmented Aftermarket Support | -0.6% | Global; concentrated in emerging markets | Medium term (2–4 years) |
| Source: Mordor Intelligence | |||
High Upfront Cost for Smallholders
High initial costs remain a significant obstacle for small-scale farmers adopting precision agriculture. Sensor systems require substantial investment, often representing a large portion of annual farm income. Limited credit access and unclear return-on-investment periods make it difficult for smallholders to justify the expense. The absence of standardized performance and payback benchmarks slows decision-making. This hesitation impacts vendors who depend on volume sales to scale operations and reduce costs. Small farms lag behind larger operations in adoption, increasing the technology gap. Solutions through financing, leasing, or cooperative purchasing could expand access and market growth. Cost remains a primary constraint on widespread sensor technology deployment in agriculture.
Limited Rural Connectivity
Connectivity issues continue to limit agricultural digitization, particularly in remote areas. Many rural regions lack reliable broadband infrastructure, preventing real-time sensor communication. Satellite services provide alternative solutions but are expensive and face latency issues that affect time-sensitive operations. Agricultural zones often receive lower priority than residential areas in national infrastructure programs. This connectivity gap restricts access to cloud analytics, remote monitoring, and automated control systems. Farmers struggle to implement advanced technologies without consistent connectivity. Addressing this infrastructure gap is necessary for expanding precision agriculture and ensuring all producers can access modern farming tools.
*Our forecasts treat driver/restraint impacts as directional, not additive. The impact forecasts reflect baseline growth, mix effects, and variable interactions.
Agricultural Sensor Market Segment Analysis
By Type:
Soil-Moisture Sensors Lead Water-Stressed AgricultureSoil-moisture sensors maintained a 27.62% of the agricultural sensor market size in 2025, demonstrating their importance in precision irrigation systems. These sensors enable farmers to monitor soil moisture levels in real time, optimize water usage, and comply with regulatory requirements. Their adoption continues to grow as farmers seek to minimize water consumption while maintaining optimal crop yields, particularly in regions experiencing water scarcity.
Livestock biosensors are experiencing the highest growth rate at 9.35% CAGR through 2031, driven by increased adoption of automated herd management systems. These sensors monitor animal vital signs, reproductive cycles, and health parameters, enabling dairy operators to enhance productivity and reduce manual labor requirements. The market also includes optical and electrochemical sensors for greenhouse monitoring, along with mechanical, airflow, and pressure sensors for equipment and irrigation system maintenance. This diverse sensor portfolio provides vendors with multiple revenue streams independent of seasonal agricultural cycles.



By Application:
Climate Management Surges Amid Weather VolatilitySoil management represented 33.58% of the agricultural sensors market share in 2025, highlighting their fundamental importance in maintaining soil quality, nutrient levels, and preventing erosion. These sensors provide farmers with data-driven insights for fertilization and land management decisions, supporting both agricultural productivity and environmental conservation. The universal need for soil management across different agricultural sectors ensures steady demand for these sensor technologies.
Climate management applications are growing at an 8.18% CAGR through 2031, as farmers respond to increasing weather unpredictability. Sensor networks provide localized weather forecasts and real-time environmental data, enabling farmers to adapt their operations to changing conditions. The market expansion includes dairy monitoring and water management systems, while smart greenhouse operations and crop surveillance combine aerial and ground-based sensor data for early threat detection. Integration with analytics platforms converts sensor data into practical recommendations, emphasizing the growing importance of software solutions in agricultural operations.
Geography Analysis
North America Agricultural Sensor Market
North America retained 30.55% agricultural sensor market share in 2025, supported by mature precision-agriculture infrastructure and strong government incentives. Public programs continue to drive replacement and expansion cycles, making sensor adoption more accessible for producers. Canada's innovation initiatives reinforce regional momentum, while Mexico's focus on export-oriented horticulture increases demand for traceability tools. The region benefits from established supply chains and widespread adoption of digital farming practices. With regulatory compliance and sustainability goals rising, North American farms increasingly use sensor technologies to optimize inputs, monitor environmental conditions, and maintain competitiveness in global markets.
APAC Agricultural Sensor Market
Asia-Pacific demonstrates the fastest 7.44% CAGR through 2031, driven by large smallholder populations and mechanization efforts. India's digital agriculture initiatives expand sensor access in underserved districts, while China integrates sensors into autonomous machinery and livestock systems. Japan's greenhouse installations support premium pricing strategies, and Australia's water accounting practices use sensor data to manage arid-zone farming. The region's diverse farming practices and climate conditions create opportunities for specialized sensor applications. As infrastructure improves, the Asia-Pacific region becomes a primary growth driver for agricultural sensor deployment.
EMEA and South America Agricultural Sensor Market
Europe's growth remains steady, driven by environmental monitoring requirements linked to subsidy eligibility. Precision technologies are integral to farm operations, with Germany focusing on livestock sensors, France specializing in vineyard monitoring, and the Netherlands providing greenhouse expertise globally. South America emphasizes large-scale grain production, particularly in Brazil and Argentina, where sensors enhance yield optimization and resource management. In the Middle East and Africa, demand focuses on water efficiency and export compliance, despite connectivity limitations. Rural network expansion and low-power protocols remain crucial for sensor adoption in these emerging markets.

Regulatory Landscape
Policy and standards activity increasingly shapes how agricultural sensors are designed, connected, and used in compliance workflows. In March 2026, China Ministry of Agriculture and Rural Affairs (MARA) issued guidelines to establish a smart agriculture standards system covering sensors, IoT devices, and AI technologies, pushing vendors toward clearer technical specifications and interoperability in large-scale deployments.
In Europe, Regulation (EU) 2026/1123 (adopted May 2026) requires digital labels for plant protection products, linking regulated chemical-use instructions to precision-application systems that depend on sensor and machine data. The EU AI Act (Regulation (EU) 2024/1689) introduces phased obligations, including transparency and high-risk AI system requirements from August 2026, raising the need for robustness, cybersecurity, and conformity-assessment readiness for sensor-enabled AI functions embedded in agricultural machinery. In the United States, EPA implementation of the 2026 Pesticide General Permit (effective October 2026) reinforces monitoring and reporting discipline around pesticide-related discharges, supporting demand for sensor-driven recordkeeping, verification, and automation of environmental controls alongside ongoing federal attention to precision agriculture connectivity (FCC task force activity).
Competitive Landscape
The agricultural sensors market share is moderately fragmented, with companies like Deere & Company, AGCO Corporation (Trimble Inc.), and Robert Bosch GmbH maintaining significant market positions while allowing room for niche innovators. The industry is experiencing increased consolidation as major companies integrate sensor hardware with analytics platforms to provide comprehensive solutions. Deere & Company's acquisition of vision-guided spraying technology and AGCO Corporation's joint ventures demonstrate the transition from individual hardware components to integrated systems incorporating cloud analytics, edge computing, and autonomous controls. These comprehensive solutions enable vendors to secure long-term contracts and strengthen relationships with farms seeking to optimize their operations.
Companies now focus their competitive strategies on developing proprietary connectivity frameworks, data-fusion algorithms, and agriculture-specific AI models. The livestock biosensor segment, particularly for poultry and swine, remains underdeveloped, creating opportunities for startups to adapt wearable health technology for livestock production. The market is shifting from traditional one-time purchases to subscription-based pricing and sensor-as-a-service models. Companies, including Topcon Corporation, Hexagon AB, are developing ultra-low-power circuitry and mesh networking solutions to minimize installation costs and enable scalable implementations across various farm sizes and locations.
Patent developments focus on technologies that reduce operational costs and improve system compatibility. Suppliers are establishing partnerships with drone manufacturers and irrigation system providers to expand their solution offerings and increase value across farming operations. Current regulatory frameworks acknowledge digital health applications in agriculture, enabling the adoption of cross-industry technologies for improved animal welfare. This integration of different sectors is expanding market opportunities and driving innovation. Market success increasingly depends on providing intelligent, integrated systems that support sustainable and data-driven farming practices.
Agricultural Sensor Industry Leaders
Deere & Company
AGCO Corporation (Trimble Inc.)
Topcon Corporation
Hexagon AB
Robert Bosch GmbH
- *Disclaimer: Major Players sorted in no particular order
Agricultural Sensor Market Companies Covered in this Report
- Deere & Company
- AGCO Corporation (Trimble Inc.)
- Topcon Corporation
- Sentek Technologies
- CropX Inc.
- Hexagon AB
- Robert Bosch GmbH
- Libelium Comunicaciones Distribuidas S.L.
- Auroras S.r.l.
- Pycno Industries, Inc.
- Acclima, Inc.
- The Toro Company
- METER Group
- Irrometer Company, Inc.
- Moocall Limited
- Yara International ASA

Market Opportunities and Future Outlook
A key opportunity is the shift from single-purpose sensing to platformized, multi-modal intelligence, where sensors, machine vision, and analytics are packaged into workflows that farms already run. John Deere has expanded the See and Spray ecosystem into field scouting outputs such as weed pressure and stand-count mapping, and it previewed second-generation See and Spray capabilities that add biomass sensing and weed pressure mapping across more crops. These steps broaden the scope of sensor data beyond spray control into broader agronomic decision support, while creating demand for retrofit-ready modules, calibration services, and software layers that translate measurements into maps, prescriptions, and compliance-ready records.
Network and service models are also widening adoption paths where connectivity and smallholder economics constrain full-stack deployments. In July 2026, Scanit Technologies launched the Iowa SporeWarn Network using an AI-enabled SporeCam platform for real-time airborne pathogen monitoring, showing how a subscription-like network approach can share sensing infrastructure and deliver localized risk signals rather than relying on device ownership. At the same time, integration of autonomy and precision implements, such as the June 2026 technical integration between Sabanto Autonomy and Verdant Robotics SharpShooter for plant-level precision application via CAN bus communication, underscores demand for interoperable sensor interfaces, edge processing, and standardized machine-to-implement data exchange, aligning with policy attention on interconnectivity standards and increasing sensor content per machine pass.
Recent Industry Developments in Agricultural Sensor Market
- July 2026: John Deere previewed second-generation See and Spray technology ahead of model year 2027 sprayers, expanding crop compatibility and adding new sensing-derived agronomic layers such as biomass sensing, stand counting, and weed pressure mapping. The update increases the value extracted from existing camera and sensor suites by turning operational passes into repeatable data products that can be tied to scouting and input decisions.
- April 2026: Deere & Company unveiled See & Scout, a field scouting feature that uses See & Spray camera data to generate weed pressure and stand count maps and bundles it into higher-tier plans for model year 2027 sprayers. This positions sensing as part of a recurring digital-service layer and raises competitive pressure on standalone sensor offerings to integrate with decision tools and farm workflows.
- November 2024: CropX introduced a new agricultural sensor in Australia and New Zealand that monitors real-time evapotranspiration directly from the plant canopy. The launch supports irrigation-optimization use cases in water-sensitive regions and enables wider deployment of climate-responsive crop management based on localized, real-time measurements.


Agricultural Sensor Market Report Scope and Research Methodology
Market Definition and Coverage
For this report, the agricultural sensors market is defined as revenues earned from sensors used in farm and livestock operations to measure field, crop, and animal conditions, and to support monitoring and control decisions in agriculture.
Scope exclusions: farm machinery that does not perform sensing, stand-alone software analytics, and connectivity services are excluded unless they are bundled and priced with the sensor offering.
Segments Covered in This Report
- By Type
- Humidity Sensor
- Electrochemical Sensor
- Mechanical Sensor
- Airflow Sensor
- Optical Sensor
- Pressure Sensor
- Water Sensor
- Soil-moisture Sensor
- Livestock Biosensor
- Other Types (pH Sensor, EC Sensor, Leaf Wetness Sensor, and More)
- By Application
- Dairy Management
- Soil Management
- Climate Management
- Water Management
- Smart Greenhouse Monitoring
- Crop Scouting
- By Geography
- North America
- United States
- Canada
- Mexico
- Rest of North America
- Europe
- Germany
- United Kingdom
- France
- Spain
- Italy
- Russia
- Rest of Europe
- Asia-Pacific
- China
- India
- Japan
- Australia
- Thailand
- South Korea
- Rest of Asia-Pacific
- South America
- Brazil
- Argentina
- Rest of South America
- Middle East
- Saudi Arabia
- Turkey
- Rest of Middle East
- Africa
- South Africa
- Kenya
- Rest of Africa
- North America
Data Sources, Market Sizing, and Validation
Desk Research
Desk research was used to set the starting structure of the model and to avoid building assumptions in isolation. We reviewed public statistics and reference series that act as demand anchors, such as FAOSTAT for crop and livestock indicators, USDA and the Economic Research Service for farm economics and technology adoption context, Eurostat for agricultural structure, and World Bank datasets for macro and rural connectivity signals.
To keep the pricing and shipment logic grounded, we also checked company filings and annual reports, investor presentations, product catalogs and specification sheets, and association and extension publications that describe typical sensor use cases on farms. Patent databases were referenced to understand which sensing methods are being commercialized and how quickly features are changing, and an import and export shipment-level database was used selectively to sanity check cross-border flows for sensor-related components. These desk sources are illustrative and not exhaustive, and many other public references were used to fill gaps and confirm details during the work.
Primary Interviews and Surveys
Primary work focused on validating what is actually installed and purchased, and how budgets move across seasons and crop cycles. We spoke with a mix of sensor manufacturers, channel partners, agronomy service providers, and end users, then compared how adoption and replacement behavior differs across APAC, EMEA, and the Americas.
Distribution of primary research fieldwork respondents
| Company type | Respondent position | Region |
|---|---|---|
| Top tier: 35% | CXOs: 17% | APAC: 47% |
| Mid tier: 44% | Functional/Unit leaders: 33% | EMEA: 33% |
| Smaller Players: 21% | Managers: 50% | Americas: 20% |
Market-Sizing & Forecasting
Market sizing was built using a top-down approach where agricultural activity and technology adoption indicators were reconstructed into an addressable sensor demand pool, then converted into value using realistic price bands. Once the total was shaped, we corroborated it through selective bottom-up checks, such as sampled price per unit multiplied by shipment volumes shared in interviews, channel mix checks, and supplier revenue splits where disclosure allowed it.
Key inputs used in the model included the mix of irrigated versus rainfed farmland, protected cultivation area growth, livestock herd indicators where monitoring is common, replacement cycles for field and water sensors, and the pace of farm digitization supported by connectivity and subsidy programs. Because pricing is not uniform, average selling price trends were adjusted by sensor type and typical on-farm configurations, and gaps were handled by using proxy adoption rates from comparable crops and neighboring countries, before being rechecked with experts.
For forecasting, scenario analysis was used with a base case guided by what interviewees expect for precision agriculture spending, input-cost pressure, and water management needs. The final trajectory was then tested against historical growth patterns to ensure the forward curve did not imply unrealistic step changes in adoption.
Data Validation & Update Cycle
Validation is done through repeated variance checks between the modeled totals and independent signals, such as agriculture output trends, hardware shipment direction, and disclosed smart farming investment priorities. When a large swing appears, the underlying drivers are revisited, followed by a second-pass review by another analyst before the numbers are signed off.
The report is refreshed annually, and interim updates are triggered when material events occur, such as major policy changes, sharp currency moves affecting imported hardware, or abrupt changes in farm input economics. Before delivery, we do a final pass to incorporate the latest public releases, and we re-contact select experts if a key assumption has shifted.
Mordor Intelligence's Agricultural Sensors Market Size Measured Against Other Published Estimates
It is common to see different market sizes for agricultural sensors because teams choose different scope lines, then apply different pricing and adoption assumptions. The largest gaps usually come from what gets counted as a sensor sale, how bundled farm solutions are treated, and which year is used as the base for converting volumes into USD values.
By tracking shipment and adoption signals and refreshing price bands with channel checks, Mordor Intelligence keeps the count limited to sensor revenues tied to farm and livestock monitoring use cases, rather than rolling in broader precision agriculture software and service spend. Some published estimates also rely on a single aggressive adoption curve across regions, while our approach separates APAC, EMEA, and the Americas based on farm structure and replacement behavior, then rechecks these splits in primary calls.
Benchmark comparison
| Source | Market Size | Gaps in Research Methodology |
|---|---|---|
| Mordor Intelligence | USD 2.36 B (2026) | |
| Global Consultancy A | USD 2.32 B (2024) | Uses an earlier base year and a shorter forecast window, and the scope appears to emphasize core farm sensing categories without fully reflecting newer livestock and water monitoring configurations that are being adopted in some regions. |
| Industry Publisher B | USD 4.43 B (2024) | Likely applies a wider boundary that can include adjacent precision agriculture spend and broader solution bundles, which inflates the value pool when software, platforms, or services are counted alongside sensor hardware. |
The spread is mainly explained by boundary choices and how prices and bundles are converted into revenue, not by disagreement that adoption is rising. When the scope is kept consistent and the key variables are checked against field feedback, the final number becomes easier to trace and to reuse for planning.


Key Questions Answered in the Report
What is the global value of the agricultural sensors market in 2026?
The agricultural sensor market size is USD 2.36 billion in 2026.
How fast is demand growing for climate-management sensor applications?
Climate-management deployments are rising at an 8.18% CAGR between 2026 and 2031.
Which sensor type presently leads global revenue?
Soil-moisture sensors lead with a 27.62% share of global revenue in 2025.
Which region is growing the fastest in adopting agricultural sensors?
Asia-Pacific registers the highest 7.44% CAGR through 2031, fueled by large-scale government digitization programs.
What financing model is easing adoption for small and midsize farms?
Sensor-as-a-service subscriptions convert large capital costs into manageable annual fees, expanding access for smaller producers.
Page last updated on:


 Your data is secure and never sold or shared.


