
Market Overview
| Study Period | 2021 - 2031 |
|---|---|
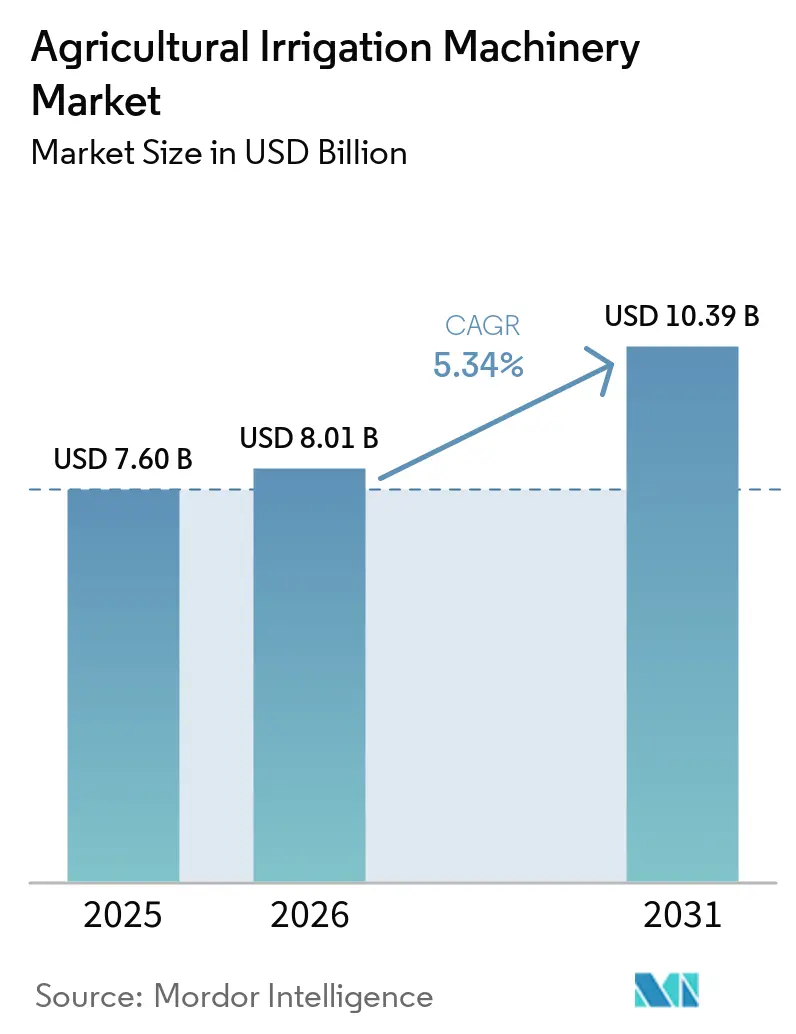
| Market Size (2026) | USD 8.01 Billion |
| Market Size (2031) | USD 10.39 Billion |
| Growth Rate (2026 - 2031) | 5.34 % |
| Fastest Growing Market | Asia Pacific |
| Largest Market | North America |
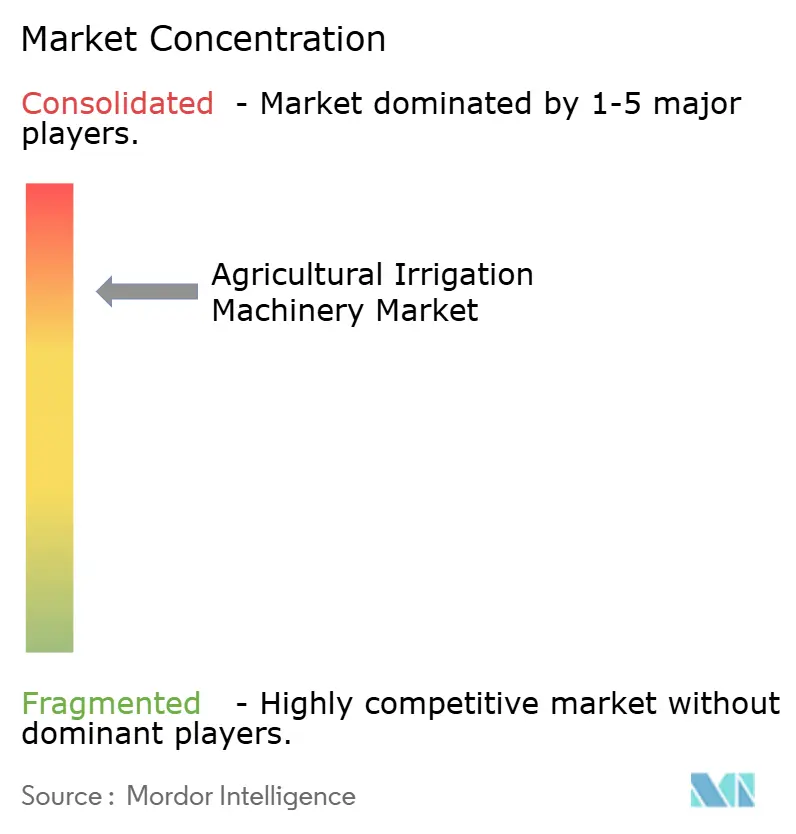
| Market Concentration | High |
Major Players *Disclaimer: Major Players sorted in no particular order Image © Mordor Intelligence. Reuse requires attribution under CC BY 4.0. | |
Agricultural Irrigation Machinery Market Analysis by Mordor Intelligence
The agricultural irrigation machinery market size was valued at USD 7.60 billion in 2025 and estimated to grow from USD 8.01 billion in 2026 to reach USD 10.39 billion by 2031, at a CAGR of 5.34% during the forecast period (2026-2031). Demand is focusing on equipment that integrates water-use efficiency with digital compliance reporting, driving changes in capital spending priorities faster than traditional subsidy cycles. State-level water-reporting mandates in California and Arizona are accelerating sensor adoption, while India’s micro-irrigation grants are compressing grower payback horizons from five years to less than three. Pivot upgrades dominate in North American grain belts, but fragmented holdings across Asia-Pacific are steering growers toward modular drip kits. Patent activity in variable-rate irrigation doubled after 2024, confirming that manufacturers see zone-specific delivery as the next competitive battleground.
Key Report Takeaways
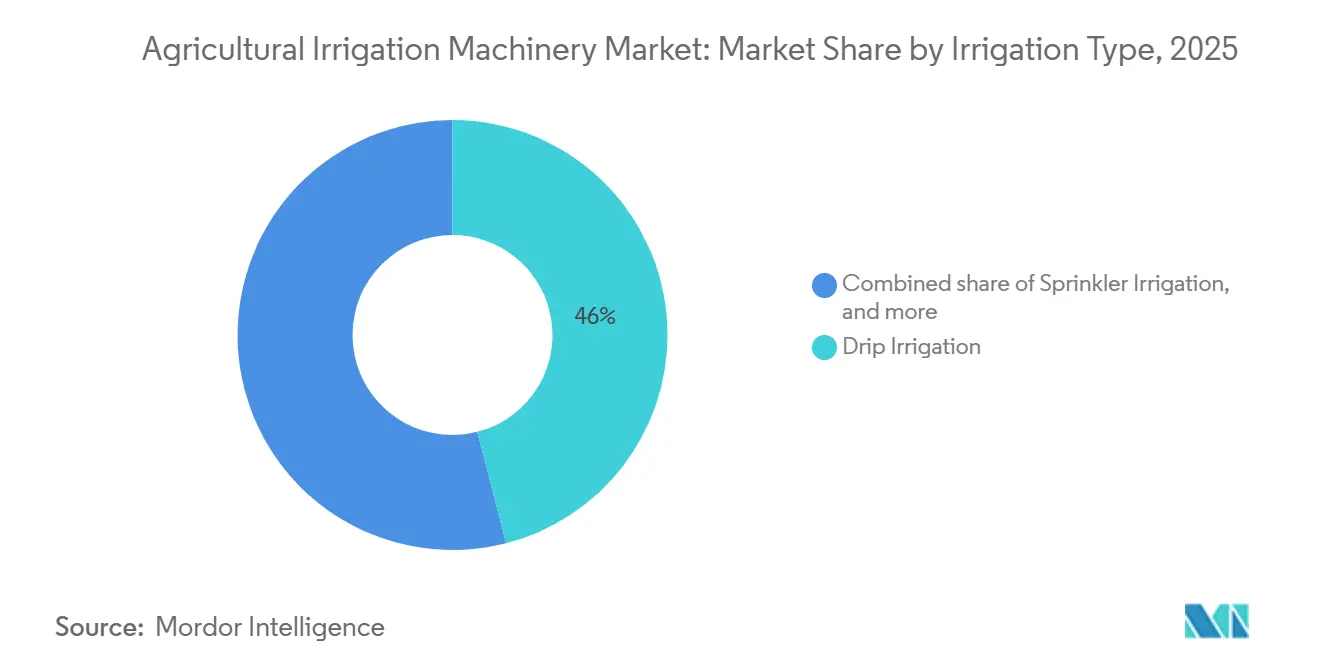
- By irrigation type, drip irrigation held the largest segment, accounting for 46.0% of the agricultural irrigation machinery market share in 2025, while sprinkler irrigation is the fastest-growing segment, projected to advance at an 8.0% CAGR through 2031.
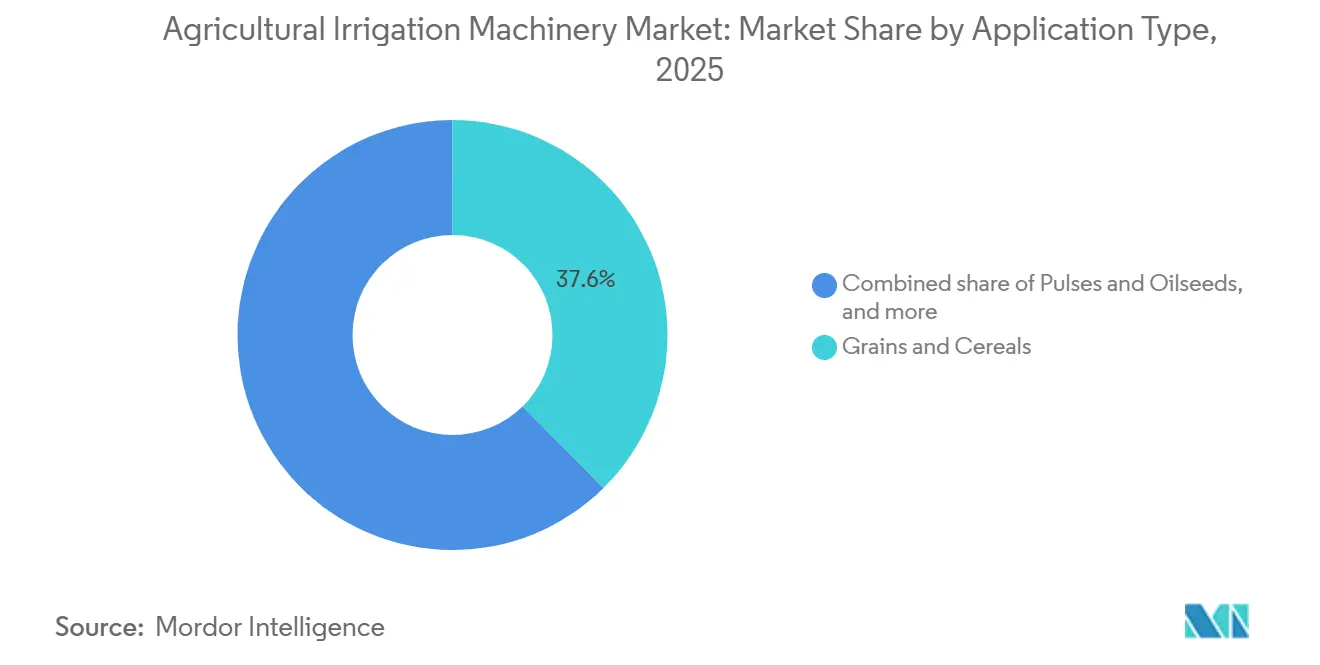
- By application, grains and cereals held the largest share, 37.6%, of the agricultural irrigation machinery market size in 2025, while fruits and vegetables are the fastest-growing segment, projected to expand at a 9.4% CAGR to 2031.
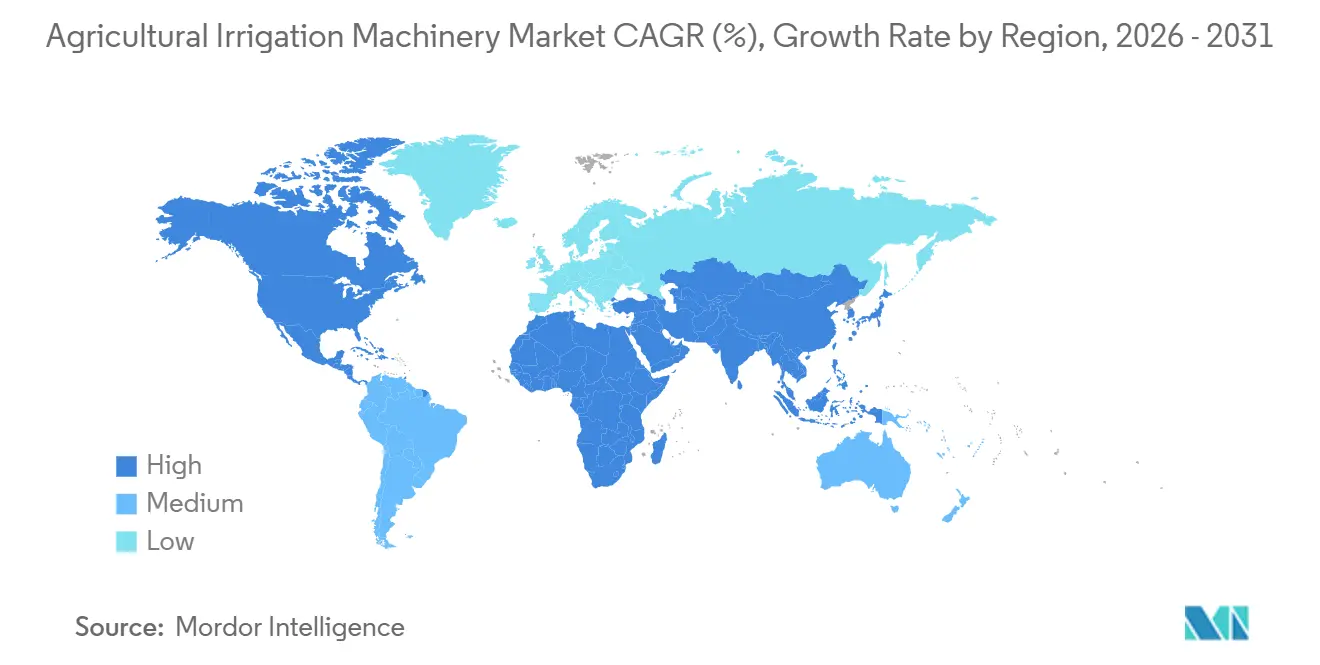
- By geography, North America was the largest region with 32.1% in 2025, and Asia-Pacific is set to log the fastest-growing regional CAGR at 8.0% through 2031.
Note: Market size and forecast figures in this report are generated using Mordor Intelligence’s proprietary estimation framework, updated with the latest available data and insights as of 2026.
Market Trends and Insights
Drivers Impact Analysis of Agricultural Irrigation Machinery Market*
| Driver | (~) % Impact on CAGR Forecast | Geographic Relevance | Impact Timeline |
|---|---|---|---|
| Government subsidies for micro-irrigation adoption | +2.1% | Asia-Pacific core, spillover to Middle East and Africa | Medium term (2-4 years) |
| Rising water scarcity is pushing demand for precision irrigation | +2.5% | Global, with peak intensity in Middle East, North Africa, and California | Long term (≥4 years) |
| Labor shortages are accelerating the mechanization of mid-size farms | +1.8% | North America and Europe, and emerging in Asia-Pacific | Short term (≤2 years) |
| Integration of IoT sensors enabling pay-as-you-grow service models | +1.2% | North America and Europe are early adopters, and Asia-Pacific is following | Medium term (2-4 years) |
| Environmental, Social, and Governance (ESG)-linked finance rewarding water-efficiency investments | +0.9% | Europe and North America, and with selective uptake in the Asia-Pacific | Long term (≥4 years) |
| Surge in carbon-credit schemes for water-saving technologies | +0.7% | Global, with the highest activity in voluntary carbon markets | Long term (≥4 years) |
| Source: Mordor Intelligence | |||
Government Subsidies for Micro-irrigation Adoption
Increased federal conservation funding has made upfront costs more manageable for medium-scale growers. In fiscal year 2024, the United States Department of Agriculture (USDA) Environmental Quality Incentives Program covered up to 75% of system expenses to efficiency initiatives upgrades[1]Source: USDA Natural Resources Conservation Service, “Environmental Quality Incentives Program,” USDA.GOV. The multi-year guarantees provided by the Inflation Reduction Act encourage manufacturers to expand production capacity, while outcome-based metrics align vendor offerings with policy objectives. The program's focus on measurable water-saving outcomes aligns with manufacturers' precision agriculture capabilities, offering a competitive advantage for technology-integrated solutions. These incentives have sparked significant annual order growth among emitter suppliers, signaling durable tailwinds for the agricultural irrigation machinery market.
Rising Water Scarcity Pushing Demand for Precision Irrigation
Mandatory reporting is replacing voluntary conservation, making sensor-equipped systems indispensable. The economic considerations extend beyond water costs to encompass regulatory compliance, as many jurisdictions enforce stricter water-use reporting requirements. The precision irrigation systems' ability to deliver detailed consumption analytics makes them essential tools for compliance rather than optional efficiency enhancements. Coupled with field trials, water savings from subsurface drip Evapotranspiration (ET) replacement, the evidence base now supports both agronomic and regulatory value propositions.
Labor Shortages are Accelerating the Mechanization of Mid-size Farms
Rising wages are forcing 50- to 200-hectare operations to automate or exit. According to the Food and Agriculture Organization of the United Nations, notes that automation reduces low-skilled jobs but increases demand for technicians who can manage sensor networks. A 2026 farmdocdaily study links precision-ag adopters with higher technician wages, illustrating a skill shift rather than a job drain. Equipment-sharing cooperatives in France, Germany, and the United States Midwest are amortizing pivot costs, expanding the agricultural irrigation machinery industry among growers previously priced out.
Integration of IoT Sensors Enabling Pay-as-You-Grow Service Models
Leasing bundles reduce upfront capital and align cash outflows with harvest inflows. Trimble’s fertigation controllers tie water and nutrient delivery to real-time crop data, cutting energy and carbon intensity in Chinese pilots. Subscription fees per hectare simplify accounting and attract tenant farmers, widening the addressable pool for the agricultural irrigation machinery market. The transition from capital expenditure to operating expense simplifies accounting and tax processes, increasing the appeal of precision irrigation for farm managers operating within corporate ownership structures.
Restraints Impact Analysis of Agricultural Irrigation Machinery Market*
| Restraint | (~) % Impact on CAGR Forecast | Geographic Relevance | Impact Timeline |
|---|---|---|---|
| High upfront capital cost for pivot systems | -1.4% | Global, with peak impact in developing markets | Short term (≤2 years) |
| Fragmented land holdings limiting equipment Return on investment (ROI) in developing countries | -1.2% | Asia-Pacific and Africa, with minimal impact in North America and Europe | Long term (≥4 years) |
| Growing concern over plastic waste from drip lines | -0.6% | Europe and North America, emerging in the Asia-Pacific | Medium term (2-4 years) |
| Cyber-vulnerability of connected irrigation networks | -0.4% | North America and Europe early, Asia-Pacific, and the Middle East | Medium term (2-4 years) |
| Source: Mordor Intelligence | |||
High Upfront Capital Cost for Pivot Systems
Center pivots surpass USD 100,000 per unit, and installation can add another 30%, creating a financing gap that traditional credit seldom fills. Leasing uptake is under 15% because residual values remain opaque, especially in markets lacking secondary equipment exchanges. The capital barrier is also driving interest in hybrid systems that combine pivot infrastructure with drip laterals, allowing growers to phase investment over multiple growing seasons while maintaining flexibility to adjust coverage area as land tenure stabilizes. These systems enable growers to spread investments across multiple growing seasons while retaining the flexibility to modify coverage areas as land tenure becomes more stable. Additionally, hybrid systems offer a scalable approach, allowing farmers to gradually expand irrigation coverage without committing to the full cost upfront, making them a more viable option for resource-constrained growers.
Growing Concern over Plastic Waste from Drip Lines
The European Union updated its Single-Use Plastics Directive in 2024, compelling manufacturers to trial biodegradable polyethylene and to implement take-back schemes to achieve 50% waste reduction by 2027 [2]Source: European Commission, “Single-Use Plastics Directive,” environment.ec.europa.eu. The directive also emphasizes the need for innovation in material science and waste management practices, pushing manufacturers to invest in research and development to meet the new standards. Additionally, the policy aims to foster collaboration between stakeholders, including governments, manufacturers, and consumers, to ensure effective implementation and long-term sustainability.
*Our forecasts treat driver/restraint impacts as directional, not additive. The impact forecasts reflect baseline growth, mix effects, and variable interactions.
Agricultural Irrigation Machinery Market Segment Analysis
By Irrigation Type:
Precision-Drip Captures Regulatory TailwindsDrip irrigation held the largest share, accounting for 46.0% of the agricultural irrigation machinery market in 2025, well above the market average. Drip irrigation's market growth is supported by California's reporting regulations favoring metered delivery and India's subsidies for emitters, tubing, and filters. The agricultural irrigation machinery market for drip irrigation components is anticipated to expand, fueled by increasing demand for moisture sensors and variable-rate controllers. While emitters and tubing continue to generate the majority of revenue, sensors represent the fastest-growing segment as farms transition from uniform to data-driven irrigation scheduling.
Sprinkler irrigation is the fastest-growing segment, projected to advance at an 8.0% CAGR through 2031, while mature dealer networks help preserve volumes, new sales skew toward variable-rate configurations that integrate soil probes and flow meters. Field trials in the United States Midwest show 15%-25% water cutbacks without yield loss when pivots shift from fixed to variable-rate application [3]Source: USDA Agricultural Research Service, “Variable-Rate Pivot Trials,” ars.usda.gov. Component innovation focuses on quick-connect couplers and self-cleaning filters, trimming installation labor by 30%-40%. Other methods, such as surface and furrow, are slipping below 10% combined share as water-scarcity policies tighten.



By Application Type:
Premium Crops Drive Technology AdoptionGrains and cereals held the largest share, 37.6%, of the agricultural irrigation machinery market in 2025. Demand favors cost-per-hectare economics, which continues to anchor sprinkler volumes. The disparity highlights varying economic dynamics, as specialty crop producers achieve higher returns per acre, which justify investments in advanced irrigation systems.
Fruits and vegetables are the fastest-growing segment, projected to expand at a 9.4% CAGR to 2031. High farm-gate prices justify precision drip irrigation, enabling deficit irrigation strategies that increase sugar content in grapes and improve berry uniformity. Spain’s digital-twin trial produced 26% water savings in vegetables by linking irrigation timing to real-time soil moisture. Manufacturers are rolling out crop-specific emitters and algorithmic scheduling services, monetizing agronomic expertise as a differentiator. The agricultural irrigation machinery market share linked to horticulture is therefore projected to climb incrementally by 2031.
Geography Analysis
North America Agricultural Irrigation Machinery Market
North America was the largest region, with 32.1% in 2025. Upgrades dominate because most irrigable acreage is already networked with pivots. Compliance mandates such as California’s Senate Bill 88 fuel retrofits that integrate flow meters and telemetry. Arizona’s grants are bridging the capital gap for sensor add-ons, sustaining pivot margins even as unit volumes plateau. Canada’s Prairie Provinces and Mexico’s Bajío region offer incremental growth but still account for only a fraction of the United States' demand.
APAC Agricultural Irrigation Machinery Market
Asia-Pacific is set to log the fastest-growing regional CAGR at 8.0% through 2031. Smallholder fragmentation means modular drip kits priced under USD 800 per hectare outsell large pivots by 4:1. Japan’s greenhouse boom is another tailwind, driving demand for high-pressure drip and fertigation controllers that command premium margins in the agricultural irrigation machinery market.
EMEA and South America Agricultural Irrigation Machinery Market
Europe is experiencing steady growth under the environmental pillar of the Common Agricultural Policy, which recognizes precision irrigation as a sustainable activity eligible for green financing. In the Mediterranean region, recurring droughts are accelerating the adoption of subsurface irrigation systems, while countries like the Netherlands and Germany focus on closed-loop greenhouse irrigation systems. In the Middle East and Africa, demand is driven by state-supported megafarms and climate-smart agricultural corridors. Meanwhile, South America's soybean-producing regions are investing in pivot irrigation systems to mitigate rainfall variability, contributing to a geographically diversified revenue stream within the agricultural irrigation machinery market.

Regulatory Landscape
Compliance and standardization are influencing irrigation machinery specifications and market entry plans, with formal performance and labeling criteria receiving increased attention in key markets. In the United States, the EPA WaterSense program supports guidance and labeling for weather-based irrigation controller performance, and its spray nozzle specification review was paused in February 2025 for further assessment.
Colorado enacted HB 26-1034 on May 4, 2026, effective August 12, 2026, reinforcing standardized efficiency criteria in procurement and compliance. Outside the United States, testing and documentation requirements are tightening in several regions: China implemented GB/T 21402-2025 for irrigation control heads on May 1, 2026; Vietnam STAMEQ suspended SASO mutual recognition for certain Chinese irrigation equipment in April 2026, shifting exporters toward local type testing and reinforcing demonstrated pressure and UV resistance performance in cross-border shipments; and the European Commission published Implementing Decision EU 2026/546 on March 12, 2026, updating harmonized standards for agricultural and forestry machinery.
Competitive Landscape
The agricultural irrigation machinery market is consolidated, with key players including The Toro Company, Lindsay Corporation, Valmont Industries, Inc. (Valley Irrigation), Netafim Ltd. (Orbia Advance Corporation), and Jain Irrigation Systems Limited (Rivulis Irrigation Limited). Netafim Ltd. utilizes agronomic advisory services to secure multi-season contracts, while Lindsay Corporation focuses on expanding its FieldNET analytics platform to encourage subscription renewals. Valmont Industries, Inc.’s Q1 2025 results highlight a shift toward software-enabled margin resilience, even as unit volumes stabilize in the North American market.
New entrants are targeting high-growth areas such as AI-guided scheduling and low-pressure drip tapes designed for smallholders. Patent filings are increasingly centered on sensor fusion and water-use algorithms, driving accelerated innovation cycles. Environmental, Social, and Governance (ESG) criteria are influencing procurement decisions, with preference given to companies offering recycling programs and transparent supply chains. Manufacturers that combine hardware reliability with integrated digital ecosystems are strengthening their competitive positions in the agricultural irrigation machinery market.
Cybersecurity has become a strategic priority as connected irrigation systems present potential vulnerabilities. Vendors are investing in encrypted communication protocols and remote firmware updates to address the concerns of risk-averse growers. Certification under programs such as the Environmental Protection Agency (EPA) WaterSense enhances access to subsidy opportunities, further supporting brand loyalty. Overall, established players that transition to full-stack solutions are better positioned to outperform competitors relying solely on mechanical offerings.
Agricultural Irrigation Machinery Industry Leaders
The Toro Company
Lindsay Corporation
Valmont Industries, Inc. (Valley Irrigation)
Netafim Ltd. (Orbia Advance Corporation)
Jain Irrigation Systems Limited (Rivulis Irrigation Limited)
- *Disclaimer: Major Players sorted in no particular order
Agricultural Irrigation Machinery Market Companies Covered in this Report
- Netafim Ltd. (Orbia Advance Corporation)
- Valmont Industries, Inc. (Valley Irrigation)
- Lindsay Corporation
- Jain Irrigation Systems Limited (Rivulis Irrigation Limited)
- The Toro Company
- Nelson Irrigation Corporation
- Rain Bird Corporation
- Mahindra & Mahindra Limited
- Hunter Industries Incorporated
- Reinke Manufacturing Company, Inc.
- Ningbo Rainfine Irrigation Co., Ltd.
- T-L Irrigation Company
- Sistemas Azud, S.A.
- Antelco Pty Ltd.

Market Opportunities and Future Outlook
Publicly funded irrigation modernization and expansion programs are generating near-term demand for equipment and controls tied to new command areas and rehabilitated distribution networks, particularly where tenders require measurable water savings and operational monitoring. In July 2026, the World Bank approved a USD 75 million grant for Tajikistan's SWIM-2 project to modernize water and irrigation management infrastructure across 100,000 hectares, coordinating pumps, flow measurement, filtration, and digital monitoring alongside civil works. In India, the Odisha cabinet approved a Rs 121 crore Parbati Giri Mega Lift Irrigation Scheme project in July 2026 to add 4,330 hectares of irrigation potential, supporting continued demand for lift irrigation hardware, pressurized distribution, and modular on-farm application equipment where surface supply is being converted into controlled delivery.
Opportunities are also clustering around new irrigated hectares paired with digital accountability, since governments and large growers need controllers, sensors, and telemetry to support reporting and operational optimization. In the Philippines, the fast-tracking of the Balog-Balog Multi-Purpose Project Phase II (July 2026) adds 21,935 hectares of irrigation alongside a 43.5 MW hydropower facility, expanding addressable demand for on-farm drip and sprinkler packages that can align with variable water availability and power economics. The National Irrigation Administration in Kalinga also outlined 71 irrigation projects for 2026 (P545 million), pointing to a distributed set of smaller procurements where suppliers with standardized kits, local service, and interoperable monitoring (sensor-controller connectivity aligned with widely used IoT architectures) can compete beyond single-episode equipment sales.
Recent Industry Developments in Agricultural Irrigation Machinery Market
- June 2026: Orbia Netafim opened a new manufacturing plant in Hermosillo, Sonora, Mexico, expanding irrigation product capacity for North and Central America. The added footprint supports shorter lead times and regional supply continuity for drip and related distribution components, strengthening competitiveness in markets where delivery schedules influence project awards.
- December 2025: Lindsay Corporation announced an USD 80 million supply agreement for Zimmatic irrigation systems and FieldNET remote management technology for projects in the Middle East and North Africa. The package links hardware with digital management at contract scale, reinforcing the shift toward recurring software and service pull-through alongside equipment deliveries.
- November 2024: The acquisition by Netafim Ltd. Italia of Tecnir S.r.l., a precision irrigation specialist, expands capabilities and reach in Southern European markets. The deal enhances technical coverage for premium crop irrigation applications and positions the group to offer integrated design and service packages in the region.


Agricultural Irrigation Machinery Market Report Scope and Research Methodology
Market Definition and Coverage
For this study, the market covers machinery and equipment used to move, control, and apply water on farms, across irrigation approaches such as drip, sprinkler, pivot, and related supporting hardware that is sold for agricultural use.
Scope exclusions: We exclude civil irrigation infrastructure (canals, dams, and major pipelines), general farm water storage works, and purely service-only revenues where no machinery is sold.
Segments Covered in This Report
- By Irrigation Type
- Sprinkler Irrigation
- Drip Irrigation
- Pivot Irrigation
- Other Irrigation Types
- By Application Type
- Grains and Cereals
- Pulses and Oilseeds
- Fruits and Vegetables
- Other Applications
- By Geography
- North America
- United States
- Canada
- Mexico
- Rest of North America
- Europe
- Germany
- United Kingdom
- France
- Italy
- Netherlands
- Russia
- Rest of Europe
- Asia-Pacific
- China
- India
- Japan
- Cambodia
- Rest of Asia-Pacific
- South America
- Brazil
- Argentina
- Peru
- Rest of South America
- Middle East
- Saudi Arabia
- Turkey
- Rest of Middle East
- Africa
- South Africa
- Egypt
- Rest of Africa
- North America
Data Sources, Market Sizing, and Validation
Desk Research
Desk work started with building the demand backdrop, because irrigation equipment demand is tightly linked to crops, water availability, and farm investment cycles. We used public sources such as USDA and ERS releases, FAO databases, World Bank water stress and agriculture indicators, and UN Comtrade trade statistics to anchor acreage, crop mix, and import-export movement of irrigation equipment.
To keep the model practical, we added checks from company annual reports, investor presentations, association websites, and reputed press coverage on irrigation adoption and pricing direction. Where financial splits were not clearly stated, we relied on paid company financials and intelligence, plus patent databases and shipment-level trade views, to validate product mix signals and map typical price bands. These examples are not exhaustive, and other sources were also referenced for data collection, validation, and research clarification.
Primary Interviews and Surveys
Primary inputs were collected through expert interviews and structured surveys with manufacturers, distributors, dealers, irrigation designers, and farm-side buyers, so the market size is grounded in what is actually purchased and installed. We used these conversations to confirm what gets counted as irrigation machinery in practice, to pressure-test average selling prices, and to validate adoption patterns across APAC, EMEA, and the Americas.
Distribution of primary research fieldwork respondents
| Company type | Respondent position | Region |
|---|---|---|
| Top tier: 32% | CXOs: 20% | APAC: 41% |
| Mid tier: 46% | Functional/Unit leaders: 22% | EMEA: 37% |
| Smaller Players: 22% | Managers: 58% | Americas: 22% |
Market-Sizing & Forecasting
Sizing was built with a top-down demand pool approach where irrigated area by crop and region is translated into equipment need using adoption rates by irrigation type, and then converted into value using typical system price ranges. To keep results realistic, selective bottom-up checks were added, such as supplier revenue roll-ups for the irrigation machinery line, distributor channel checks, and sampled ASP times volume calculations for drip, sprinkler, and pivot equipment.
Key inputs that were tracked include irrigated acreage trends, crop planting mix (grains, oilseeds, fruits and vegetables), replacement cycles for sprinkler and pivot systems, the shift toward micro-irrigation, and pricing movement for controllers, filters, tubing, and fittings. In markets where data gaps existed, assumptions were filled using comparable-region adoption proxies and then adjusted after interviews, before being carried into the final totals.
For forecasting, scenario analysis was used because irrigation demand moves with weather variability, water regulation pressure, and farm capital spend. Growth paths for irrigated area, adoption penetration, and price progression were set with expert consensus, and then applied consistently across regions and irrigation types to generate year-by-year market values.
Data Validation & Update Cycle
Outputs were triangulated against independent signals, including trade flows, agriculture capital expenditure direction, and installed-base replacement logic, which helps catch values that look too high or too low for the crop and region context. Variance checks were run across irrigation types and geographies, and any break in expected relationships (for example, acreage growth not matching equipment demand) triggered a re-check of the inputs.
Before sign-off, the model and assumptions go through multi-step analyst review, and follow-up outreach is done when a major mismatch is found in pricing, adoption, or coverage boundaries. The report is refreshed annually, and interim updates are made when material events change demand or pricing assumptions. Right before delivery, a fresh pass is completed so clients receive the latest updated view.
Mordor Intelligence's Agricultural Irrigation Machinery Market Size Compared Against Other Published Estimates
Published market sizes for agricultural irrigation machinery often do not match because each publisher draws the market boundary a bit differently and uses different demand proxies to convert farm activity into equipment value. Differences also show up when one model leans more on shipment signals and another leans more on installed-base replacement, which can shift the counted value in a given year.
By tracking irrigation-type adoption rates and price bands for core components, Mordor Intelligence keeps the estimate tied to agricultural end-use equipment sales, while some sources appear to broaden the basket by mixing in wider irrigation system spending and a more aggressive price progression assumption.
Benchmark comparison
| Source | Market Size | Gaps in Research Methodology |
|---|---|---|
| Mordor Intelligence | USD 7.60 B (2025) | |
| Global Consultancy A | USD 8.71 B (2025) | This estimate seems to use a broader scope for irrigation systems and related components, and it can also apply faster price growth, which lifts the total for the same base year. |
| Industry Analytics B | USD 9.70 B (2024) | The base year differs and the segmentation implies a wider machinery set, so the 2024 total may include adjacent equipment categories and convert values with a different currency timing and inflation handling. |
The spread across sources mainly comes from scope boundaries, base-year choice, and how adoption and pricing are carried into the value build. Using clear irrigation-type mapping, explicit price bands, and repeatable demand drivers gives a practical number that can be traced back to acreage, adoption, and replacement behavior.


Key Questions Answered in the Report
What is the projected value of the agricultural irrigation machinery market in 2031?
The agricultural irrigation machinery market was valued at USD 7.60 billion in 2025 and estimated to grow from USD 8.01 billion in 2026 to reach USD 10.39 billion by 2031, at a CAGR of 5.34% during the forecast period (2026-2031).
Which irrigation type is growing fastest?
Sprinkler irrigation is the fastest-growing segment, projected to advance at an 8.0% CAGR through 2031.
What policy is driving sensor adoption in California?
Senate Bill 88, effective October 2025, requires diversion measurement and reporting, boosting demand for sensor-equipped systems.
How do pay-as-you-grow models affect capital cost?
Leasing bundles that include IoT sensors reduce upfront expenditure by 40% to 60%, making precision irrigation accessible to cash-constrained growers.
Page last updated on:





