Market Overview
| Study Period | 2021 - 2031 |
|---|---|
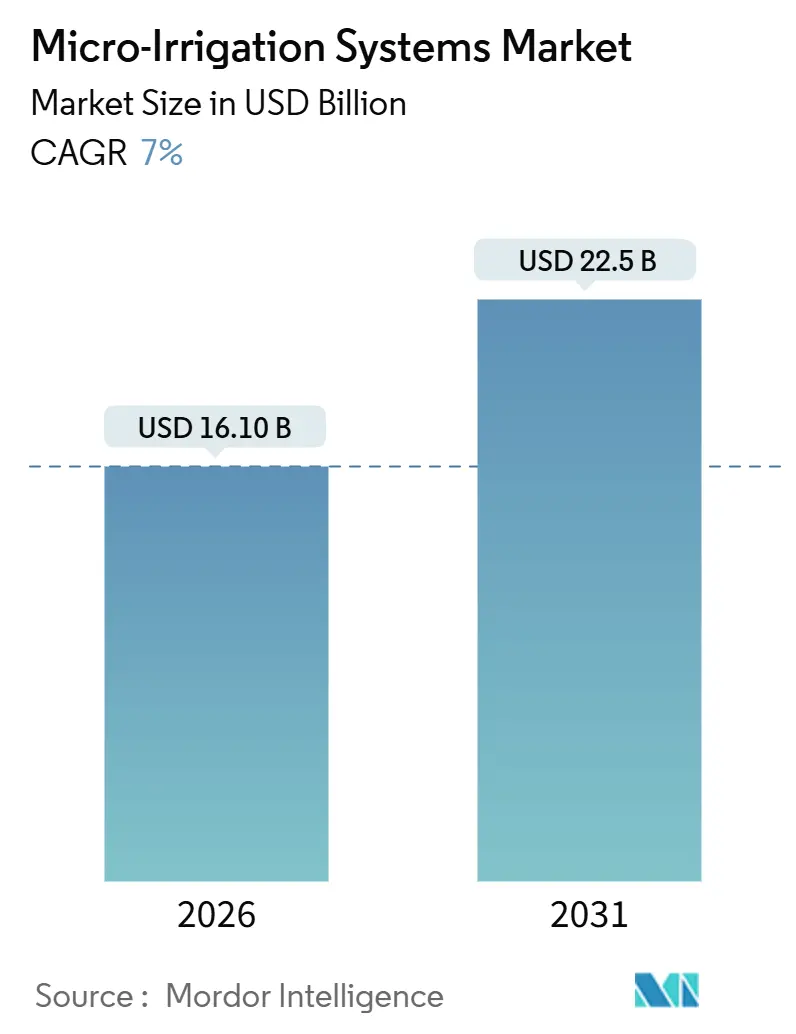
| Market Size (2026) | USD 16.10 Billion |
| Market Size (2031) | USD 22.5 Billion |
| Growth Rate (2026 - 2031) | 7.00% CAGR |
| Fastest Growing Market | Middle East |
| Largest Market | Asia Pacific |
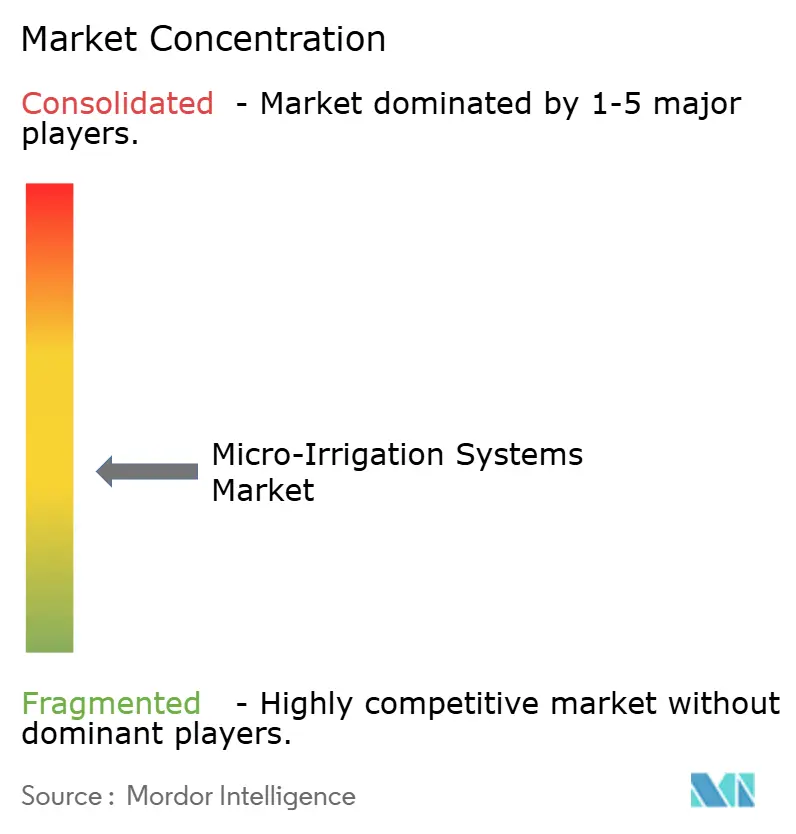
| Market Concentration | Medium |
Major Players *Disclaimer: Major Players sorted in no particular order Image © Mordor Intelligence. Reuse requires attribution under CC BY 4.0. | |
Micro-Irrigation Systems Market Analysis by Mordor Intelligence
The micro irrigation systems market size stood at USD 16.1 billion in 2026 and is projected to reach nearly USD 22.5 billion by 2031, registering a 7% CAGR. Adoption is climbing because climate volatility is shrinking freshwater reserves, and growers must squeeze more yield from every cubic meter of water[1]Source: Food and Agriculture Organization, “Water Scarcity,” FAO.org. Precision delivery reduces consumption by 30-50% compared to flood irrigation and often increases output by 20-40%, resulting in higher gross margins when commodity prices are stable. Governments in India, China, and Saudi Arabia now subsidize up to 55% of capital costs, shortening payback periods for smallholders. Subsidies increasingly bundle sensors and controllers, nudging demand toward digital integration. Meanwhile, patent filings for self-flushing and pressure-compensating emitters increased in 2024 and 2025, indicating a shift in the industry from traditional metal and plastic engineering to data-driven reliability.
Key Report Takeaways
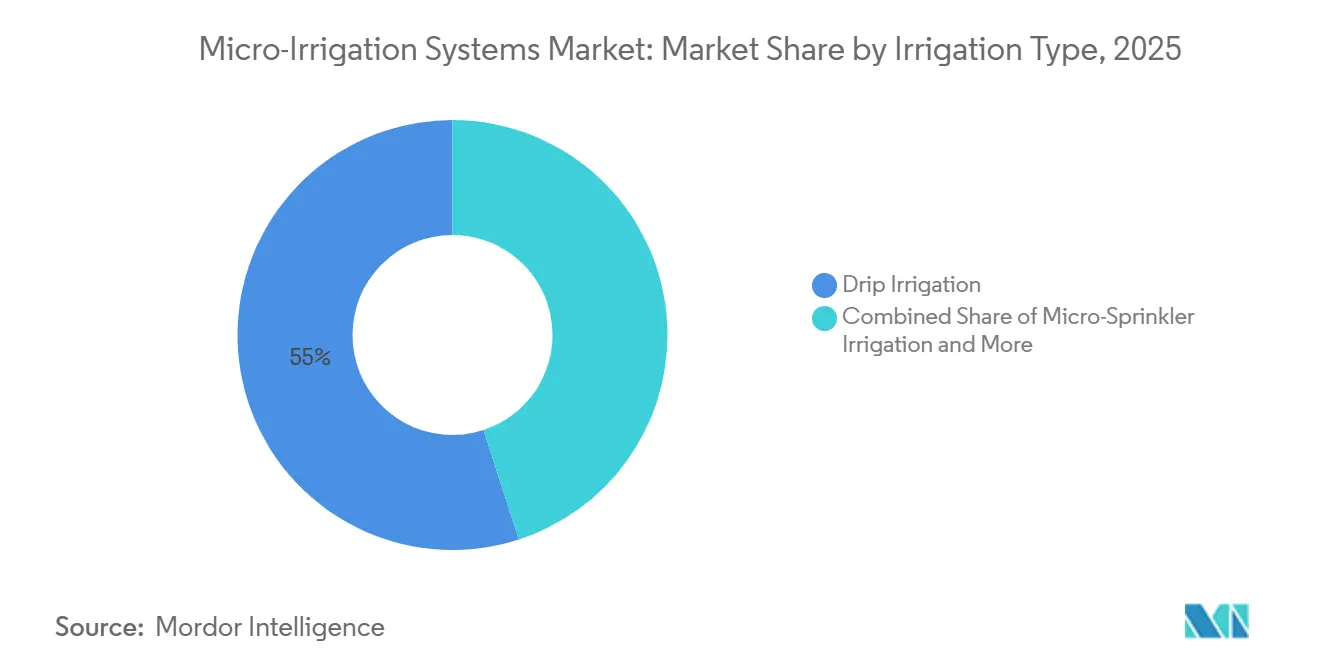
- By irrigation type, drip systems accounted for 55% of the micro irrigation systems market share in 2025, while subsurface drip is forecast to expand at a 9% CAGR through 2031.
- By component, drippers and emitters accounted for 34% of the micro irrigation systems market size in 2025, and controllers and sensors are anticipated to grow at an 11.2% CAGR through 2031.
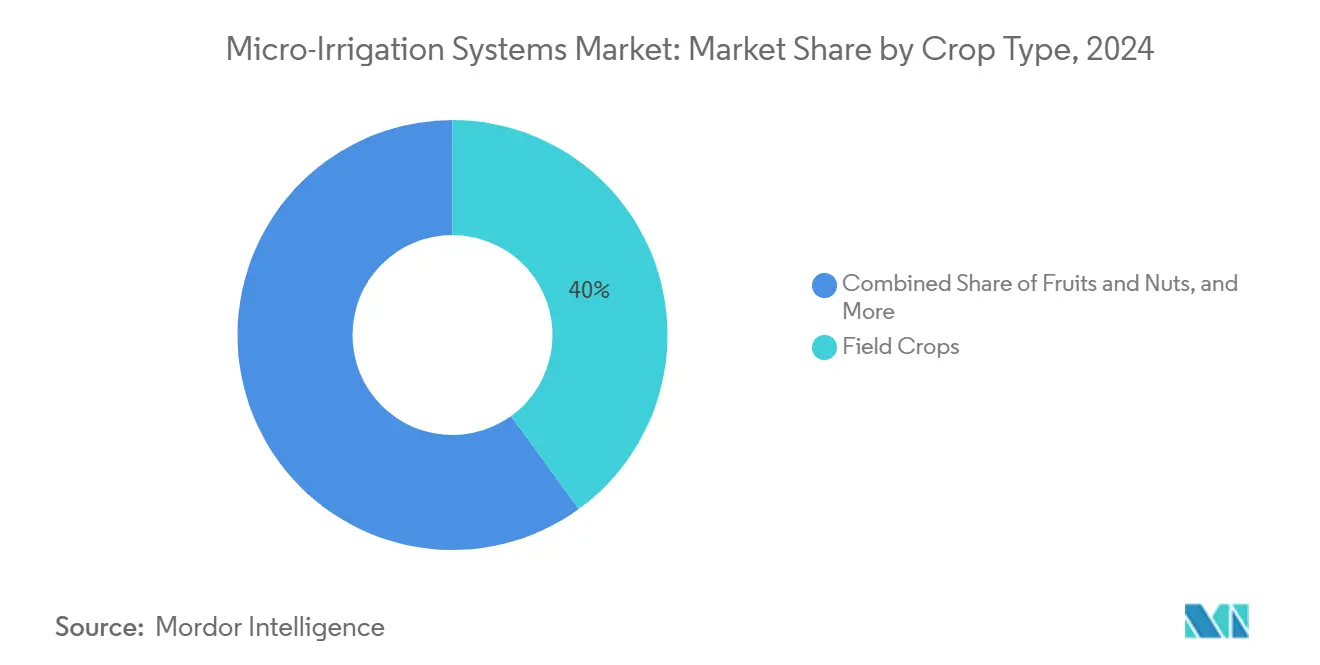
- By crop, field crops captured 40% of the micro irrigation systems market share in 2025, and the vegetable segment is projected to record an 8.4% CAGR through 2031.
- By end user, large commercial farms accounted for 52% of the micro irrigation systems market size in 2025, and greenhouses are projected to grow at the fastest rate, with a 10.5% CAGR from 2026 to 2031.
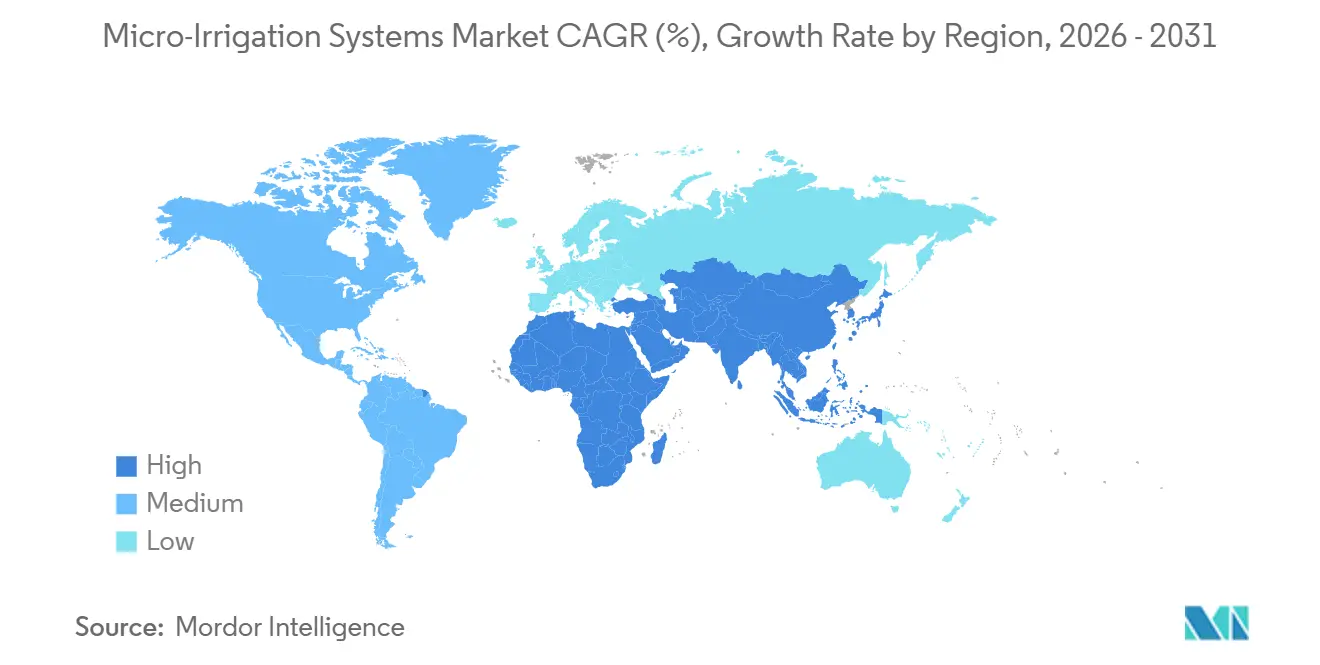
- By geography, the Asia-Pacific region constituted 45% of the 2025 revenue, while the Middle East is the fastest-growing region, with a 9% CAGR through 2031.
Note: Market size and forecast figures in this report are generated using Mordor Intelligence’s proprietary estimation framework, updated with the latest available data and insights as of January 2026.
Global Micro-Irrigation Systems Market Trends and Insights
Drivers Impact Analysis*
| Driver | (~) % Impact on CAGR Forecast | Geographic Relevance | Impact Timeline |
|---|---|---|---|
| Government subsidies for water-efficient agriculture | +1.8% | Asia-Pacific, Middle East, Africa | Medium term (2-4 years) |
| Intensifying water scarcity and drought frequency | +2.1% | Global, peak in Middle East and North Africa | Long term (≥ 4 years) |
| Need to maximize crop yield per drop | +1.5% | Global | Medium term (2-4 years) |
| Rising adoption of precision agriculture and smart farming tools | +1.2% | North America, Europe, Asia-Pacific | Short term (≤ 2 years) |
| Solar-powered micro-irrigation packages gaining traction | +0.7% | Africa, South Asia, Middle East | Medium term (2-4 years) |
| Pay-as-you-go micro-irrigation financing models for smallholders | +0.6% | Sub-Saharan Africa, South Asia | Long term (≥ 4 years) |
| Source: Mordor Intelligence | |||


Government Subsidies for Water-Efficient Agriculture
Public funding is compressing payback periods and expanding adoption among farmers lacking collateral. India’s Pradhan Mantri Krishi Sinchayee Yojana allocated INR 40 billion (USD 480 million) in fiscal 2025 to subsidize up to 55% of the system costs for smallholders, covering an additional 500,000 hectares[2]Source: Government of India, “Per Drop More Crop,” pmksy.gov.in. China disbursed CNY 15 billion (USD 2.1 billion) in grants to drought-prone provinces[3]Source: Ministry of Agriculture and Rural Affairs China, “Water-Saving Irrigation Plan,” moa.gov.cn. Saudi Arabia’s Vision 2030 allocates 50% of its capital expenditure to date palm and vegetable growers. These incentives reduce the effective cost of capital, making investments viable even during periods of commodity price slumps. Requirements now emphasize sensor bundles, which accelerate digital penetration. Subsidy momentum is likely to continue as countries pursue food security goals under tightening water budgets, supporting long-term demand for micro irrigation systems.
Intensifying Water Scarcity and Drought Frequency
Seventeen countries have already withdrawn more than 80% of their renewable freshwater resources, creating structural pressure to switch from gravity flood to pressurized precision delivery. Morocco, following its worst drought in 30 years, now mandates the use of drip irrigation in new orchards and vows to phase out flood irrigation systems by 2028. California’s regulators tightened pumping rights in the Sacramento–San Joaquin Delta in 2025, catalyzing conversions to subsurface drip irrigation in almond and pistachio orchards. Water-productivity gains are decisive, as drip-irrigated vegetables consume 3,000 m³ per hectare, versus 8,000 m³ for flood-irrigated wheat, yet deliver triple the gross margin. This economic arbitrage is reshaping crop choices across arid zones, propelling the micro irrigation systems market through the decade.
Need to Maximize Crop Yield per Drop
Precision water and nutrient delivery reduces plant stress and disease while raising marketable output. Punjab field trials showed that drip-irrigated cotton achieved an 18% higher lint yield and a 35% lower water use than furrow-irrigated plots, thereby boosting water productivity by 28%. Israeli research on tomato processing cut blossom-end rot by 40%, validating the quality premium associated with precise moisture control. Such gains are particularly important in high-value horticulture, where retailers pay for consistency. As climate swings increase mid-season drought risk, precision irrigation acts as yield insurance, reinforcing growers’ willingness to invest. Consequently, agronomic performance continues to elevate the micro irrigation systems market beyond purely water scarcity narratives.
Rising Adoption of Precision Agriculture and Smart Farming Tools
Low-cost sensors, cloud analytics, and cellular IoT connectivity now turn static hardware into live decision-support platforms. Netafim’s NetBeat covers more than 100,000 hectares, automatically adjusting schedules based on real-time soil moisture data. John Deere’s 2024 purchase of European telemetry assets signals that machinery makers will bundle precision water delivery with autonomous tractors. Economic benefits are compelling as a 500-hectare almond ranch cut water use by 12%, nitrogen by 15%, and eliminated 80 hours of monthly valve-adjustment labor in 2025. Policy changes also exist in the European Union's 2023-2027 direct payments, which tie digital farm management adoption. These factors jointly accelerate sensor penetration, fueling both hardware shipments and subscription revenues across the micro irrigation systems market.
Restraint Impact Analysis*
| Restraint | (~) % Impact on CAGR Forecast | Geographic Relevance | Impact Timeline |
|---|---|---|---|
| High upfront installation cost for small farmers | -1.4% | Global, peak in South Asia and Sub-Saharan Africa | Short term (≤ 2 years) |
| Emitter clogging and maintenance complexity | -0.9% | Middle East, North Africa, South Asia | Medium term (2-4 years) |
| Shortage of skilled micro-irrigation technicians | -0.5% | Africa, South Asia, South America | Long term (≥ 4 years) |
| End-of-life plastic tubing waste management issues | -0.3% | Europe, North America | Long term (≥ 4 years) |
| Source: Mordor Intelligence | |||
High Upfront Installation Cost for Small Farmers
Turnkey drip systems run USD 1,200–1,800 per hectare, equal to 6–12 months of net farm income for landholdings under 2 hectares in South Asia or East Africa. Even after a 50% subsidy, growers must divert scarce liquidity from essentials such as seed and fertilizer. Land-tenure uncertainty further depresses the willingness to invest because farmers fear losing plots before recouping their capital. Modular kits lower entry thresholds, but they sacrifice hydraulic efficiency and complicate maintenance. In sub-Saharan Africa, agriculture accounts for less than 5% of bank lending, unsecured interest rates exceed 20%, limiting credit uptake. Unless financing innovations spread swiftly, sticker shock will continue to slow penetration in the micro irrigation systems market.
Emitter Clogging and Maintenance Complexity
Sediment, algae, and mineral precipitates obstruct emitter orifices, cutting discharge uniformity and raising downtime. Egyptian cotton fields, where source water exceeded 500 ppm total dissolved solids, averaged 12% emitter clogging per season, resulting in USD 80 per hectare in additional maintenance costs. Filtration helps, but it requires routine backwashing, which smallholders often skip. Chlorination tackles bio-clogging yet introduces safety issues and pump corrosion. Poorly maintained systems underperform, undermining grower confidence and repeat sales. Manufacturers are deploying self-flushing designs and herbicide-impregnated laterals, however, these upgrades cost 15–20% more, which slows adoption in price-sensitive tiers of the micro irrigation systems market.
*Our forecasts treat driver/restraint impacts as directional, not additive. The impact forecasts reflect baseline growth, mix effects, and variable interactions.
Segment Analysis
By Irrigation Type: Subsurface Systems Gain Permanent-Crop Favor
Drip technology accounted for about 55% of the 2025 revenue in the micro irrigation systems market, supported by its versatility across row crops, orchards, and vegetables. Subsurface drip irrigation outpaces all categories at a 9% CAGR through 2031, spurred by permanent-crop growers who value evaporation cuts and reduced equipment traffic. In 2025, a University of California trial reported 22% lower evapotranspiration in subsurface-drip almonds, resulting in a savings of 180 m³ per hectare. Although subsurface installation adds USD 300–500 per hectare, lower upkeep and 15-year lifespans tip the cost-benefit in favor of buried tape. Policy levers amplify the shift as California’s Sustainable Groundwater Management Act ties pumping caps to proven water efficiency. Meanwhile, Israel mandates subsurface systems in new Negev orchards, pairing loans with technical assistance. This steady regulatory drumbeat solidifies subsurface drip as a best-practice standard, expanding its share of the micro irrigation systems market.
Surface micro-sprinklers remain key in citrus, avocado, and frost-prone orchards, but their growth is hindered due to higher evaporation rates. Bubbler irrigation is primarily used in nurseries and public landscapes, yielding modest volumes. Nonetheless, innovation continues as Valmont’s 2024 low-pressure tape operates at just 4–6 psi, appealing to Midwest corn and soybean growers facing energy-price volatility.


By Component: Controllers and Sensors Drive Digital Transition
Controllers and sensors are projected to grow the fastest at an 11.2% CAGR through 2031, reflecting a shift from hardware sales to data services. Drippers and emitters dominate the market, accounting for 34% of revenue, due to their pressure-compensating and anti-siphon designs, which are essential for uniform discharge across slopes. Tubing faces intense price pressure from Chinese extrusion lines, prompting high-end suppliers to shift toward UV-stabilized, premium products. Filters and fertigation systems perform optimally where water quality issues and nutrient regulations intersect, particularly in high-intensity vegetable production areas. Pumps, valves, and accessories complete the system architecture, with energy-efficient upgrades capturing an incremental share.
Digitization economics resonate across farm sizes. A 200-hectare Spanish tomato complex recouped its USD 45,000 sensor retrofit investment in 18 months by reducing water usage by 14%, fertilizer usage by 10%, and labor costs by 87%. As capacitance probes drop below USD 80 and IoT modules under USD 50, cooperative buying circles in India and Africa pool equipment to share data. Vendors now subsidize sensors to lock customers into subscription dashboards, increasing customer lifetime value in the micro irrigation systems industry.
By Crop Type: Vegetables Accelerate Amid Protected-Cultivation Boom
Field crops accounted for 40% of 2025 revenue, led by conversions of cotton, sugarcane, and maize. However, vegetables are estimated to expand at an 8.4% CAGR through 2031 as protected cultivation proliferates in North Africa, the Middle East, and Southeast Asia. Morocco added 15,000 hectares of greenhouses between 2023 and 2025 under Plan Maroc Vert, nearly all of which are equipped with drip irrigation systems for exporting tomatoes. Saudi Arabia’s National Agricultural Development Company commissioned 8,000 hectares of controlled-environment vegetable units using desalinated water. Greenhouse tomatoes yield 400–500 metric tons per hectare, compared to 80–100 metric tons in open fields, thereby boosting the return on investment. Adjacent vertical farms and hydroponic systems create new demand for micro-tubing and fertigation pumps tailored to recirculating loops, widening product scope within the micro irrigation systems market.
Orchards and vineyards show stable mid-single-digit growth through sensor retrofits and subsurface upgrades. Plantation crops, such as oil palm and coffee, exhibit a gradual uptake, constrained by fragmented ownership. Turf and ornamental landscaping experience incremental growth where municipal water restrictions drive drip adoption, particularly in southwest United States and Australia.
By End User: Greenhouses Lead Controlled-Environment Surge
Large commercial farms accounted for 52% of 2025 revenue, benefiting from economies of scale and technical capacity. Smallholders number in the millions but account for a smaller share of the micro irrigation systems market size because per-hectare spending is lower and often subsidy-dependent.
Greenhouses are projected to be the fastest-growing end user, with a 10.5% CAGR through 2031. The Netherlands operates 10,000 hectares of high-tech glasshouses with drip-fertigation yields topping 600 metric tons per hectare in tomatoes, a model now exported to China and the Gulf states. Cannabis legalization in North America catalyzes additional greenhouse builds, each relying on drip to meet the crop’s high water and nutrient needs. Recirculating fertigation, which captures drainage for reuse, bolsters compliance with European nitrate limits, adding value and complexity to system design. Landscape and turf customers utilize drip irrigation to reduce maintenance visits and comply with drought ordinances, particularly on golf courses in the Arabian Peninsula.
Geography Analysis
The Asia-Pacific region contributed 45% of the 2025 revenue and remains the anchor of the micro irrigation systems market. India aims to equip 10 million hectares with micro-irrigation by 2026, supported by federal and state subsidies that cover up to 55% of the costs. China invested CNY 20 billion (USD 2.8 billion) to expand coverage in the Yellow River and Tarim River basins, countering groundwater depletion. Domestic manufacturers, such as Jain Irrigation and Chinadrip, supply cost-competitive components, ensuring local service networks and spare part availability. Japan, South Korea, and Australia post high penetration but smaller absolute volumes due to limited arable land.
The Middle East is projected to post a 9% CAGR through 2031, the fastest worldwide. Saudi Arabia’s Vision 2030 targets domestic vegetable output and offers 50% capital subsidies, while the United Arab Emirates aims for a 50% rise in local food production under its Food Security Strategy 2051. Israel exports subsurface drip know-how to neighbors under regional water-sharing agreements, elevating the innovation baseline. High salinity in desalinated water accelerates emitter wear, but research centers in Riyadh and Tel Aviv are trialing corrosion-resistant polymers.
Europe is expanding at a high growth rate as Spain, Italy, and Greece retrofit vineyards and olive groves to comply with the Common Agricultural Policy's water-efficiency metrics. Germany and France invest in protected horticulture to mitigate labor costs and nitrate runoff. North America is experiencing significant growth, led by California and Arizona, where groundwater regulations are tightening. South America posts a strong growth, fueled by conversions in Brazilian sugarcane and Argentine coffee. Africa’s growth is driven by donor-funded smallholder kits in Kenya, Ethiopia, and Senegal, yet penetration remains low, indicating untapped potential for the micro irrigation systems market.

Competitive Landscape
The top five suppliers, Netafim Ltd. (Orbia Advance Corporation), Rivulis Irrigation Ltd. (Temasek Holdings), The Toro Company, Rain Bird Corporation, and Hunter Industries, captured a major share of 2025 revenue, confirming moderate concentration. Israeli firms command premium pricing due to decades of research and development (R&D) focused on pressure-compensating emitters. Indian and Chinese competitors win government tenders on price and customizability. Hardware commoditization is driving all players to integrate digital layers. Netafim offers the NetBeat platform. In 2025, The Toro Company acquired AgriTech Innovations for machine-learning scheduling, and Rivulis bundles remote diagnostics into its T-Net service tier.
White-space battles are unfolding in sub-Saharan Africa and Southeast Asia. Vendors deploy pay-as-you-go financing and mobile money integration to break affordability barriers, extending their reach beyond traditional dealer networks. N-Drip’s gravity-fed system eliminates pumps and filtration, gaining traction in off-grid regions and challenging incumbents designed for pressurized lines.
Regulatory compliance differentiates established brands in Europe and North America, where plastic take-back mandates and ISO-9261 uniformity standards raise entry barriers. In December 2025, Hunter Industries’ ISO 9001 certification in Mexico, for instance, improved its position for EU tenders. Patent intensity is shifting toward digital intelligence, with filings for machine-learning irrigation schedulers and self-cleaning emitters climbing in 2025. This evolving landscape underscores the race to secure recurring software revenue streams inside the micro irrigation systems market.
Micro-Irrigation Systems Industry Leaders
The Toro Company
Netafim Ltd. (Orbia Advance Corporation)
Rivulis Irrigation Ltd. (Temasek Holdings)
Rain Bird Corporation
Hunter Industries
- *Disclaimer: Major Players sorted in no particular order

Recent Industry Developments
- November 2025: Mahindra EPC Secures USD 0.22 Million Community Micro-Irrigation Project in India for the Development of a Pressurized Micro-Irrigation System.
- September 2025: Rivulis opened a new micro-irrigation factory in North America to shorten lead times and meet regional demand. This investment strengthens Rivulis' market position following its acquisition of Jain Irrigation's international business, creating an integrated global player with enhanced capabilities across multiple product categories.
- February 2025: Netafim launched its patented Hybrid Dripline system, combining integral and on-line drippers to provide a leak-free, labor-saving solution for greenhouses, orchards, and vineyards, thereby reducing installation time and improving efficiency.


Research Methodology Framework and Report Scope
Market Definitions and Key Coverage
Our study defines the global micro-irrigation systems market as the sale of new drip lines, micro-sprinklers, bubblers, foggers, pressure regulators, filters, valves, controllers, and associated tubing that deliver low-pressure, low-volume water straight to crop root zones in open-field and protected-cultivation settings.
Scope exclusion: Large mechanized pivots, flood-irrigation hardware, and standalone fertigation tanks are excluded.
Segmentation Overview
- By Irrigation Type
- Drip Irrigation
- Micro-sprinkler Irrigation
- Subsurface Drip Irrigation
- Bubbler Irrigation
- By Component
- Drippers and Emitters
- Tubing and Drip Lines
- Filters and Fertigation Systems
- Valves and Pressure Regulators
- Controllers and Sensors
- Pumps and Accessories
- By Crop Type
- Field Crops
- Orchard and Vineyards
- Plantation Crops
- Vegetables
- Turf and Ornamental
- By End User
- Smallholder Farms
- Large Commercial Farms
- Greenhouses
- Landscape and Turf
- Others
- By Geography
- North America
- United States
- Canada
- Rest of North America
- South America
- Brazil
- Argentina
- Rest of South America
- Europe
- Germany
- France
- Italy
- Spain
- Russia
- Rest of Europe
- Asia-Pacific
- China
- India
- Japan
- Australia
- South Korea
- Rest of Asia-Pacific
- Middle East
- Saudi Arabia
- United Arab Emirates
- Rest of Middle East
- Africa
- South Africa
- Egypt
- Rest of Africa
- North America
Detailed Research Methodology and Data Validation
Primary Research
Our analysts interviewed input distributors, irrigation engineers, subsidy officers, and grower associations across Asia-Pacific, North America, and the Mediterranean. These conversations clarified system lifecycles, channel margins, and average selling prices; they guided assumption ranges and stress-tested early model outputs.
Desk Research
We began with public datasets on irrigated acreage, water productivity, and farm mechanization collected by bodies such as FAO AQUASTAT, USDA National Agricultural Statistics Service, Eurostat, and India's Ministry of Jal Shakti. Trade flows from UN Comtrade and tariff books helped spot regional demand spikes. Company 10-Ks, investor decks, and patent filings revealed pricing shifts and innovation cues. Subscription tools, for example, D&B Hoovers for supplier revenues and Questel for emitter patents, filled important gaps. According to Mordor Intelligence, the sources named are illustrative, and many additional references were reviewed.
Market-Sizing & Forecasting
A top-down reconstruction links irrigated hectares by crop with observed micro-irrigation penetration and average system spend. Selective bottom-up roll-ups of manufacturer disclosures and channel checks provide cross-checks and adjustment levers. Key variables include subsidy disbursement rates, drip-line replacement cycles, cropping-mix shifts toward orchards and vegetables, and regional water-pricing trends. Forecasts through 2030 rely on multivariate regression that pairs these drivers with agricultural GDP and rainfall anomalies; they are validated by expert consensus when variance exceeds preset bands. Data gaps in bottom-up estimates are bridged using median ASPs from triangulated purchase orders.
Data Validation & Update Cycle
Before sign-off, every output passes a two-step analyst review, variance tests against historical ratios, and anomaly flags that trigger re-engagement with primary contacts. The study is refreshed each year and updated mid-cycle if policy or drought events materially alter the baseline.
Why Mordor's Micro-Irrigation Systems Baseline Commands Reliability
Published market figures often diverge because each firm sets its own scope, input mix, and currency treatment.
We acknowledge those differences upfront.
Benchmark comparison
| Market Size | Anonymized source | Primary gap driver |
|---|---|---|
| USD 3.80 B (2025) | Mordor Intelligence | |
| USD 13.90 B (2024) | Global Consultancy A | Includes mechanized pivots and retrofit parts; values installed base. |
| USD 12.40 B (2024) | Global Consultancy B | Uses broad irrigation accessories, constant 2022 FX, and no primary price checks. |
The comparison shows that Mordor's disciplined scoping, annual refresh, and dual-mode validation give decision-makers a balanced, transparent baseline that stays tightly anchored to measurable purchasing activity and evolving subsidy traction.


Key Questions Answered in the Report
What is the anticipated value of the micro irrigation systems market in 2031?
It is forecast to approach USD 22.5 billion by 2031, growing at a 7% CAGR from 2026 levels.
Which region will expand fastest through 2031?
The Middle East will post the highest regional CAGR at 9% as Gulf nations pair desalination with precision farming.
Why are controllers and sensors the fastest-growing component?
Prices of soil-moisture probes and IoT modules have fallen sharply, and growers seek data-driven scheduling that reduces labor and input costs.
How do subsidies influence adoption?
Programs in India, China, and Saudi Arabia cover up to 55% of system costs, shortening payback periods and making drip viable for smallholders.
What is the main technical barrier for small farmers?
High upfront capital of USD 1,200–1,800 per hectare and limited access to affordable credit delay investment among holdings under 2 hectares.
How is plastic waste from drip lines being addressed?
European regulations push manufacturers toward take-back schemes, and pilots like Netafim’s Spain program recycle used lines into non-food products.
Page last updated on:


