
Ad Tech Market Size and Share
Market Overview
| Study Period | 2020 - 2031 |
|---|---|
| Market Size (2026) | USD 0.99 Trillion |
| Market Size (2031) | USD 1.59 Trillion |
| Growth Rate (2026 - 2031) | 10.05 % |
| Fastest Growing Market | Asia Pacific |
| Largest Market | North America |
| Market Concentration | Medium |
Major Players *Disclaimer: Major Players sorted in no particular order Image © Mordor Intelligence. Reuse requires attribution under CC BY 4.0. | |
Ad Tech Market Analysis by Mordor Intelligence
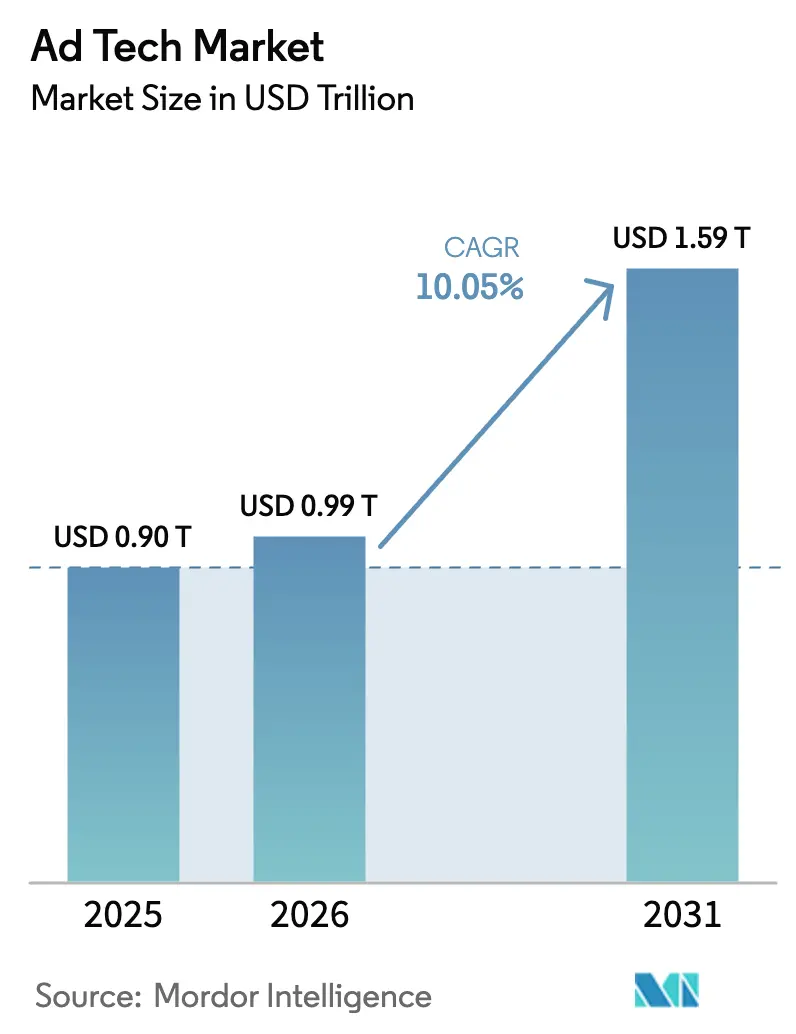
The advertising tech market size was valued at USD 0.898 trillion in 2025 and estimated to grow from USD 0.99 trillion in 2026 to reach USD 1.59 trillion by 2031, at a CAGR of 10.05% during the forecast period (2026-2031). The acceleration reflects enduring demand for privacy-compliant programmatic tools, sharp growth in connected-television (CTV) budgets, and large-scale monetisation of retail first-party data. Artificial-intelligence optimisation continues to compress media-buying cycles, while 5G roll-outs in Asia-Pacific unlock high-definition mobile video inventory. Growing scrutiny of opaque supply paths is prompting fee rationalisation across demand-side platforms, and the shortage of data-engineering talent gives well-funded technology vendors a structural edge. Persistent regulatory action in Europe is simultaneously restricting cross-device identifiers and nurturing contextual alternatives, giving rise to a more diversified competitive field.
Key Report Takeaways
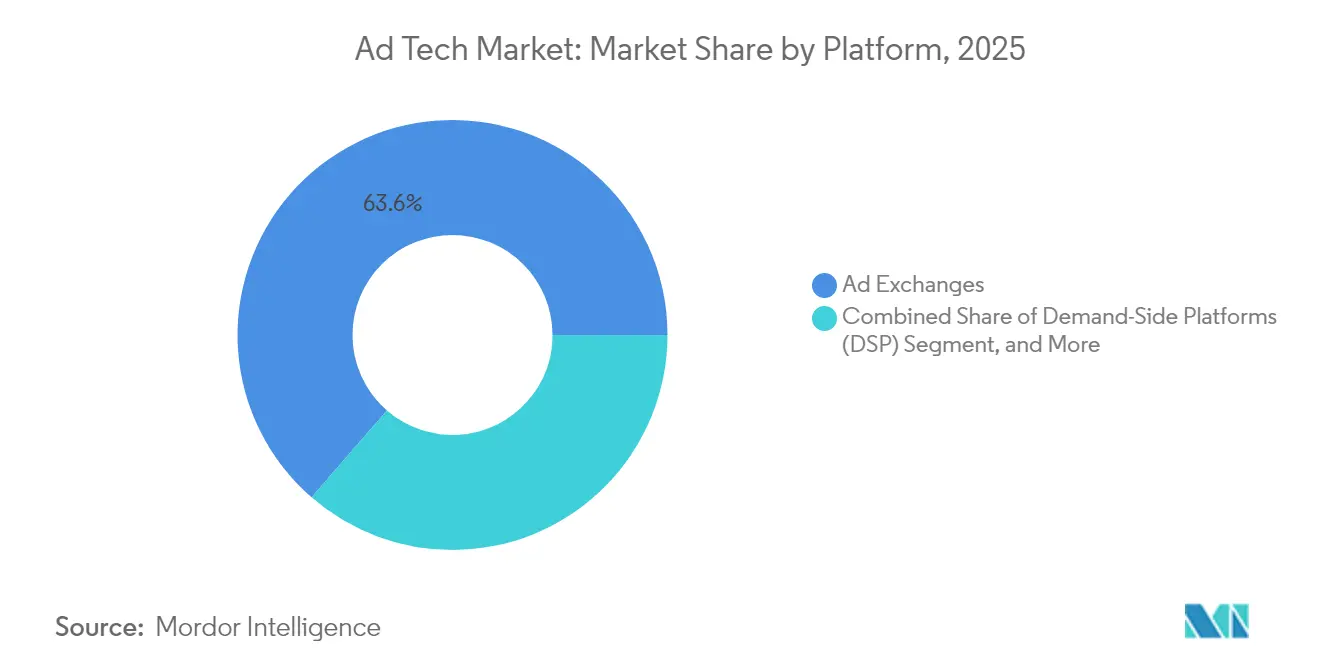
- By platform, Ad Exchanges led with 63.62% of advertising tech market share in 2025; Demand-Side Platforms posted the highest CAGR at 12.08% through 2031.
- By ad format, search advertising held 38.15% revenue share in 2025, while the same category is projected to expand at a 11.92% CAGR to 2031.
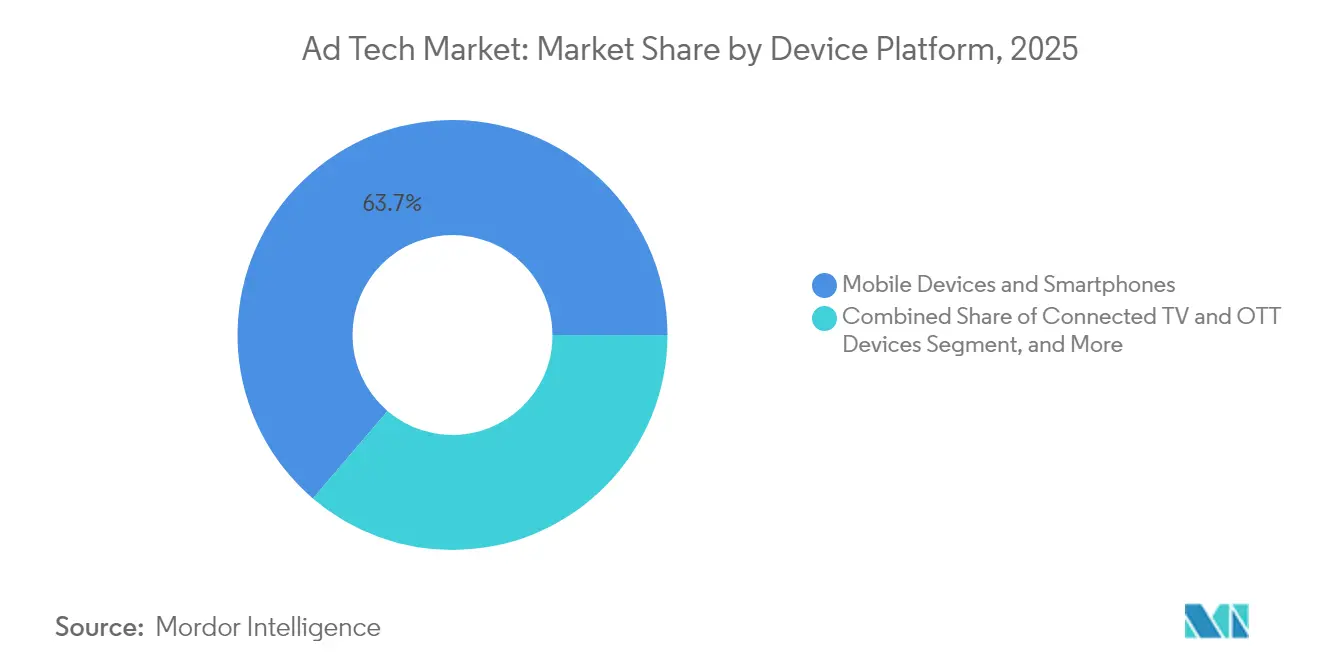
- By device, smartphones accounted for 63.75% of the advertising tech market size in 2025; the “other devices” segment, including smart speakers and wearables, is advancing at a 13.74% CAGR.
- By end-user industry, services represented 51.45% of 2025 spending, whereas telecommunications is forecast to record the fastest 13.88% CAGR.
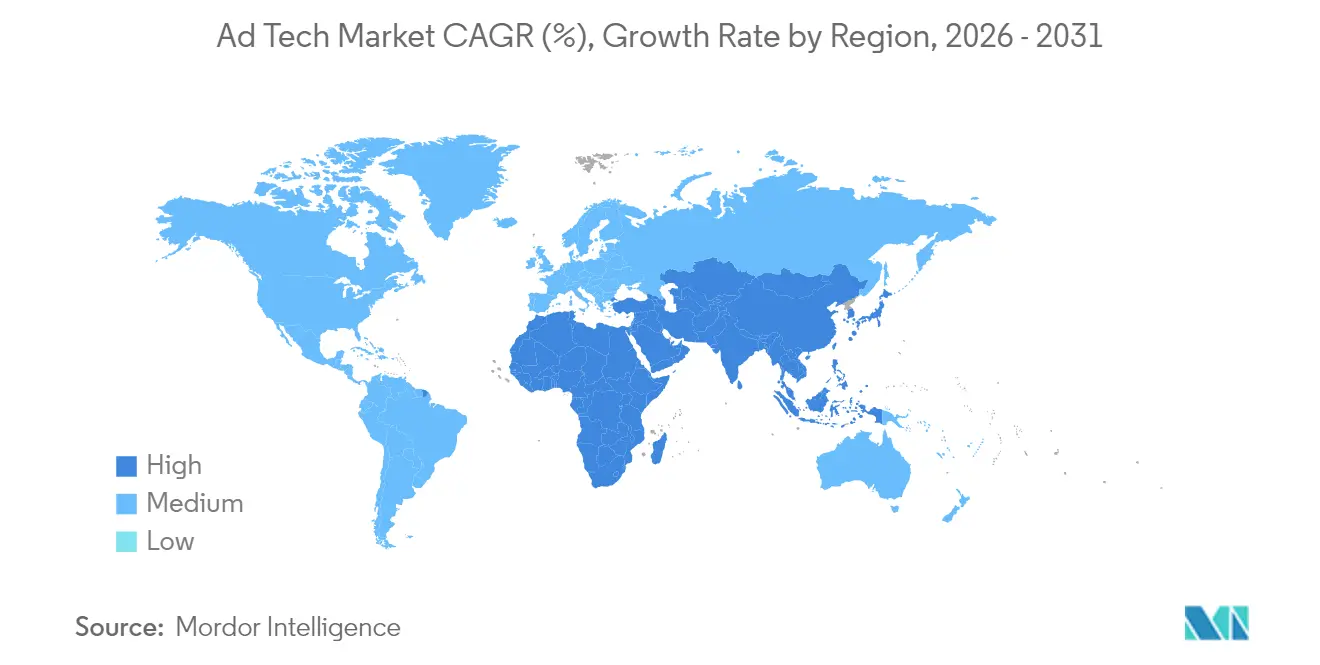
- By geography, North America controlled 40.12% of 2025 revenue, yet Asia-Pacific is set to grow at a 12.16% CAGR through 2031.
Note: Market size and forecast figures in this report are generated using Mordor Intelligence’s proprietary estimation framework, updated with the latest available data and insights as of 2026.
Market Trends and Insights
Drivers Impact Analysis of Ad Tech Market*
| Driver | (~) % Impact on CAGR Forecast | Geographic Relevance | Impact Timeline |
|---|---|---|---|
| CTV-led programmatic surge | +2.1% | North America, global spill-over | Medium term (2-4 years) |
| Deprecation of third-party cookies | +1.8% | Global, early EU adoption | Short term (≤ 2 years) |
| AI-driven dynamic creative optimisation | +1.5% | Global, led by North America & APAC | Medium term (2-4 years) |
| Retail-media monetisation of first-party data | +1.4% | Global, strongest in North America | Long term (≥ 4 years) |
| 5G roll-outs enabling rich mobile video ads | +1.2% | APAC core, spill-over to MEA | Medium term (2-4 years) |
| GDPR-style regulations fuelling contextual targeting | +0.9% | Europe, expanding to Global | Long term (≥ 4 years) |
| Source: Mordor Intelligence | |||
CTV-led programmatic surge
Streaming publishers are shifting inventory from direct insertion orders to open auctions, and programmatic CTV now attracts 17% of total brand budgets. The Trade Desk’s Ventura operating system improves frequency capping and audience reach for buyers while lowering publisher tech spend. Convergence with retail-media datasets delivers deterministic attribution that ties viewership to purchases. Over 95% of surveyed advertisers plan to maintain or expand CTV allocations, highlighting resilient demand even amid economic volatility. Platforms with unified ID frameworks gain priority access to premium video placements, which in turn accelerates supply-path optimisation across the advertising tech market.
Third-party-cookie deprecation
Chrome’s phased withdrawal of cookies and the EU’s consent string ruling are accelerating migration to first-party identifiers. Google’s Privacy Sandbox faces yield gaps of up to 33% for publishers during early testing phases.[1]Google, “Frequently Asked Questions Related to Third-Party Cookie Deprecation in Chrome,” google.com Marketers are therefore increasing contextual targeting budgets and adopting clean-room integrations that retain addressability without personal identifiers. Retailers with authenticated transaction data benefit from surging advertiser interest, while smaller publishers exploit semantic-signal models to preserve CPMs. Customer-data-platform deployments have become standard practice for omni-channel brands aiming to future-proof activation workflows.
AI-driven dynamic creative optimisation
Distributed learning algorithms can adapt copy and creative to individual auction contexts in milliseconds, driving double-digit lifts in return on ad spend. Meta has outlined plans to automate the full creative cycle by 2026. The Trade Desk’s Kokai platform pushes predictive clearing logic that continuously reallocates bids toward impressions demonstrating better predicted outcomes. Early adopters report 25% improvements in relevance scores on large retail-media networks. As generative agents become commonplace, future advertising placements are likely to be negotiated directly between brand and consumer AIs, relegating manual optimisation to legacy status.
Retail-media monetisation of first-party data
Retailers are converting high-margin advertising services into core profit pools, with spending expected to exceed USD 100 billion globally by 2027. Amazon alone generated USD 46.9 billion in advertising revenue during 2024, ranking third among digital platforms.[2]Amazon, “Amazon Unveils Simplified Product Launch, Optimisation, and Measurement Solutions,” amazon.com Onsite ad units deliver 70%-90% gross margins and are extending into off-site ecosystems through clean-room collaborations. Standardised attribution frameworks from the IAB now underpin large supermarket networks, improving comparability and attracting incremental brand budgets. Integration with CTV environments closes the loop on omnichannel measurement, driving sustained tailwinds for the advertising tech market.
Restraints Impact Analysis of Ad Tech Market*
| Restraint | (~) % Impact on CAGR Forecast | Geographic Relevance | Impact Timeline |
|---|---|---|---|
| Global privacy laws limiting cross-device graphs | -1.3% | Global, strongest in EU | Short term (≤ 2 years) |
| Rising sophistication of ad-fraud | -0.8% | Emerging markets, global spread | Medium term (2-4 years) |
| Supply-path complexity elevating transparency costs | -0.6% | Global, acute in North America | Short term (≤ 2 years) |
| Acute data-engineering talent shortages | -0.5% | Global, most severe in North America & EU | Long term (≥ 4 years) |
| Source: Mordor Intelligence | |||
Global privacy laws limiting cross-device graphs
The March 2024 Court of Justice ruling classifies consent strings as personal data, making IAB Europe a joint controller and raising compliance burdens across the supply chain. New obligations under the Digital Markets Act demand clear opt-ins for every data use, eroding performance of cross-device identifiers. Gatekeeper platforms must provide click-level transparency, shifting competitive advantage toward privacy-native contextual solutions. Many large advertisers have capped EU retargeting spend and diverted incremental funds to curated marketplaces, diminishing short-term growth potential in the advertising tech market.
Rising sophistication of ad-fraud
Global fraud losses stood at USD 84 billion in 2023 and are forecast to double by 2028. DoubleVerify logs a 23% rise in new schemes targeting CTV inventory, where higher CPMs amplify pay-off for fraudsters.[3]MediaPost, “DoubleVerify: Generative AI Driving Increase in Ad Fraud,” mediapost.com Generative-AI botnets increasingly mimic human scroll and click patterns, making pattern-based detection harder. Residential IP obfuscation tools provide further cover, raising verification costs. Advertisers that lack unified brand-safety protocols experience up to 17% fraudulent impression rates, directly suppressing effective campaign reach and increasing working-media dilution.
*Our forecasts treat driver/restraint impacts as directional, not additive. The impact forecasts reflect baseline growth, mix effects, and variable interactions.
Ad Tech Market Segment Analysis
By Platform:
Programmatic tools recalibrate buying economicsAd Exchanges delivered 63.62% of 2025 spend, anchoring liquidity across open auctions. Demand-Side Platforms, while smaller, are growing at 12.08% annually as buyers prefer automated optimisations that cut operational overheads. The advertising tech market size captured by DSPs is projected to widen materially through 2031 as enterprise advertisers migrate bulk budgets into self-serve workflows. Amazon’s DSP already accounts for almost one-third of the retailer’s ad turnovers, underscoring the synergies of commerce data with programmatic bidding.
Supply-Side Platforms respond by deepening supply-path optimisation, with PubMatic funnelling more than half of traded impressions through preferential pipes that carry reduced take-rates. Smaller data-management-platform vendors lose relevance when third-party cookies vanish and are either shuttered or absorbed by larger stacks. Microsoft’s planned exit from stand-alone DSP operations illustrates the capital intensity required to keep pace with machine-learning innovation. As competitive barriers climb, platform consolidation is expected, compressing the long-tail provider base inside the advertising tech market.



By Ad Format:
Search retains scale while video acceleratesSearch captured 38.15% of revenue in 2025 and is still expanding at a 11.92% CAGR, leveraging AI-driven multimodal query interpretation to surface commerce-adjacent results. Video formats, buoyed by CTV and mobile apps, siphon incremental brand dollars away from static display. Social media growth is flattening due to tighter content policies, particularly within sensitive health and financial categories.
In-game and augmented-reality placements are embryonic yet show high engagement, attracting exploratory budgets from consumer-electronics brands. Email remains resilient thanks to authenticated data sets that circumvent identifier restrictions. Google’s Gemini platform is expected to embed native search ads into conversational responses, creating fresh inventory pools without disrupting user intent. The advertising tech market continues to evolve from banner impressions toward experience-centric formats that promise measurable outcomes across immersive environments.
By Device Platform:
Smartphones dominate, ambient endpoints emergeMobile devices generated 63.75% of spend in 2025 and will retain the top position through 2031 as 5G services deepen video penetration. Desktop impressions trend marginally downward, reflecting workplace mobility and changing content-consumption patterns. Connected-TV devices benefit from rapid cord-cutting in North America and growing subscription uptake in Asia-Pacific, offering lean-back, brand-safe canvases.
Smart speakers and wearables collectively grow at a 13.74% CAGR, introducing voice and haptic touchpoints that challenge traditional creative workflows. Cross-device measurement is complicated by privacy constraints, prompting the rise of probabilistic modelling within the advertising tech market. Platforms with unified clean-room integrations are therefore best placed to deliver incremental reach without breaching consent frameworks.
By End-user Industry:
Diversification widens the demand baseServices industries captured 51.45% of 2025 budgets, driven by banking, insurance, and professional-services firms competing for digitally native customers. Telecommunications operators are the fastest risers at a 13.88% CAGR as spectrum owners emulate hyperscalers by monetising subscriber graphs. Retail and e-commerce brands expand allocations through onsite sponsored products and off-site display retargeting supported by clean rooms.
Healthcare advertising is cautiously rebalancing creative strategies after large platforms introduced granular limitations on health-condition targeting. Automotive manufacturers pivot messaging toward electric-vehicle benefits, while education providers adapt campaigns to rising online-learning demand. The advertising tech market benefits from this broadening vertical mix, which insulates total spend from cyclical shocks in any single sector.
Geography Analysis
North America Ad Tech Market
North America retained 40.12% of 2025 turnover, supported by mature infrastructure, deep advertiser sophistication, and robust CTV adoption that lifted streaming spend to USD 30.1 billion. Large retail-media networks and advanced identity frameworks reinforce the region’s primacy, even as emerging state privacy statutes add compliance friction. Technology vendors headquartered in the United States account for the majority of intellectual-property filings and attract the bulk of venture funding, further entrenching leadership within the advertising tech market.
APAC Ad Tech Market
Asia-Pacific is the fastest-growing territory at a 12.16% CAGR, propelled by mobile-first consumer behaviour, accelerated 5G coverage, and surging e-commerce activity. GSMA estimates mobile technology contributed USD 880 billion to regional GDP in 2023, with a USD 1 trillion forecast for 2030. China’s super-app ecosystems integrate payments, social, and content, creating blueprints that advertisers in India, Indonesia, and Vietnam are now adopting. Regulatory approaches remain heterogeneous, but most jurisdictions continue to encourage foreign investment in digital media, sustaining long-term momentum for the advertising tech market.
EMEA and South America Ad Tech Market
Europe shows moderate growth as comprehensive privacy laws squeeze cross-device targeting but encourage innovation in contextual and cohort-based models. Retail-media spending is projected to reach EUR 25 billion by 2026 on the back of harmonised measurement protocols. South America and the Middle East and Africa represent early-stage adoption curves characterised by improving broadband penetration and rising local content production. Programmatic spend in South America climbed from USD 5.2 billion in 2017 to USD 16.8 billion in 2023, while the MENA region’s digital advertising outlay is on track to quintuple between 2022 and 2025. These trends confirm a broadening global footprint for the advertising tech market.

Regulatory Landscape
Ad tech regulation is increasingly shaped by privacy enforcement, competition remedies, and supply-chain transparency rules across major regions. In Europe, enforcement of the EU Digital Markets Act (DMA) has intensified, including actions that require gatekeepers to adjust data-access and ad-market conduct, and measures compelling Google to share anonymized search data with rivals. The March 2024 Court of Justice of the European Union ruling that treats consent strings as personal data (and assigns IAB Europe joint-controller responsibilities) continues to raise compliance expectations for consent and downstream processing across programmatic buying.
In the United Kingdom, the Competition and Markets Authority is pursuing conduct requirements for Google under the Digital Markets, Competition and Consumers Act 2024, expanding scrutiny over search and search advertising practices and data portability. In the United States, state privacy laws are increasing operational obligations for targeting and measurement-related data flows; the California Delete Act introduces the Delete Request and Opt-out Platform (DROP), with data brokers required to process requests through it from August 1, 2026. Industry bodies are also pushing technical standards to reduce opacity, with IAB Tech Lab releasing SupplyChain v1.1 in June 2026 to map technical custody in programmatic supply paths.
Competitive Landscape
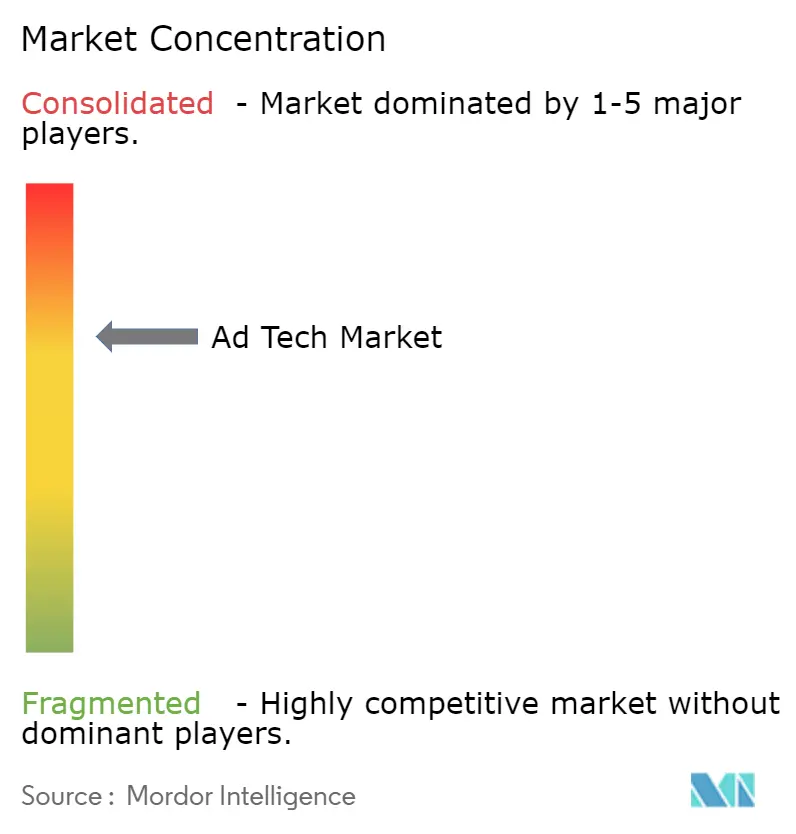
Despite ongoing consolidation, the advertising tech market remains moderately fragmented. Oracle’s 2024 exit erased a USD 1.7 billion revenue stream and opened white-space for agile independents. Major deals-Outbrain’s USD 1 billion purchase of Teads, Mediaocean’s USD 500 million Innovid buy, and Equativ’s merger with Sharethrough-highlight the strategic value of vertical integration and differentiated data assets. Technology giants such as Google, Meta, and Amazon retain scale advantages through native user bases and control over key operating-system layers.
Independent platforms differentiate on transparency and privacy leadership. The Trade Desk continues to out-invest peers in machine learning, evidenced by its Kokai and Ventura releases, and maintains open-internet partnerships that bypass walled gardens. Supply-side players prioritise supply-path optimisation to defend publisher yields, while omnichannel measurement providers seek interoperability with retail-media networks. Regulatory pressure intensifies competition around consent-management expertise, prompting traditional agencies to partner with specialised tech vendors to fill capability gaps.
The acute shortage of programmatic engineers amplifies barriers to entry. Larger firms offer superior compensation and remote-work flexibility, draining talent from mid-tier agencies and slowing their roadmap delivery. As AI agents take over manual optimisation, vendors that control proprietary algorithms and authenticated data stand to outpace rivals. The ongoing realignment suggests that by 2030 the advertising tech market will feature a handful of scaled full-stack operators complemented by a layer of vertical specialists focused on identity, creative automation, and outcome-based measurement.
Ad Tech Industry Leaders
Google LLC
Amazon.com, Inc.
Meta Platform, Inc.
Quantcast
Adobe
- *Disclaimer: Major Players sorted in no particular order
Ad Tech Market Companies Covered in this Report
- Alphabet Inc.
- Meta Platforms, Inc.
- Amazon.com, Inc.
- The Trade Desk, Inc.
- Microsoft Corporation
- Adobe Inc.
- Yahoo Inc. (Owned by Apollo Global Management)
- Magnite, Inc.
- PubMatic, Inc.
- Criteo S.A.
- Oracle Corporation
- Index Exchange Inc.
- MediaMath Inc.
- InMobi Pte. Ltd.
- AppLovin Corporation
- Zeta Global Holdings Corp.
- Adform A/S
- Quantcast Corporation
- Rakuten Group, Inc.
- IronSource Ltd. (Merged with Unity Software Inc.)
- StackAdapt Inc.
- Xandr Inc. (Acquired by Microsoft)
- Mediaocean LLC
- OpenX

Market Opportunities and Future Outlook
Cookie deprecation, stricter consent interpretations, and competition remedies are lifting demand for privacy-forward addressability and measurement, which creates room for first-party identity solutions, clean-room collaboration, and contextual tooling that can work without cross-device identifiers. The March 2024 CJEU consent-string decision and ongoing EU DMA enforcement are driving advertisers and intermediaries to re-architect data handling, and this raises the value of vendors that can package consent, governance, and activation into deployable stacks for global campaigns. Retail media remains a key monetization channel because it pairs authenticated shopper data with closed-loop outcomes, and it is increasingly linking into offsite programmatic activation through clean-room style integrations.
Programmatic transparency and supply-path optimization are the second major opportunity area as buyers press intermediaries to justify fees and reduce fraud exposure, particularly in premium CTV inventory. IAB Tech Lab's SupplyChain v1.1 (June 2026) supports this shift by enabling tracking of technical custody across bid requests, including servers, SDKs, and SSAI platforms, which can be used to standardize audits and curate supply routes. At the same time, execution is moving toward agentic AI inside ad platforms and workflow tools, reducing manual setup and compressing optimization cycles; IAB highlighted agentic AI moving from experimentation to execution across planning and activation, and its 2026 outlook points to stronger momentum in channels central to ad tech, including connected TV and commerce media.
Recent Industry Developments in Ad Tech Market
- July 2026: Google launched transparency features including a How this ad was made panel in My Ad Center, indicating if generative AI was used to create or edit an advertisement. It broadens disclosure practices for AI-assisted ads and increases advertiser accountability. The update points to continued momentum on regulatory conformity and consumer trust in AI enhanced campaigns.
- July 2026: Google launched a Gemini-powered AI agent, Business Agent for Leads, within Search ads in India to facilitate direct interaction between users and brands. The AI agent supports search-based lead generation and targets faster engagement in a high-growth market. The rollout could shape competitive dynamics in AI-enabled ad agents across regional markets.
- July 2026: Agentio (via PRNewswire) announced an advertising integration partnership with Meta, enabling brands to launch automated creator-partnership ads across Instagram and Facebook. The collaboration expands cross-platform ad creation and monetization through automated creator workflows. It also broadens data and creative automation capabilities across major social networks.


Ad Tech Market Report Scope and Research Methodology
Market Definition and Coverage
For this study, the ad tech market is defined as the technology and related services used to plan, buy, sell, deliver, and measure digital advertising, across formats and devices, and across major end user industries.
Scope exclusions: Pure offline advertising activities and non-digital media placements are excluded from this market sizing.
Segments Covered in This Report
- By Platform
- Demand-Side Platforms (DSP)
- Supply-Side Platforms (SSP)
- Ad Exchanges
- Data Management Platforms (DMP)
- Others
- By Ad Format
- Search Advertising
- Display/Banner
- Video Advertising
- Social Media
- Others
- By Device Platform
- Mobile Devices and Smartphones
- Desktop and Laptop
- Connected TV and OTT Devices
- Other Devices (Smart Speakers, Wearables)
- By End-user Industry
- Retail and E-commerce
- BFSI
- Healthcare and Pharmaceuticals
- Media and Entertainment
- IT and Telecommunications
- Services
- Automotive
- Education
- Others
- By Geography
- North America
- United States
- Canada
- Mexico
- South America
- Brazil
- Argentina
- Rest of South America
- Europe
- Germany
- United Kingdom
- France
- Italy
- Spain
- Rest of Europe
- Asia-Pacific
- China
- Japan
- South Korea
- India
- Australia
- Rest of Asia-Pacific
- Middle East
- United Arab Emirates
- Saudi Arabia
- Rest of Middle East
- Africa
- South Africa
- Rest of Africa
- North America
Data Sources, Market Sizing, and Validation
Desk Research
Desk research starts with building a clean fact base on digital advertising activity, policy direction, and measurable demand signals, which are then used to ground our assumptions. We typically rely on public sources such as IAB and similar trade bodies, regulator publications on privacy and advertising rules (such as FTC and European Commission materials), and government statistics that help interpret internet and device usage patterns (such as OECD and World Bank indicators).
On the supply side, we also review company filings, earnings transcripts, investor decks, and credible press coverage to map which ad tech segments are growing and what is driving that change. Where it is useful, paid subscriptions are used for company financials and intelligence, news and financials, and patent databases, mainly to verify timelines, product direction, and investment intensity. This desk list is illustrative only, and many other sources were also referenced for data collection, validation, and clarification.
Primary Interviews and Surveys
Primary work is used to pressure test what we see in desk research, especially around pricing logic, adoption speed, and how budgets move between channels like CTV, mobile, and desktop. We speak with a mix of demand side and supply side experts, including platform operators, publishers, agencies, and measurement focused roles, across major regions so that regional differences in regulation and buying behavior are not missed.
Distribution of primary research fieldwork respondents
| Company type | Respondent position | Region |
|---|---|---|
| Top tier: 32% | CXOs: 17% | APAC: 46% |
| Mid tier: 47% | Functional/Unit leaders: 36% | EMEA: 33% |
| Smaller Players: 21% | Managers: 47% | Americas: 21% |
Market-Sizing & Forecasting
Sizing is built using a top-down and bottom-up blend, where the top-down path reconstructs the demand pool from digital advertising spend indicators and then allocates it into ad tech activity using platform penetration and channel mix checks. Once those totals are formed, selective bottom-up approximations are used as a reality check, such as sampled revenue per impression logic, channel checks on take rates where applicable, and cross checks against publicly discussed revenue mixes.
Key inputs in the model include shifts in programmatic adoption, connected TV and OTT budget expansion, mobile share of digital time spent, changes in privacy and identifier availability, and the pace of retail media monetization. Because these drivers do not move in a straight line each year, forecasting is done using scenario analysis supported by trend smoothing on key variables, which are then reviewed against what industry participants expect for budget growth and pricing. When bottom-up views do not cover smaller geographies or niche formats, gaps are handled through calibrated ratios tied to device and format shares, followed by a final consistency pass.
Data Validation & Update Cycle
Outputs are triangulated across multiple checks, so totals are compared against independent signals like digital ad revenue growth, device and format mix trends, and published policy changes that can impact targeting and measurement. Variances are reviewed in steps, starting with input sanity checks, followed by peer review of assumptions, and then a final model audit before sign off.
The report is refreshed annually, and interim updates are triggered when material events occur, such as major privacy enforcement actions or sharp shifts in ad budgets. Before delivery, we do a fresh pass on the latest public releases and interview feedback so clients receive the most current view that can be traced back to clear assumptions.
Mordor Intelligence's Ad Tech Market Size Compared With Other Published Estimates
Published numbers for ad tech often do not line up because the underlying definitions are not consistent, and because some sources mix media spend with technology and service layers. Timing also matters since some estimates are refreshed more frequently, and others use different currency conversion points that can move large totals.
Offline media budgets sit outside Mordor Intelligence's scope here, which is one practical reason totals can look higher in estimates that fold traditional advertising into a broader "ad industry" value. Differences also come from whether CTV and OTT are counted as part of the same delivery stack, how programmatic share is applied to digital spend, and whether aggressive growth assumptions are used for retail media monetization without interview validation.
Benchmark comparison
| Source | Market Size | Gaps in Research Methodology |
|---|---|---|
| Mordor Intelligence | USD 0.90 T (2025) | |
| Industry Association A | USD 0.26 T (2024) | This figure reflects US internet advertising revenue, so geography is narrower and it is closer to media revenue reporting than a global ad tech value chain build. |
| Trade Journal B | USD 0.13 T (2025) | This type of estimate is often limited to programmatic transaction value in selected formats, which can exclude non-programmatic buying and adjacent enablement tools that still contribute to ad tech spending. |
Taken together, the spread is mostly explained by what is being counted and where it is being counted, rather than simple math differences. By keeping the scope tied to digital advertising technology activity, and then checking the totals against spend signals and expert feedback, the final number stays traceable and repeatable for planning.


Key Questions Answered in the Report
What is the current size of the advertising tech market?
The advertising tech market stood at USD 988.25 billion in 2026 and is forecast to pass USD 1.59 trillion by 2031.
Which region is growing the fastest?
Asia-Pacific leads growth with a 12.16% CAGR through 2031, fuelled by 5G adoption and mobile-first consumer behaviour.
Why are Demand-Side Platforms expanding quickly?
DSPs automate media buying, reducing manual workload and improving bidding efficiency, which drives their 12.08% CAGR.
How are privacy regulations affecting ad-tech?
New laws limit cross-device tracking and force platforms to adopt first-party and contextual approaches, trimming short-term growth but spurring innovation.
What role does retail media play in future growth?
Retail media networks monetise authenticated shopper data and are on track to exceed USD 100 billion in global spend by 2027, adding long-term momentum to the sector.
How significant is ad-fraud to overall spend?
Fraud absorbed USD 84 billion in 2023 and threatens to double by 2028, prompting rising demand for verification and brand-safety solutions within the advertising tech market.
Page last updated on:




