Outdoor Advertising Market Size and Share
Market Overview
| Study Period | 2020 - 2031 |
|---|---|
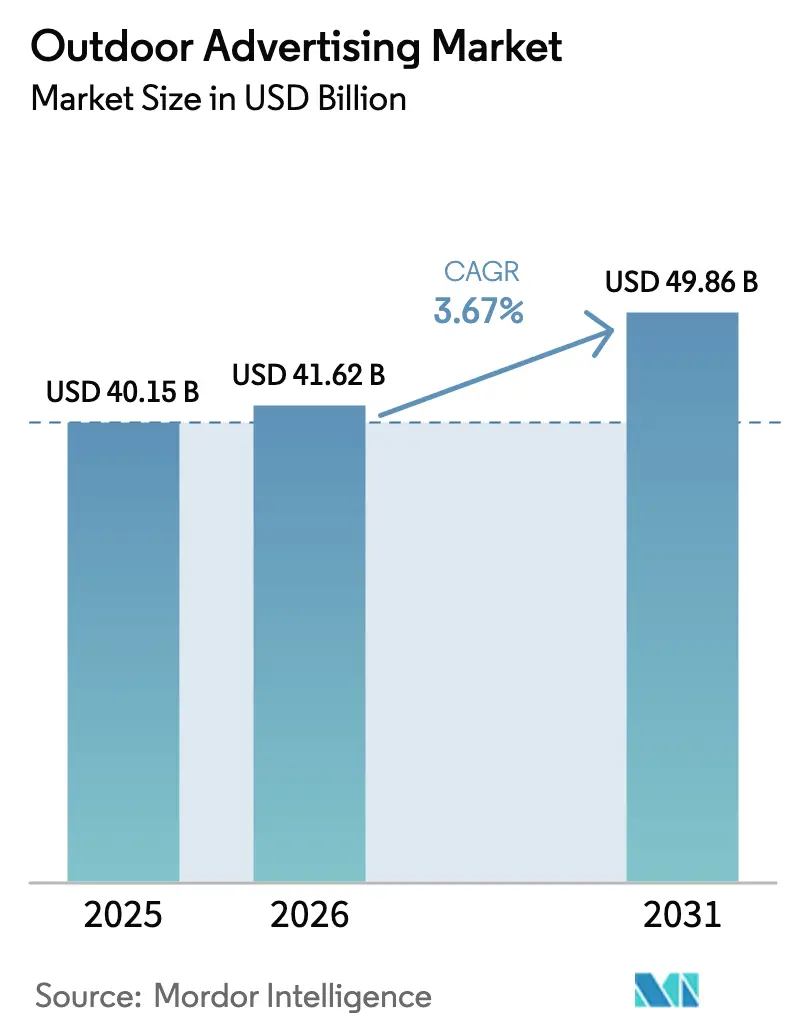
| Market Size (2026) | USD 41.62 Billion |
| Market Size (2031) | USD 49.86 Billion |
| Growth Rate (2026 - 2031) | 3.67% CAGR |
| Fastest Growing Market | Asia Pacific |
| Largest Market | North America |
| Market Concentration | Medium |
Major Players *Disclaimer: Major Players sorted in no particular order Image © Mordor Intelligence. Reuse requires attribution under CC BY 4.0. | |
Outdoor Advertising Market Analysis by Mordor Intelligence
The outdoor advertising market size was valued at USD 40.15 billion in 2025 and estimated to grow from USD 41.62 billion in 2026 to reach USD 49.86 billion by 2031, at a CAGR of 3.67% during the forecast period (2026-2031). Growth reflects steady spending in mature regions, faster digital roll-outs in emerging cities, and the channel’s value as a privacy-compliant complement to online media in a post-cookie world. Operators are converting static inventory into programmatic digital formats that support real-time bidding and audience-based buying; this improves yield and narrows performance gaps with mobile and CTV. North America remains the highest-revenue territory, supported by relaxed permitting in several U.S. states and continued capital outlays by leading landlords. Asia-Pacific delivers the quickest expansion as rapid urbanization and 5G connectivity shorten payback periods for new screens. Advertisers from retail and fast-moving consumer goods continue to anchor demand, while healthcare brands supply the fastest incremental budgets amid pharmacy-clinic roll-outs. On the supply side, telecom and software firms are entering through acquisitions that bring data, cloud, and analytics skills into a historically location-centric business.
Key Report Takeaways
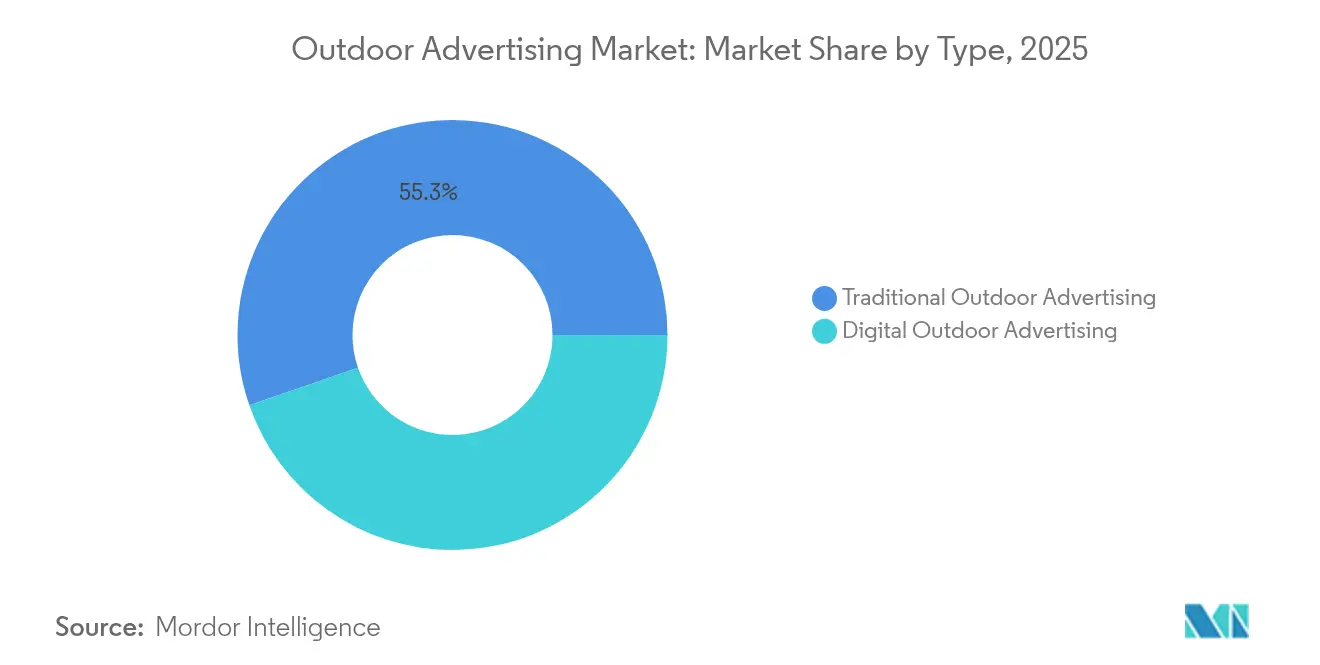
- By type, traditional formats led with 55.30% revenue share in 2025 while digital posted the highest 5.71% CAGR to 2031.
- By service, billboards captured 36.60% of outdoor advertising market share in 2025; transit advertising is projected to expand at a 5.88% CAGR through 2031.
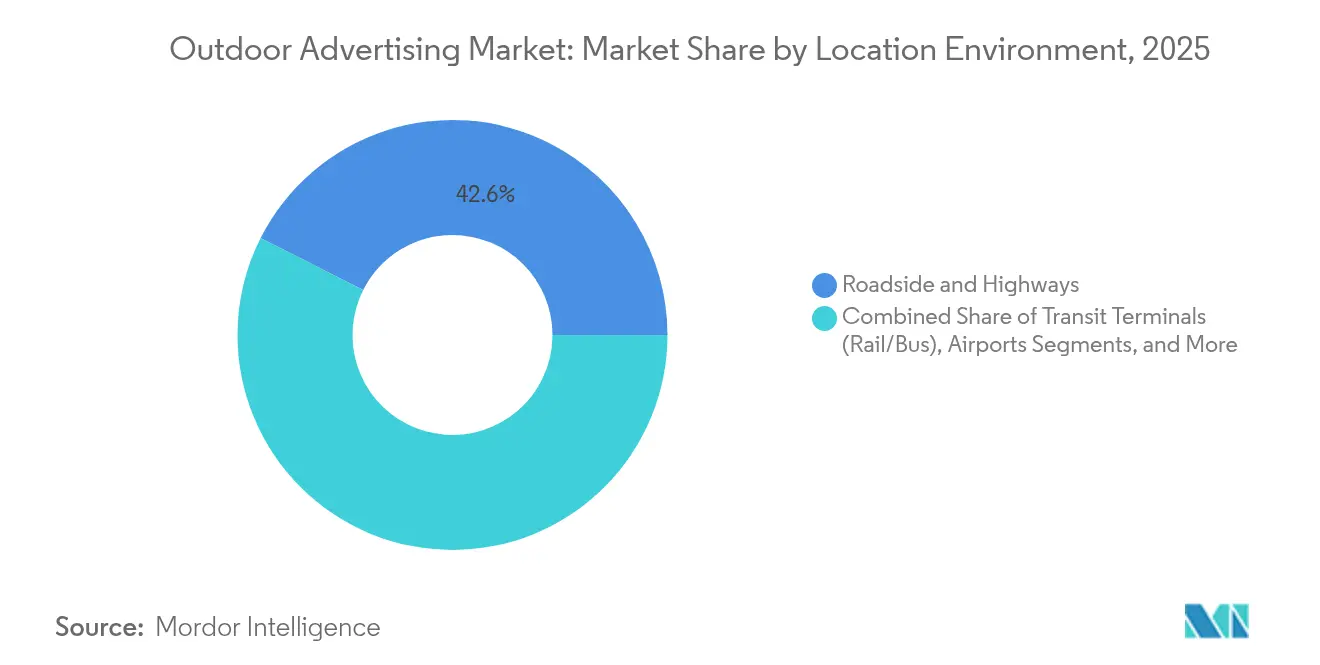
- By location environment, roadside units accounted for 42.55% of the outdoor advertising market size in 2025, whereas airport media is advancing at a 7.19% CAGR to 2031.
- By end user, retail and FMCG commanded 28.10% of 2025 spend; healthcare and pharmaceuticals record the strongest 5.08% CAGR to 2031.
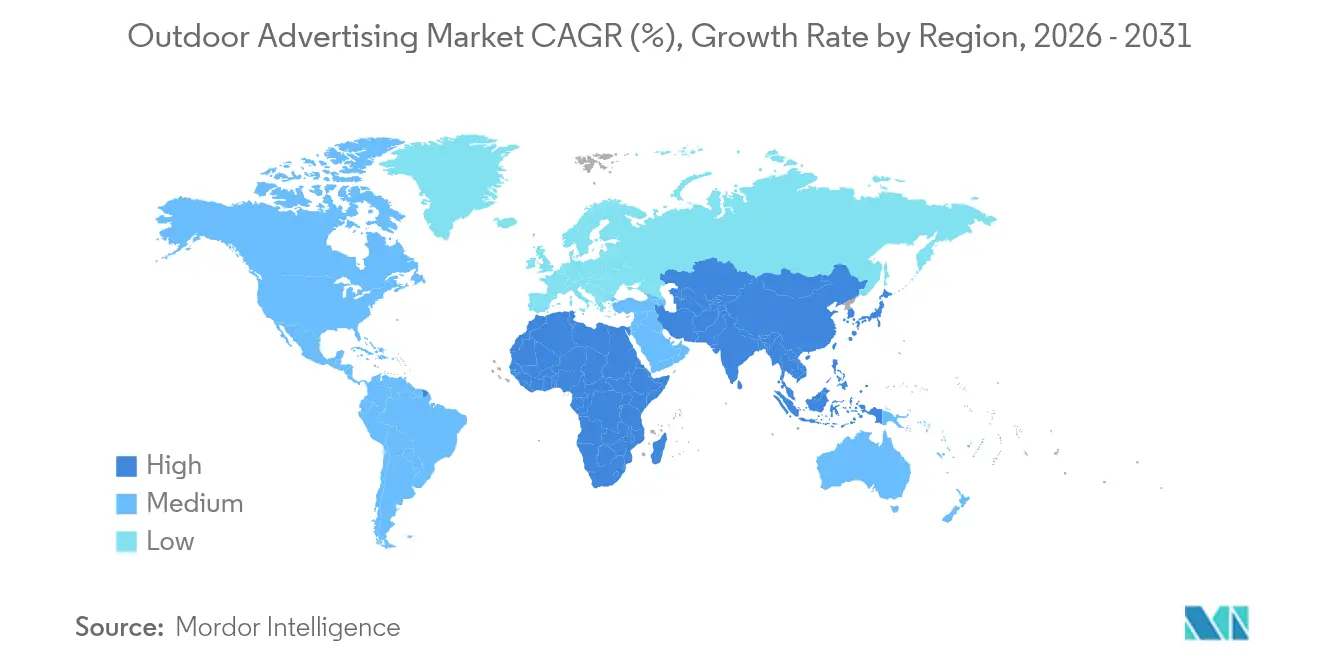
- By geography, North America represented 34.70% of 2025 revenue, while Asia-Pacific is forecast to grow the fastest at 5.18% CAGR through 2031.
Note: Market size and forecast figures in this report are generated using Mordor Intelligence’s proprietary estimation framework, updated with the latest available data and insights as of 2026.
Global Outdoor Advertising Market Trends and Insights
Drivers Impact Analysis*
| Driver | (~) % Impact on CAGR Forecast | Geographic Relevance | Impact Timeline |
|---|---|---|---|
| Rapid expansion of programmatic DOOH networks in urban transit hubs | +1.2% | Global, with concentration in North America & APAC | Medium term (2-4 years) |
| Integration of real-time data & AI for dynamic content targeting | +0.8% | Global, led by North America & Europe | Medium term (2-4 years) |
| Retail media networks leveraging outdoor screens for omnichannel attribution | +0.6% | North America & Europe, expanding to APAC | Short term (≤ 2 years) |
| 5G roll-out enabling high-definition dynamic creative in roadside digital billboards | +0.5% | APAC core, spill-over to North America & Europe | Long term (≥ 4 years) |
| Regulatory relaxation for digital billboards in key U.S. states & Chinese tier-1 cities | +0.4% | North America & China | Short term (≤ 2 years) |
| Surge in OOH spend by direct-to-consumer brands seeking post-cookie reach | +0.9% | Global, concentrated in North America & Europe | Short term (≤ 2 years) |
| Source: Mordor Intelligence | |||
Rapid Expansion of Programmatic DOOH Networks in Urban Transit Hubs
Programmatic pipes give advertisers immediate access to rail, bus, and airport screens that used to be sold via long lead times. JCDecaux now trades inventory at 15 international airports through a single supply-side platform that reaches more than 3,000 screens and tens of millions of passengers each month.[1]JCDecaux SE, “H1 2024 Results,” jcdecaux.com Transit’s predictable footfall allows dynamic triggers such as flight arrival data or weekday commuter peaks, lifting fill rates and CPMs. Agencies benefit from unified reporting that aligns transit impressions with mobile retargeting. Operators, in turn, lock in multi-year concessions because transit authorities value the incremental rent stream funded by automated demand.
Integration of Real-time Data & AI for Dynamic Content Targeting
Cloud-based CMS suites pull weather, traffic, and point-of-sale signals to refresh copy within seconds, shifting outdoor from fixed-flight rotations to adaptive storytelling. Computer-vision and machine-learning models forecast audience composition by hour, enabling advertisers to swap creatives when specific cohorts are most present. AI also reduces trafficking time by automating copy versioning across thousands of slots. As a result, outdoor delivers addressability without harvesting personal identifiers, a feature that resonates with privacy-focused marketers.
Retail Media Networks Leveraging Outdoor Screens for Omnichannel Attribution
Large retailers combine first-party loyalty data with exposure logs from adjacent roadside or mall displays to create closed-loop performance reports. CVS Health now packages billboard impressions inside its enterprise media platform, allowing packaged-goods brands to compare store-level sales lift against in-app push messages.[2]CVS Health Corp., “Form 10-K,” sec.gov The Interactive Advertising Bureau has codified a DOOH measurement framework that aligns impression delivery, geographic proximity, and transaction outcomes, simplifying budget shifts from paid-social to street-level screens.[3]Interactive Advertising Bureau, “Digital Out of Home & In-Store Retail Media Playbook 2024,” iab.com
5G Roll-out Enabling High-Definition Dynamic Creative in Roadside Digital Billboards
Low-latency networks stream 4K content and interactive experiences to roadside LED panels without buffering. Telecom carriers view DOOH as a premium video surface for their edge-cloud services; the acquisition of Vistar Media by T-Mobile injects mobile-grade targeting and billing systems into the outdoor advertising market. Energy-efficient screens further reduce operating expenses, encouraging landlords to replace static boards even in markets with strict sustainability mandates.
Restraints Impact Analysis*
| Restraint | (~) % Impact on CAGR Forecast | Geographic Relevance | Impact Timeline |
|---|---|---|---|
| Visual-pollution ordinances limiting new billboard permits in Europe | −0.7% | Europe, with spill-over to North America | Long term (≥ 4 years) |
| Fragmented measurement standards hindering cross-media attribution | −0.5% | Global | Medium term (2-4 years) |
| Rising programmatic ad fraud & brand-safety concerns in DOOH exchanges | −0.3% | Global, concentrated in programmatic markets | Short term (≤ 2 years) |
| Source: Mordor Intelligence | |||
Visual-Pollution Ordinances Limiting New Billboard Permits in Europe
Municipal rules that cap signage density protect heritage skylines but restrict new inventory pipelines. Recent legislation in New York that bans digital billboards near affordable-housing co-ops shows the trend moving across the Atlantic.[4]Scenic America, “New Law to Ban Digital Billboards Near New York Affordable Housing Co-Ops,” scenic.org Academic reviews list outdoor displays among top contributors to urban ‘visual clutter’, reinforcing policymakers’ resolve to curb expansion. Operators must therefore rely on upgrading existing faces rather than building greenfield sites, slowing topline growth.
Fragmented Measurement Standards Hindering Cross-Media Attribution
Advertisers want a single KPI that equates an impression on a roadside LED with a five-second social video view. While individual vendors such as Nielsen have demonstrated sales-lift models for select brands, no cross-publisher baseline yet exists. Absent consensus, agencies hesitate to commit incremental budget because performance cannot be benchmarked against other channels at scale. The industry is working toward unified taxonomies, but adoption will take several years.
*Our forecasts treat driver/restraint impacts as directional, not additive. The impact forecasts reflect baseline growth, mix effects, and variable interactions.
Segment Analysis
By Type: Digital Transformation Accelerates Despite Traditional Dominance
In 2025, static posters and painted boards retained 55.30% of outdoor advertising market revenue, reflecting decades of installed inventory and long-term real-estate leases. The outdoor advertising market size attached to digital units, however, is expanding 5.71% per year to 2031 as landlords retrofit road-facing structures with LED technology that commands higher occupancy and flexible daypart pricing.
Digital-first operators profit from programmatic demand, real-time copy changes, and advanced proof-of-play logs validated by third-party servers. Static formats still appeal to brand owners seeking multi-week visibility in landmark corridors where regulations hinder video. The coexistence ensures that the outdoor advertising market keeps a balanced mix of reach and precision.


By Service: Billboards Lead While Transit Capitalizes on Urban Mobility
Billboards generated 36.60% of service-level revenue in 2025, grounding the outdoor advertising market in a recognisable format trusted for national launches and local branding. Commuter hubs are now the acceleration engine; transit units are projected to grow at 5.88% CAGR as city governments modernize rail and bus assets with digital screens connected to automated trading pipes.
Audience predictability inside stations and vehicles allows agencies to align flight schedules with commuting peaks, improving cost per thousand. Billboards remain vital whenever advertisers require constant roadside presence across long stretches of highway, but transit’s rising share diversifies the channel portfolio.
By Location Environment: Roadside Dominance Faces Airport Innovation
Roadside installations commanded 42.55% of 2025 revenue, indicating that drivers and passengers represent the broadest daily reach. Airports, though, post the strongest 7.19% CAGR because passenger profiles skew affluent and dwell times remain above 60 minutes, ideal for extended storytelling. The outdoor advertising market share of premium travel hubs is therefore set to climb through 2031.
Operators secure decade-long concessions that hedge economic cycles and enable large-screen upgrades funded by guaranteed ad minimums. Roadside remains indispensable for mass awareness, yet airports deliver margin expansion thanks to higher CPMs and tenancy fees from luxury, finance, and technology advertisers.
By End User: Retail Leadership Meets Healthcare Innovation
Retail and FMCG brands spent 28.10% of total outlays in 2025, relying on nationwide coverage to reinforce in-store promotions and e-commerce pushes within the same viewable journey. Healthcare and pharmaceutical budgets show the swiftest 5.08% CAGR as consumer-centric models drive clinic footfall and over-the-counter product launches.
Outdoor formats around pharmacies and hospitals benefit from geofenced attribution that links message exposure to prescription redemption or appointment bookings. Automotive, financial services, and media executives maintain sizeable allocations, but growth headroom lies in health services as population aging and preventive-care awareness rise.
Geography Analysis
North America contributed 34.70% of 2025 revenue, underpinned by a dense interstate network, relaxed rules in several states, and strong programmatic adoption. Major operators concentrate capital on digital retrofits because real-time auctions lift yields without expanding footprint caps. Direct-to-consumer challengers have shifted budgets aggressively from paid social toward outdoor, a pivot enabled by deterministic footfall attribution supplied by telecom carriers.
Asia-Pacific represents the fastest-moving arena at a 5.18% CAGR to 2031. Rapid urbanization in China, India, and Indonesia yields new mass-transit corridors that come pre-fitted with digital panels. Capital expenditure is further justified by 5G coverage and a mobile-first consumer base, turning street furniture into extensions of the in-app ecosystem. National governments encourage eco-friendly LED replacements that reduce energy draw, improving project approval odds.
Europe faces stricter heritage-protection statutes that curb new-site supply, yet high advertising rates in major capitals sustain profitability. Operators invest in measurement frameworks that convert existing faces into verified digital slots, aiming to protect share against online video. Latin America and the Middle East & Africa contribute a smaller slice but present untapped corridors where economic expansion and retail construction will unlock fresh concession bids.

Competitive Landscape
Global leadership rests with JCDecaux, Clear Channel Outdoor, Lamar Advertising, and Outfront Media, yet the data stack is now the main battleground. JCDecaux lifted programmatic revenue 63.5% in 2024 to EUR 100.2 million, proving that supply-side innovation can unlock new buyer cohorts. Clear Channel divested non-core markets for USD 745 million to fund U.S. digitization and airport upgrades that promise higher margins.
Telecom and cloud entrants now shape the outdoor advertising market. T-Mobile’s USD 600 million acquisition of Vistar Media embeds DOOH pipes inside a nationwide 5G network, linking ad calls to deterministic mobility data. Retailers such as CVS Health and grocery chains are building owned networks that compete for local budgets while driving ancillary income.
Fragmentation persists in secondary cities and niche venues where independent landlords hold permits; however, rising compliance costs and buyer demand for verified impressions push smaller players toward SSP alliances or outright sales. Technology-rich specialists that supply CMS, audience analytics, and energy-efficient hardware are consolidating as platform owners seek vertical integration.
Outdoor Advertising Industry Leaders
JCDecaux
Clear Channel Outdoor Holdings, Inc.
Ströer SE & Co. KGaA
Lamar Advertising Company
Outfront Media Inc.
- *Disclaimer: Major Players sorted in no particular order

Recent Industry Developments
- February 2025: T-Mobile closed its USD 600 million purchase of Vistar Media to strengthen 5G-powered DOOH targeting.
- February 2025: Clear Channel Outdoor won a 10-year advertising and sponsorship contract at Austin–Bergstrom International Airport, adding a high-value travel hub to its U.S. portfolio.
- February 2025: JCDecaux activated programmatic trading across 15 global airports, enabling brands to run multi-market flights from a single console.
- October 2024: JCDecaux purchased 70% of IMC, adding 4,000 displays across six Central American countries to its Latin American footprint


Global Outdoor Advertising Market Report Scope
Outdoor advertising is any kind of advertisement that is displayed outside, usually in public areas such as roadside billboards, bus stops, train stations, and other public spaces. It can also include banners and signs hung in public areas, such as on buildings, parks, and beaches.
The outdoor advertising market is segmented by type (traditional outdoor advertising, digital outdoor advertising), by service (billboards, transit, street furniture, other services), by end-user (retail, healthcare, BFSI, media and entertainment, automotive, other end-users), by geography (North America, Europe, Asia-Pacific, Latin America, Middle East and Africa). The market sizes and forecasts are provided in terms of value (USD) for all the above segments.
| Traditional Outdoor Advertising |
| Digital Outdoor Advertising |
| Billboards |
| Transit |
| Street Furniture |
| Place-Based/Ambient |
| Roadside and Highways |
| Transit Terminals (Rail/Bus) |
| Airports |
| Shopping Malls and Retail Parks |
| Sports and Entertainment Venues |
| Other Environments |
| Retail |
| Healthcare |
| BFSI |
| Media and Entertainment |
| Automotive |
| Other End-users |
| North America | United States |
| Canada | |
| Mexico | |
| South America | Brazil |
| Argentina | |
| Rest of South America | |
| Europe | Germany |
| United Kingdom | |
| France | |
| Italy | |
| Spain | |
| Rest of Europe | |
| Asia-Pacific | China |
| Japan | |
| South Korea | |
| India | |
| Australia | |
| Rest of Asia-Pacific | |
| Middle East | United Arab Emirates |
| Saudi Arabia | |
| Rest of Middle East | |
| Africa | South Africa |
| Rest of Africa |
| By Type | Traditional Outdoor Advertising | |
| Digital Outdoor Advertising | ||
| By Service | Billboards | |
| Transit | ||
| Street Furniture | ||
| Place-Based/Ambient | ||
| By Location Environment | Roadside and Highways | |
| Transit Terminals (Rail/Bus) | ||
| Airports | ||
| Shopping Malls and Retail Parks | ||
| Sports and Entertainment Venues | ||
| Other Environments | ||
| By End-user | Retail | |
| Healthcare | ||
| BFSI | ||
| Media and Entertainment | ||
| Automotive | ||
| Other End-users | ||
| By Geography | North America | United States |
| Canada | ||
| Mexico | ||
| South America | Brazil | |
| Argentina | ||
| Rest of South America | ||
| Europe | Germany | |
| United Kingdom | ||
| France | ||
| Italy | ||
| Spain | ||
| Rest of Europe | ||
| Asia-Pacific | China | |
| Japan | ||
| South Korea | ||
| India | ||
| Australia | ||
| Rest of Asia-Pacific | ||
| Middle East | United Arab Emirates | |
| Saudi Arabia | ||
| Rest of Middle East | ||
| Africa | South Africa | |
| Rest of Africa | ||


Key Questions Answered in the Report
What is the current value of the outdoor advertising market?
The outdoor advertising market size reached USD 41.62 billion in 2026 and is projected to climb to USD 49.86 billion by 2031.
Which region holds the largest revenue share?
North America leads with 34.70% of 2025 global revenue, bolstered by digitization and favorable permitting.
Which format is growing fastest?
Digital transit screens inside rail and bus networks are expanding at a 5.88% CAGR through 2031 as programmatic pipes unlock new demand.
Why are healthcare brands increasing spend on out-of-home media?
Retail-clinic expansion and direct-to-consumer drug promotion drive a 5.08% CAGR in healthcare and pharmaceutical outlays, the highest among end users.
How is 5G changing roadside advertising?
Low-latency connectivity enables 4K video and real-time creative swaps, pushing outdoor inventory toward premium video budgets.
What is the main challenge to faster growth?
Lack of unified measurement standards limits clear cross-media ROI comparisons, tempering budget reallocations from digital and TV to out-of-home.
Page last updated on:


