TV Advertising Market Size and Share
Market Overview
| Study Period | 2020 - 2031 |
|---|---|
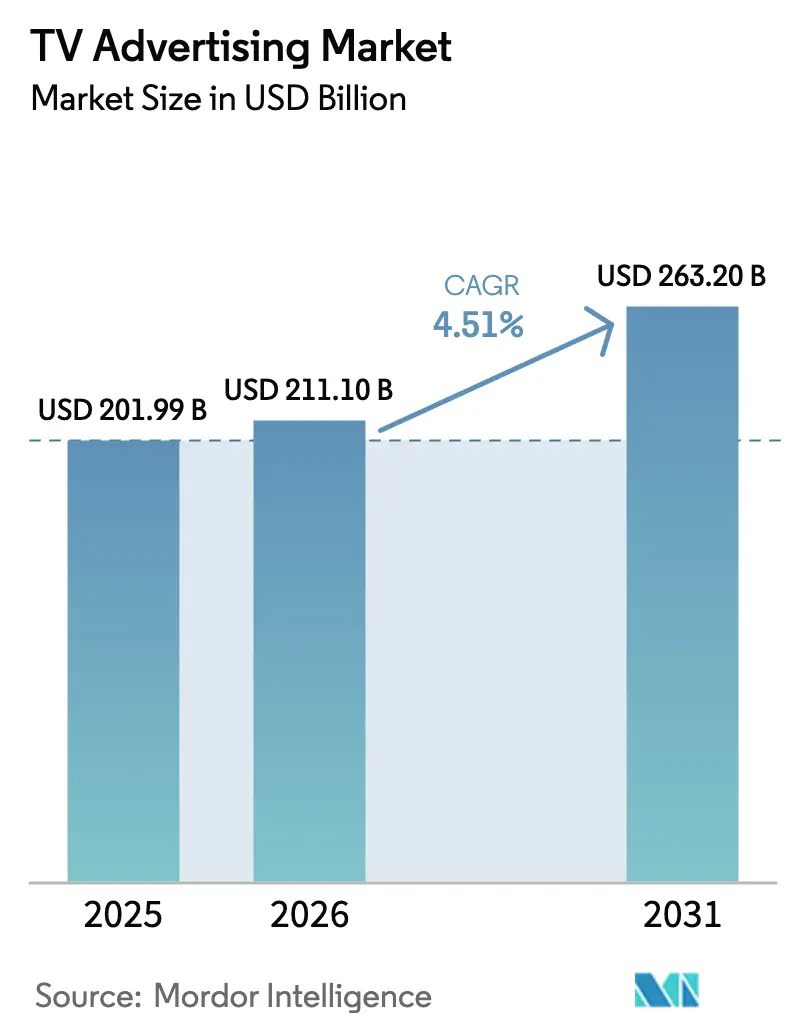
| Market Size (2026) | USD 211.1 Billion |
| Market Size (2031) | USD 263.2 Billion |
| Growth Rate (2026 - 2031) | 4.51% CAGR |
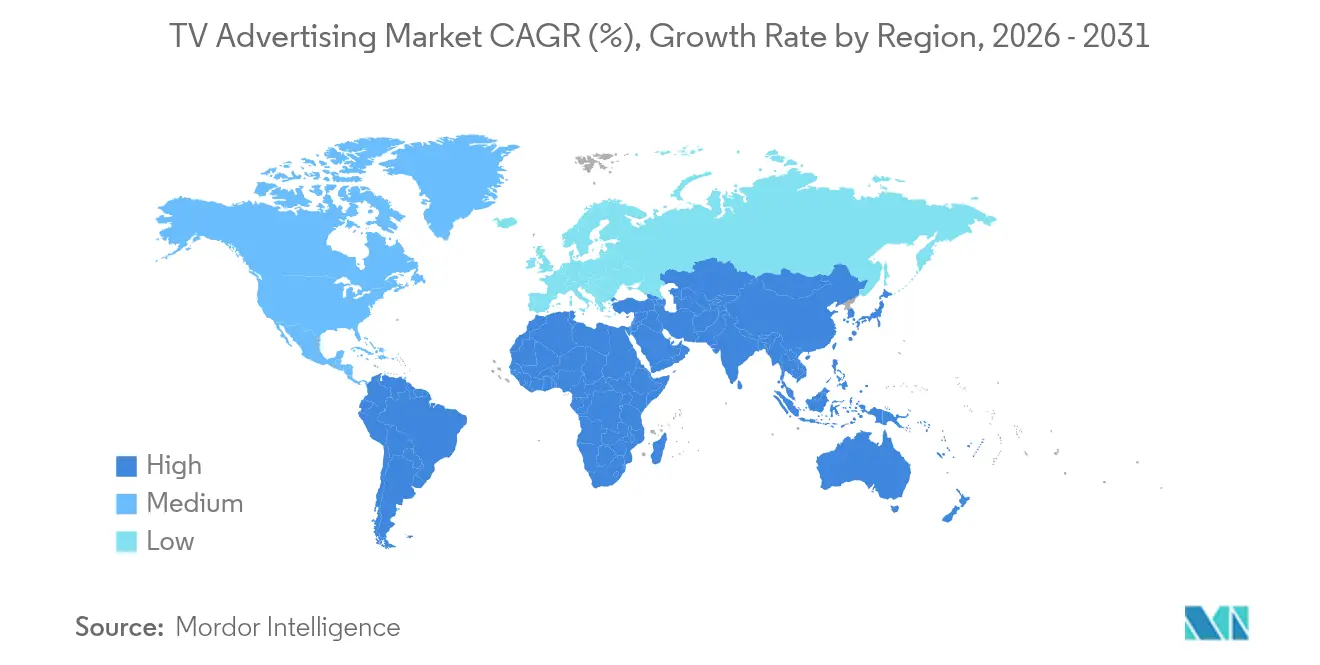
| Fastest Growing Market | Asia Pacific |
| Largest Market | North America |
| Market Concentration | Medium |
Major Players*Disclaimer: Major Players sorted in no particular order Image © Mordor Intelligence. Reuse requires attribution under CC BY 4.0. | |
TV Advertising Market Analysis by Mordor Intelligence
The TV advertising market size was valued at USD 201.99 billion in 2025 and estimated to grow from USD 211.1 billion in 2026 to reach USD 263.2 billion by 2031, at a CAGR of 4.51% during the forecast period (2026-2031). Advertiser budgets are steadily migrating from linear television toward addressable and data-driven channels as Connected TV (CTV) delivers audience targeting that mirrors digital standards. Prime-time inventory still commands premium rates, yet sponsorship and co-branding formats are expanding as brands seek content integration. Retail-media networks in Asia are introducing shoppable TV, while North American broadcasters bundle live-sports slots with sports-betting brands to unlock higher CPMs. Agency consolidation and spectrum re-allocations are reshaping reach economics, and the third-party cookie sunset hastens the move toward first-party and contextual signals.
Key Report Takeaways
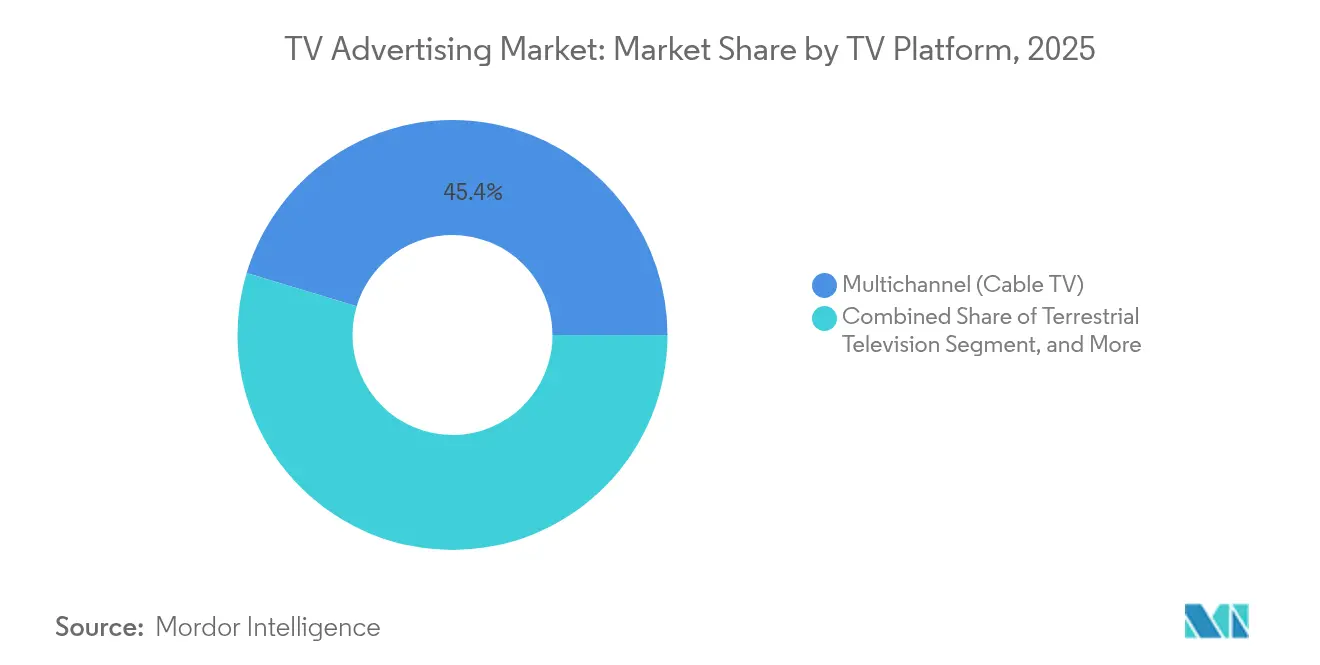
- By TV platform, multichannel cable TV led with 45.35% of TV advertising market share in 2025, whereas Connected TV is forecast to expand at a 12.52% CAGR through 2031.
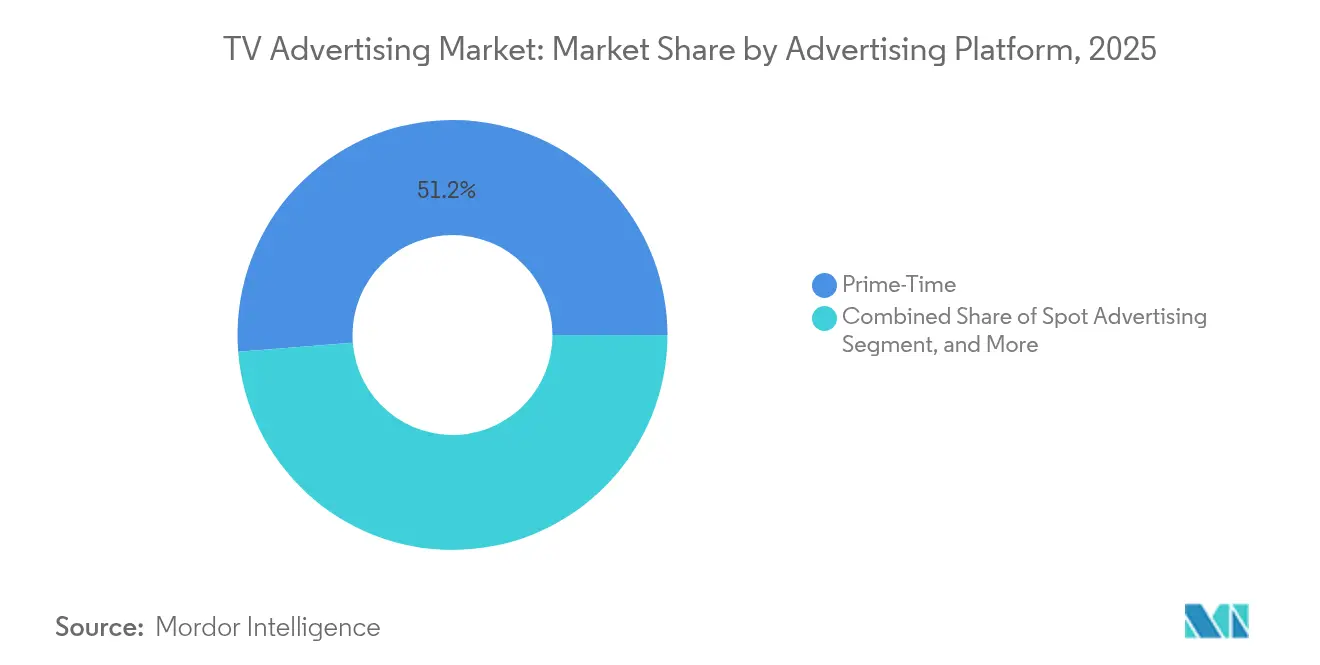
- By advertising platform, prime-time advertising held 51.25% of the TV advertising market share in 2025; sponsorships and co-branding are growing at an 8.76% CAGR to 2031.
- By end-user industry, consumer goods accounted for 27.55% share of the TV advertising market size in 2025, while technology and electronics is advancing at a 7.18% CAGR through 2031.
- By geography, North America captured 33.45% TV advertising market share in 2025, but Asia-Pacific is projected to grow at 6.07% CAGR during 2026-2031.
Note: Market size and forecast figures in this report are generated using Mordor Intelligence’s proprietary estimation framework, updated with the latest available data and insights as of 2026.
Global TV Advertising Market Trends and Insights
Drivers Impact Analysis*
| Driver | (~) % Impact on CAGR Forecast | Geographic Relevance | Impact Timeline |
|---|---|---|---|
| Brands’ shift toward CTV-first media mix | +1.20% | North America, Europe | Medium term (2-4 years) |
| Programmatic addressable TV adoption | +0.80% | Europe, APAC | Long term (≥ 4 years) |
| Retail-media demand for shoppable TV ads | +0.70% | APAC, North America | Short term (≤ 2 years) |
| Cross-screen frequency-capping tools | +0.50% | Global | Medium term (2-4 years) |
| AI-powered creative optimisation | +0.90% | Global | Short term (≤ 2 years) |
| Convergence of sports betting and live sports inventory | +0.40% | North America | Short term (≤ 2 years) |
| Source: Mordor Intelligence | |||
Brands’ Shift Toward CTV-First Media Mix
Advertisers in North America are now designing campaigns around CTV as the primary video channel instead of using it merely to extend linear reach. CTV ad spend reached USD 30.10 billion in 2024, representing 10% of total US digital outlays. Amazon and Roku jointly give brands access to 80% of US CTV households, simplifying frequency capping and improving reach efficiency. [1]Amazon Ads, “Amazon and Roku to Pool Connected-TV Audiences,” amazon.com
Programmatic Addressable TV Adoption Among European Broadcasters
Broadcasters across Europe are integrating programmatic booking tools into linear playout systems to offset falling spot revenues. Ad-supported standards certified on major TV sets enable real-time audience targeting while safeguarding brand safety, positioning local broadcasters to compete effectively with global streamers.
Retail-Media Networks’ Demand for Shoppable TV Ads in Asia
Asian retailers pair in-store data with CTV inventory to let viewers buy featured items directly from the screen, blending content and commerce. Makro’s launch of Makro Retail Media Network illustrates how omni-channel platforms convert viewing into purchase behaviour. [2]CP Axtra, “Makro Retail Media Network Launch,” cpaxtra.com
Cross-Screen Frequency-Capping Tools Boosting ROI for FMCG Advertisers
Frequency-management software now balances exposures across linear, CTV, and digital channels, cutting wasted impressions and lifting incremental reach by as much as 30% for broad-audience categories.
Restraints Impact Analysis*
| Restraint | (~) % Impact on CAGR Forecast | Geographic Relevance | Impact Timeline |
|---|---|---|---|
| Third-party cookie sunset limiting household graph scale | –0.6% | Global | Short term (≤ 2 years) |
| Linear inventory fragmentation post-spectrum repack | –0.4% | United States | Medium term (2-4 years) |
| Rising audience duplication costs on premium AVOD | –0.3% | Asia-Pacific | Medium term (2-4 years) |
| Regulator-mandated ad-load caps on children’s programming | –0.2% | Europe | Long term (≥ 4 years) |
| Source: Mordor Intelligence | |||
Third-Party Cookie Sunset Limiting Household Graph Scale
Cookie deprecation is reducing match rates for cross-device IDs from above 90% to near 60%, pushing advertisers toward first-party and contextual tools while concentrating spend in walled gardens.
Linear Inventory Fragmentation in Post-Spectrum Repack Markets (US)
The FCC’s spectrum repack altered broadcast footprints and complicated market-level reach planning, making some advertisers redirect dollars toward streaming channels with stable geo coverage. [3]Federal Communications Commission, “Incentive Auctions Spectrum Repack,” fcc.gov
*Our forecasts treat driver/restraint impacts as directional, not additive. The impact forecasts reflect baseline growth, mix effects, and variable interactions.
Segment Analysis
By TV Platform: CTV Redefines Addressable Reach
The TV advertising market size linked to Connected TV is set to grow fastest, outpacing terrestrial and satellite outlets. Multichannel cable retained 45.35% TV advertising market share in 2025, yet its position erodes as cord-cutting lifts CTV’s addressable reach. As smart-TV operating systems embed dynamic ad insertion, buyers gain linear-scale audiences coupled with digital-grade targeting. Platform pools such as the Amazon-Roku alliance aggregate impressions to maintain campaign breadth while keeping duplication in check. Advertisers thus reallocate budgets toward CTV inventories that promise deterministic measurement and brand-safe environments.
Traditional terrestrial broadcasters still capture local news and live-events spend, but their share compresses each year as younger viewers default to streaming. Satellite providers encounter the steepest churn, accelerating content unbundling and prompting strategic partnerships to syndicate inventory through connected devices. Over-the-top services anchor the long-tail of content choice, but the lion’s share of performance budgets gravitates to CTV integrations where outcome-based buying is demonstrably possible.


By Advertising Platform: Prime-Time Retains Pricing Power Amid Programmatic Surge
Prime-time slots contributed 51.25% of 2025 revenues thanks to live sports and scripted franchises that deliver co-viewing scale. However, 75% of CTV impressions already transact programmatically, and private marketplace deals command triple the CPM of open exchanges. The TV advertising market size attached to sponsorships and co-branding is climbing as brands embed themselves within storylines, gaining halo effects unavailable in standard spots. Addressable and CTV programmatic formats facilitate household-level messages, enabling frequency rules that conserve budget and sustain reach.
Spot advertising remains essential for broad awareness flights, yet buyers now split schedules across dayparts to smooth frequency. Specialist marketplaces bundle sports or political inventory to match seasonal demand spikes. This packaging unlocks incremental revenue for rights-holders while giving marketers bespoke contexts that lift recall and intent metrics.
By End-User Industry: Tech and Electronics Sets the Adoption Pace
Consumer goods retained 27.55% of 2025 spend, leaning on television’s unparalleled household penetration for brand salience. Even so, technology and electronics advertisers are growing at a 7.18% pace, fuelled by rapid product cycles that reward precision targeting. These brands pilot cross-screen attribution models early, proving the ROI of AI-driven creatives and then scaling innovations across other verticals. Automotive, healthcare, and retail each refine strategies that mix national reach with addressable overlays to guide buyers toward local outlets or online carts.
As cryptocurrency apps and challenger banks proliferate, financial-services marketers expand CTV experimentation, valuing the security of brand-safe premium content. Retailers with first-party transaction data anchor partnerships with broadcasters to create shoppable ad units, shortening the path from impression to sale and demonstrating measurable outcomes within a single interface.
Geography Analysis
North America generated 33.45% of 2025 revenues as advertisers exploited mature addressable and programmatic infrastructure. Sports-betting integration into live telecasts delivered premium CPMs and kept prime-time inventory indispensable. Canadian case studies show direct-to-consumer brands lifting both digital and retail traffic through coordinated TV bursts that follow online prospecting.
Asia-Pacific is forecast to grow at 6.07% through 2031 on the back of booming digital-video consumption and regulations that encourage local productions. Local retail-media players blend e-commerce with CTV placements, converting viewers into buyers within the same session. Makro’s omni-channel network symbolises an emerging model where merchants monetise audience attention while providing attributable sales lift. Although profitability pressures linger, lower CPMs entice international brands seeking incremental reach across India, Indonesia, and Thailand.
Europe navigates stringent advertising caps such as the 20% hourly limit on commercial load during children’s shows, reducing inventory but preserving audience trust. Broadcasters counterbalance with addressable standards embedded in HbbTV middleware that turn linear signals into data-rich supply. This pivot protects revenue streams even as American streamers intensify competition. In the United States, the FCC spectrum repack continues to fragment terrestrial footprints, nudging buyers toward CTV for stable audience aggregation.

Competitive Landscape
Agency hold-cos consolidate to defend share against tech-platform incumbents. The Omnicom-IPG merger forms a USD 25 billion revenue behemoth that wields purchasing leverage across linear and CTV impressions. Demand-side platforms collaborate with large buyers to build custom optimisation stacks that rein in audience duplication and lift effective reach. On the supply side, broadcasters join forces with device OEMs to pool signals, achieving critical mass for national campaigns.
Tech companies leverage proprietary identity graphs to court branding budgets once reserved for linear TV. Amazon aligns its retail data with CTV placements, while smart-TV makers monetise operating-system homescreens. Solutions providers specialising in cross-screen measurement and AI creative optimisation differentiate by translating impression counts into attributable outcomes at campaign speed. Overall, rivalry centres on who can couple television-scale storytelling with verifiable, privacy-compliant performance metrics.
TV Advertising Industry Leaders
WPP plc
Omnicom Group Inc.
Dentsu Inc.
Havas Group
Publicis Groupe SA
- *Disclaimer: Major Players sorted in no particular order

Recent Industry Developments
- June 2025: The FTC cleared Omnicom’s USD 13.5 billion acquisition of Interpublic Group under conduct remedies.
- June 2025: Amazon Ads and Roku pooled CTV audiences, giving brands reach across 80% of US connected-TV households.
- March 2025: Universal Ads teamed with Ramp to open premium networks to 30,000 growth brands.
- March 2025: Kinetiq and DAIVID unveiled AI-based analytics to enrich TV performance reporting.


Global TV Advertising Market Report Scope
The TV advertising market remains a critical segment of the global advertising industry, driven by its broad reach and ability to engage diverse audiences during live and prime-time programming. With increasing integration of digital elements like Connected TV (CTV) and programmatic technologies, traditional TV platforms are adapting to offer more targeted and data-driven solutions. Despite competition from digital platforms, TV advertising continues to dominate in sectors like sports, news, and major events, where mass viewership is unparalleled.
The TV Advertising Market is segmented by TV platform (terrestrial television, multichannel (cable & satellite TV), over-the-top (OTT) television, connected TV (CTV)), advertising platform (prime-time advertising, spot advertising, sponsorships and co-branding), end user (consumer goods, automotive, retail, pharmaceuticals and healthcare, technology and electronics, other end users) and geography (North America, Europe, Asia Pacific, Latin America, Middle East and Africa). The market sizes and forecasts are provided in terms of value (USD) for all the above segments.
| Terrestrial Television |
| Multichannel - Cable TV |
| Multichannel - Satellite TV |
| Over-the-Top (OTT) Television |
| Connected TV (CTV) |
| Prime-Time Advertising |
| Spot Advertising |
| Sponsorships and Co-Branding |
| Addressable / Targeted TV |
| Programmatic TV (Including CTV Programmatic) |
| Consumer Goods |
| Automotive |
| Retail and E-commerce |
| Pharmaceuticals and Healthcare |
| Technology and Electronics |
| Financial Services |
| Media and Entertainment |
| Other Industries |
| North America | United States |
| Canada | |
| Mexico | |
| South America | Brazil |
| Argentina | |
| Rest of South America | |
| Europe | Germany |
| United Kingdom | |
| France | |
| Italy | |
| Spain | |
| Rest of Europe | |
| Asia-Pacific | China |
| Japan | |
| South Korea | |
| India | |
| Australia | |
| New Zealand | |
| Rest of Asia-Pacific | |
| Middle East and Africa | United Arab Emirates |
| Saudi Arabia | |
| South Africa | |
| Rest of Middle East and Africa |
| By TV Platform | Terrestrial Television | |
| Multichannel - Cable TV | ||
| Multichannel - Satellite TV | ||
| Over-the-Top (OTT) Television | ||
| Connected TV (CTV) | ||
| By Advertising Platform | Prime-Time Advertising | |
| Spot Advertising | ||
| Sponsorships and Co-Branding | ||
| Addressable / Targeted TV | ||
| Programmatic TV (Including CTV Programmatic) | ||
| By End-User Industry | Consumer Goods | |
| Automotive | ||
| Retail and E-commerce | ||
| Pharmaceuticals and Healthcare | ||
| Technology and Electronics | ||
| Financial Services | ||
| Media and Entertainment | ||
| Other Industries | ||
| By Geography | North America | United States |
| Canada | ||
| Mexico | ||
| South America | Brazil | |
| Argentina | ||
| Rest of South America | ||
| Europe | Germany | |
| United Kingdom | ||
| France | ||
| Italy | ||
| Spain | ||
| Rest of Europe | ||
| Asia-Pacific | China | |
| Japan | ||
| South Korea | ||
| India | ||
| Australia | ||
| New Zealand | ||
| Rest of Asia-Pacific | ||
| Middle East and Africa | United Arab Emirates | |
| Saudi Arabia | ||
| South Africa | ||
| Rest of Middle East and Africa | ||


Key Questions Answered in the Report
How large is the TV advertising market in 2026?
The TV advertising market is valued at USD 211.1 billion in 2026 and is on course for USD 263.2 billion by 2031, growing 4.51% annually.
Which platform is growing fastest within the TV advertising market?
Connected TV is expanding at a 12.52% CAGR through 2031 as advertisers pursue addressable audiences and digital-grade measurement.
Why is Asia-Pacific considered the most attractive growth region?
Asia-Pacific’s 6.07% forecast CAGR stems from rising digital-video consumption, supportive local-content rules, and innovative shoppable TV formats that link viewing to commerce.
What impact does the third-party cookie sunset have on TV advertising?
Cookie deprecation reduces cross-device match rates, steering budgets toward first-party data strategies and accelerating investment in CTV environments with deterministic IDs.
How are sports-betting brands influencing prime-time TV inventory?
US sports-betting operators spent USD 434.4 million on TV in 2024, elevating CPMs for live-sports slots and prompting networks to integrate real-time odds and sponsored segments.
What role does AI play in modern TV advertising?
AI optimises creatives in real time, predicts engagement, and lowers wasted impressions, delivering up to 60% higher brand-awareness scores for campaigns that deploy the technology.
Page last updated on:


