Media Market Size and Share
Market Overview
| Study Period | 2020 - 2031 |
|---|---|
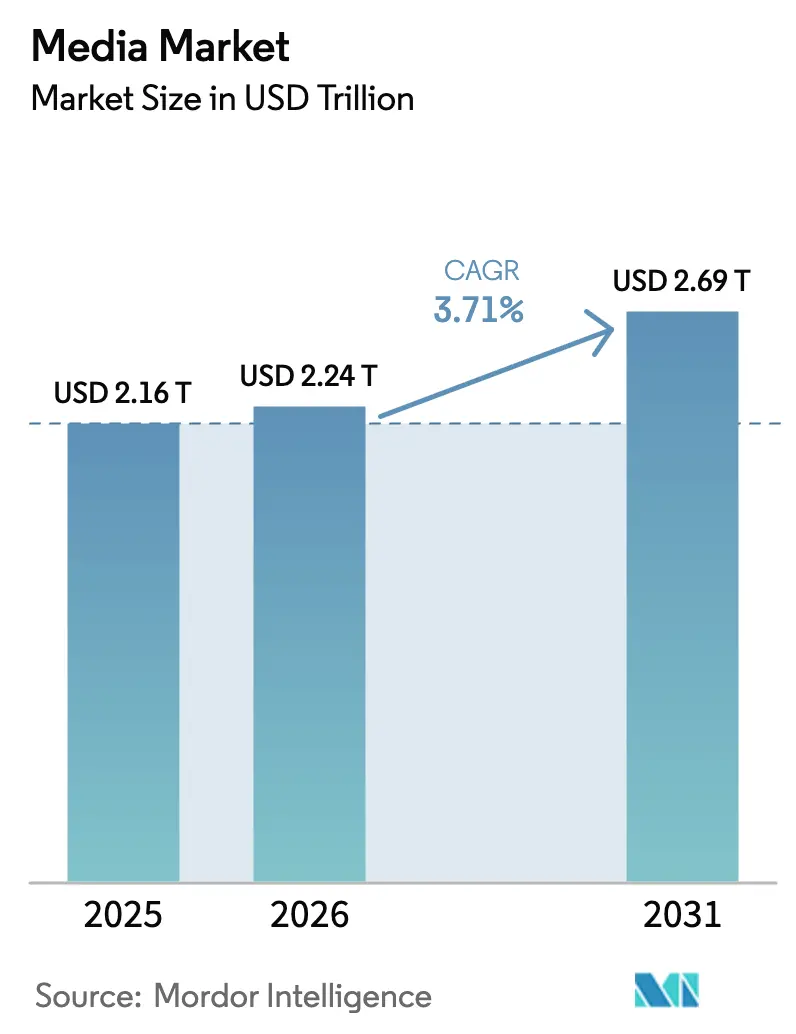
| Market Size (2026) | USD 2.24 Trillion |
| Market Size (2031) | USD 2.69 Trillion |
| Growth Rate (2026 - 2031) | 3.71% CAGR |
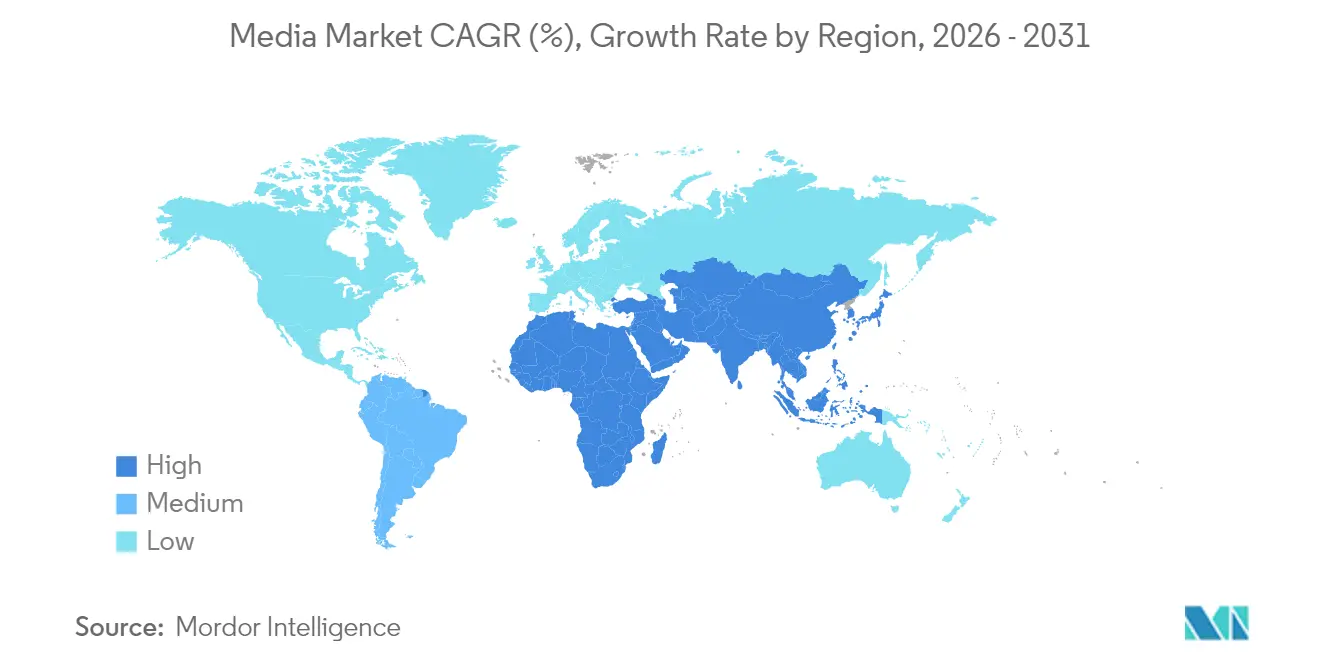
| Fastest Growing Market | Middle East and Africa |
| Largest Market | North America |
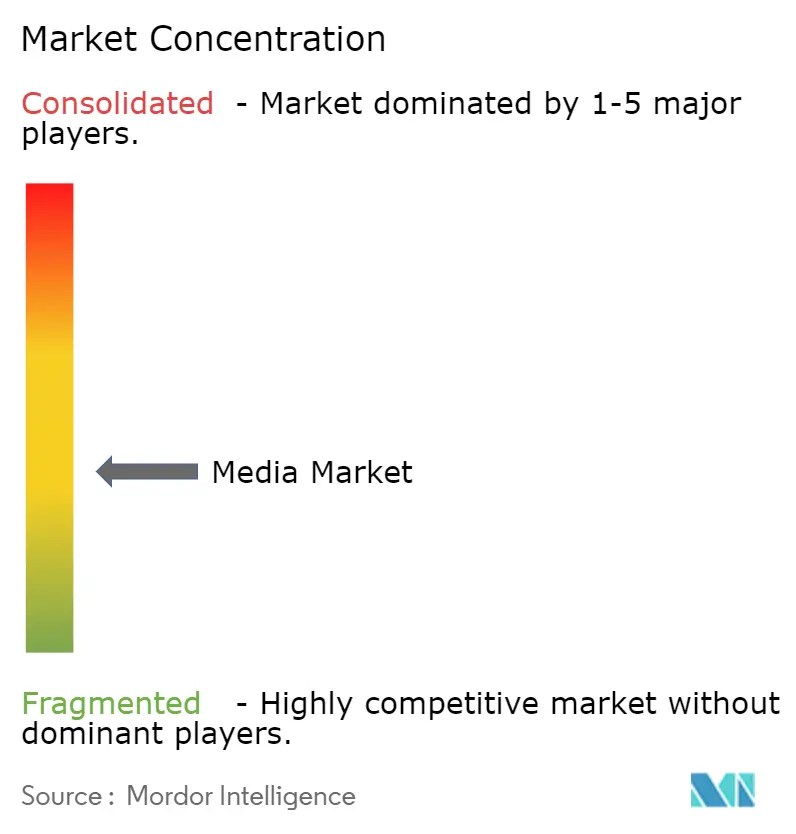
| Market Concentration | Medium |
Major Players *Disclaimer: Major Players sorted in no particular order Image © Mordor Intelligence. Reuse requires attribution under CC BY 4.0. | |
Media Market Analysis by Mordor Intelligence
Media market size in 2026 is estimated at USD 2.24 trillion, growing from 2025 value of USD 2.16 trillion with 2031 projections showing USD 2.69 trillion, growing at 3.71% CAGR over 2026-2031. An orderly growth curve signals the sector’s progression from high-burn expansion to disciplined monetization, where platforms blend subscription and advertising income to defend profitability. Digital advertising, which climbed 15% year over year to USD 259 billion in 2024, now underwrites platform economics, while ad-supported streaming tiers widen audience reach without eroding average revenue per user.[1]Interactive Advertising Bureau, “Digital Ad Revenue Reaches $259 Billion in 2024, Up 15% Year-Over-Year,” iab.com Sports media rights inflation-particularly across the Middle East-acts as both a revenue catalyst and a cost pressure. Meanwhile, artificial-intelligence-driven production tools compress development cycles, letting studios scale content output without large budget hikes. Across geographies, emerging economies deliver the bulk of incremental users, whereas North America’s mature base prioritizes wallet share and churn management.
Key Report Takeaways
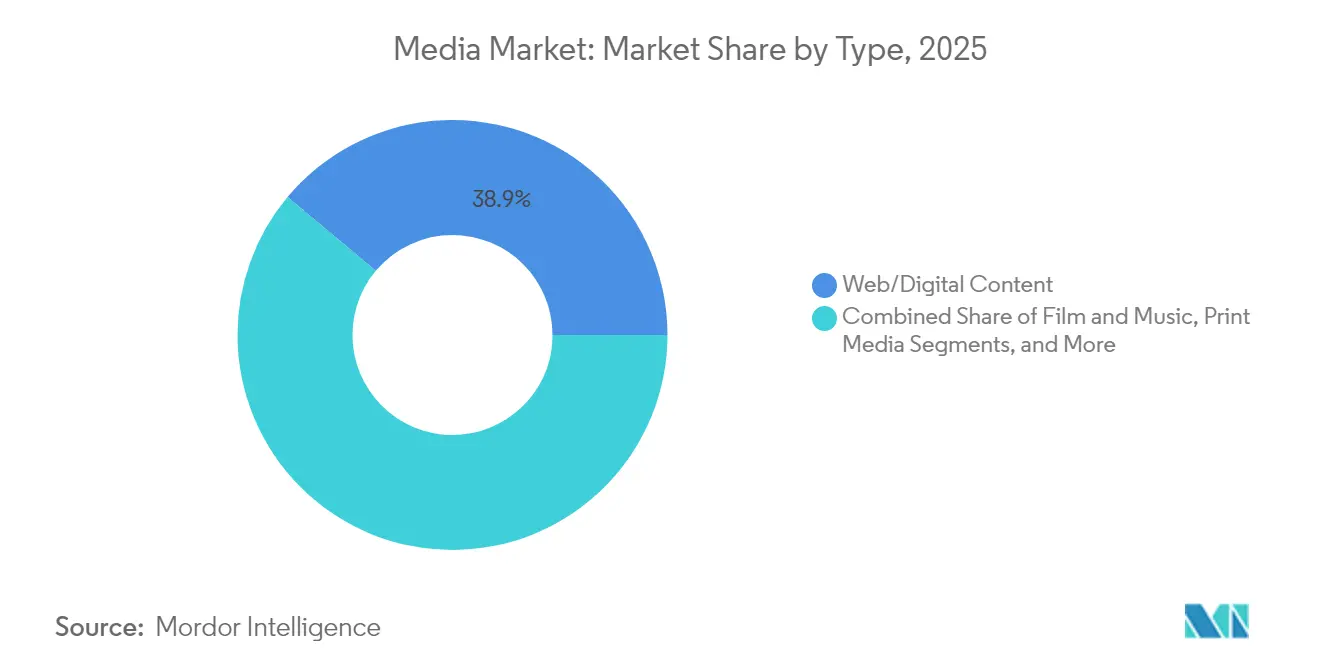
- By content type, Web and Digital Content led with a 38.92% revenue share in 2025, and it is forecast to advance at a 12.45% CAGR through 2031.
- By revenue model, the Advertising-Supported segment held 51.32% of the Media market share in 2025; Sponsorship is projected to post the fastest 8.82% CAGR.
- By geography, North America commanded 30.22% of 2025 revenue, while the Middle East and Africa region is expected to register the highest 6.70% CAGR to 2031.
Note: Market size and forecast figures in this report are generated using Mordor Intelligence’s proprietary estimation framework, updated with the latest available data and insights as of 2026.
Global Media Market Trends and Insights
Drivers Impact Analysis*
| Driver | (~) % Impact on CAGR Forecast | Geographic Relevance | Impact Timeline |
|---|---|---|---|
| Growth of ad-supported streaming tiers | +0.8% | North America & Europe | Short term (≤ 2 years) |
| Rising demand for regional-language OTT content | +0.6% | Asia-Pacific | Medium term (2-4 years) |
| Sports-centric media rights inflation | +0.4% | Middle East & Africa | Medium term (2-4 years) |
| Surge in AI-generated content workflows | +0.3% | North America | Long term (≥ 4 years) |
| Creator-economy monetization platforms | +0.2% | Latin America | Medium term (2-4 years) |
| Government-backed digital-first policies | +0.3% | Asia-Pacific | Long term (≥ 4 years) |
| Source: Mordor Intelligence | |||
Growth of Ad-Supported Streaming Tiers in North America & Europe
Ad-funded tiers have shifted platform economics, attracting price-sensitive viewers while supplying advertisers with audience scale. Netflix’s 13% revenue rise during Q1 2025 illustrates the model’s ability to lift top-line results even as subscriber growth normalizes. Disney reached streaming profitability in 2025 after introducing similar tiers, showing that well-executed ad formats can offset churn without slashing content budgets. Engagement levels among ad-tier users now match or exceed premium-tier viewing, raising inventory value and encouraging sophisticated targeting. With linear TV ad outlays declining, connected-TV spending funnels into these hybrid products, reinforcing the Media market’s pivot to diversified revenue.
Rising Demand for Regional-Language OTT Content in Asia
Government digital-first programs in India and Indonesia have expanded broadband and mobile penetration, letting OTT providers reach previously underserved tier-2 and tier-3 populations. Viewers gravitate toward locally produced dramas, comedies, and reality formats that reflect regional cultures rather than global blockbusters. Regional shows typically carry budgets 40-60% below international titles, yet they generate stickier watch-time metrics, boosting lifetime value. Platforms prioritizing such catalogs gain both cost efficiency and loyalty advantages, positioning them to scale revenue faster than players reliant on imported fare.
Sports-Centric Media Rights Inflation Across the Middle East
Sovereign wealth funds and pay-TV incumbents are bidding aggressively for marquee football, Formula 1, and esports properties to burnish national soft power and drive subscription uptake. Rights fees for select football packages rose more than 30% between the 2022-2024 cycles, lifting total regional outlays but pressuring broadcaster margins. The premium prices are justified by the proven ability of live sports to attract concurrent viewership and premium advertising CPMs. Yet smaller regional players risk being priced out, spurring partnership models and sublicensing deals that spread cost burdens across the ecosystem.
Surge in AI-Generated Content Workflows Among US Studios
Generative AI tools now automate pre-visualization, secondary footage, and digital asset creation. AMC Networks’ alliance with Runway demonstrates network-level adoption aimed at compressing marketing timelines hollywoodreporter. CJ ENM’s fully AI-animated “Cat Biggie” underscores creative potential while saving man-hours in labor-intensive animation pipelines.[2]Patrick Frater, “CJ ENM Unveils AI Strategy With ‘Cat Biggie’,” variety.com Early adopters report production-cycle reductions of up to 30%, allowing studios to refresh catalogs more rapidly. Over time, AI proficiency could become a gating factor for competitive content velocity.
Restraints Impact Analysis*
| Restraint | (~) % Impact on CAGR Forecast | Geographic Relevance | Impact Timeline |
|---|---|---|---|
| Escalating content-acquisition costs outpacing ARPU | -0.5% | Global | Short term (≤ 2 years) |
| Fragmented international IP-licensing regimes | -0.3% | Global | Medium term (2-4 years) |
| Persistent piracy in high-growth APAC markets | -0.4% | Asia-Pacific | Medium term (2-4 years) |
| Saturation of subscription SVOD in mature economies | -0.6% | North America & Europe | Long term (≥ 4 years) |
| Source: Mordor Intelligence | |||
Escalating Content-Acquisition Costs Outpacing ARPU
The top six streamers spent USD 126 billion on content in 2024, yet ARPU in core markets edged up by less than 3%, squeezing operating margins. Mid-tier platforms face stark trade-offs between programming breadth and cash flow sustainability. To blunt inflation, operators are pivoting toward originals, co-productions, and evergreen library assets that amortize costs over longer windows. Bundled rights spanning theatrical, streaming, and pay-TV help enhance yield, but the fundamental tension between content cost and revenue per user remains the most immediate drag on the Media market’s profit growth.
Saturation of Subscription SVOD in Mature Economies
Households in the United States and Western Europe now juggle an average of four streaming subscriptions, with churn rates hovering near 5% per month. Incremental subscriber gains largely come from displacing rivals rather than expanding the addressable base, turning growth into a zero-sum contest. Rising customer-acquisition costs and promotional discounts erode margins, prompting strategic pivots toward bundles, ad tiers, and experiential add-ons such as virtual concession stands on Disney+. Long-run expansion will depend on extracting more value from existing customers rather than adding new ones.
*Our forecasts treat driver/restraint impacts as directional, not additive. The impact forecasts reflect baseline growth, mix effects, and variable interactions.
Segment Analysis
By Type: Digital Content Becomes the Consumption Standard
Web and Digital Content captured 38.92% of Media market share in 2025, and the Media market size for this segment is projected to expand at a 12.45% CAGR between 2026-2031. Always-on mobile connectivity, ease of content discovery, and algorithmic personalization have reset viewer expectations, steadily siphoning audiences from linear TV and radio. As a result, broadcasters are migrating flagship shows to streaming catch-up services and repackaging archives for OTT libraries. While print titles struggle, premium paywalled journalism shows resilience; The New York Times added 250,000 digital subscribers in Q1 2025, driving digital subscription revenue to USD 335 million. Gaming, podcasts, and live-streamed events increasingly intersect with video, blending interactive play and passive consumption.
Theatrical film releases, pressured by altered viewing habits, embrace simultaneous or near-simultaneous digital release windows to recoup marketing spend quickly. Music revenue benefits from a stable streaming base, but labels are experimenting with spatial audio and short-form previews to elevate user engagement. As AI lowers production thresholds, user-generated clips flood platforms, intensifying competition for attention. Consequently, content-discovery algorithms evolve as strategic assets, guiding viewers toward owned-and-operated catalogs and branded experiences within the wider Media market.


By Revenue Model: Advertising Resurgence Alters Monetization Mix
Advertising-Supported services commanded 51.32% of the Media market size in 2025, delivering broad reach without subscription fatigue. Dynamic ad-insertion and programmatic bidding let platforms raise CPMs by targeting cohorts rather than mass audiences, lifting inventory value even as total ad load remains modest. The model’s renaissance dovetails with marketer desire for performance accountability, driving heavy investment from consumer-goods and automotive brands. Sponsorship, while smaller, is forecast to expand at a 8.82% CAGR, underpinned by bespoke brand integrations that resonate with younger demos.
Subscription revenue, although decelerating, still underwrites marquee originals that differentiate platform libraries. Tiered offers combining ad-lite and premium ad-free plans allow operators to segment price-sensitive households while upselling heavy viewers. Transactional video on demand, pay-per-view sports, and merchandise tie-ins provide diversified earnings levers, insulating cash flow against shifts in any single model. Hybrid stacks that algorithmically optimize yield per session—deciding whether to serve an ad, promote a subscription upgrade, or surface a purchase prompt—represent the next frontier in Media market monetization.
Geography Analysis
North America retained a 30.22% revenue share in 2025. Despite slowing subscriber additions, the region remains the highest ARPU generator, thanks to sophisticated advertising ecosystems and premium pricing tolerance. The Media market size for North America is expected to edge up at a low-single-digit CAGR as platforms squeeze incremental margin via ad-tier expansion and bundle packaging. Consolidation activity-such as talk of Max-Paramount+ integration-signals a push for cost synergies and unified ad tech stacks capable of delivering addressable TV at scale.
Latin America delivers compelling upside, propelled by mobile-first consumption, rising middle-class incomes, and creator-economy platforms that monetize short-form video. Brazil leads the region’s Media market trajectory, supported by supportive tax incentives for local productions and strong Portuguese-language catalog demand. Mexico and Argentina display similar appetite, though currency volatility introduces planning complexity. Advertisers see high engagement in influencer-led commerce streams, creating new brand-safe inventory that complements long-form platforms and accelerates regional revenue diversification.
The Middle East and Africa’s forecast 6.70% CAGR through 2031 stems from government-funded fiber rollouts and blockbuster sports rights acquisitions that lure global OTT players. Gulf Cooperation Council nations leverage sovereign capital to secure football and Formula 1 packages, pulling international viewers into regional subscription ecosystems and inflating average subscription values. Europe exhibits modest growth hindered by stringent local-content quotas and fragmented language markets, necessitating finely tuned localization strategies. Netflix’s TF1 partnership exemplifies how joint ventures can unlock domestic broadcast inventory while satisfying regulatory guidelines. Across Asia-Pacific, India’s and Indonesia’s rural connectivity gains broaden the Media market’s addressable audience, with regional-language originals deepening engagement and lowering churn.

Competitive Landscape
Industry rivalry has shifted from land-grab expansion to disciplined operating-margin delivery. The USD 8 billion Paramount-Skydance merger underscores the premium investors place on scalable IP libraries that span theatrical, streaming, and interactive formats. Meanwhile, Netflix posts steady mid-teens revenue gains on the back of ad-tier launches and game extensions, proving that first-mover advantages still accrue when paired with agile pricing. Disney’s pivot to virtual storefronts on Disney+ and Hulu adds a retail layer that captures merchandise demand without lifting subscription fees.
Smaller players pursue differentiation through technology or genre specialization. AMC Networks partners with Runway to automate marketing asset creation, shaving weeks off campaign lead times . CJ ENM leverages AI to craft cost-efficient animation suited to global children’s audiences, blurring lines between traditional studios and tech ventures. In connected TV, Amazon Ads and Roku pool inventory, giving brands reach into 80% of US households and challenging incumbent ad sellers. Competitive battlegrounds now include interactive events, creator monetization features, and micro-subscription passes around individual sports leagues or influencers.
As the Media market matures, IP control and technology agility determine bargaining power. Studios owning evergreen franchises can license selectively, while tech-enabled distributors wield data to set dynamic pricing and drive targeted engagement. Strategic alliances-whether in ad tech, content co-production, or regional distribution-illustrate a pragmatic shift away from winner-takes-all narratives toward ecosystem partnerships that spread risk and unlock new profit pools.
Media Industry Leaders
Apple Inc.
Netflix, Inc.
The Walt Disney Company
Comcast Corporation
AT&T Inc.
- *Disclaimer: Major Players sorted in no particular order

Recent Industry Developments
- July 2025: Paramount agreed to pay Donald Trump USD 16 million to resolve litigation, clearing a path for its merger with Skydance Media.
- June 2025: Netflix and TF1 struck a pioneering deal to add French commercial channels and on-demand shows to Netflix France in 2026.
- June 2025: Amazon Ads and Roku partnered to offer brands access to 80% of US connected-TV households.
- June 2025: Artists Equity entered a theatrical film pact with Sony Pictures, adding star power to Sony’s upcoming slate
- June 2025: Disney revealed plans for virtual concession stands across Disney+, Hulu, and ESPN streaming services.
- June 2025: CJ ENM debuted “Cat Biggie,” a fully AI-generated animation, showcasing its broader AI content strategy.
- June 2025: Concord Originals bought historic RKO Pictures, adding iconic IP such as “Citizen Kane” to its portfolio.


Global Media Market Report Scope
Media is the means or communication tool through which information, educational, entertainment, data, or promotional messages are disseminated.
The media market is segmented by type (tv and radio broadcasting, film and music, web content, print media, other types), by revenue model (subscription, advertisement, sponsorship, other revenue models), by geography (North America, Europe, Asia-Pacific, Latin America, Middle East and Africa). The market sizes and forecasts are provided in terms of value (USD) for all the above segments.
| TV and Radio Broadcasting |
| Film and Music |
| Web/Digital Content |
| Print Media |
| Other Types (Gaming, Live Events) |
| Advertising-Supported |
| Subscription |
| Sponsorship |
| Other Revenue Models |
| North America | United States |
| Canada | |
| Mexico | |
| South America | Brazil |
| Argentina | |
| Rest of South America | |
| Europe | Germany |
| United Kingdom | |
| France | |
| Italy | |
| Spain | |
| Rest of Europe | |
| Asia-Pacific | China |
| Japan | |
| South Korea | |
| India | |
| Australia | |
| Rest of Asia-Pacific | |
| Middle East | United Arab Emirates |
| Saudi Arabia | |
| Rest of Middle East | |
| Africa | South Africa |
| Rest of Africa |
| By Type | TV and Radio Broadcasting | |
| Film and Music | ||
| Web/Digital Content | ||
| Print Media | ||
| Other Types (Gaming, Live Events) | ||
| By Revenue Model | Advertising-Supported | |
| Subscription | ||
| Sponsorship | ||
| Other Revenue Models | ||
| By Geography | North America | United States |
| Canada | ||
| Mexico | ||
| South America | Brazil | |
| Argentina | ||
| Rest of South America | ||
| Europe | Germany | |
| United Kingdom | ||
| France | ||
| Italy | ||
| Spain | ||
| Rest of Europe | ||
| Asia-Pacific | China | |
| Japan | ||
| South Korea | ||
| India | ||
| Australia | ||
| Rest of Asia-Pacific | ||
| Middle East | United Arab Emirates | |
| Saudi Arabia | ||
| Rest of Middle East | ||
| Africa | South Africa | |
| Rest of Africa | ||


Key Questions Answered in the Report
What is the current size of the Media market?
The Media market generated USD 2.24 trillion in 2026 and is projected to reach USD 2.69 trillion by 2031.
Which content type is growing fastest?
Web and Digital Content is forecast to expand at 12.45% CAGR between 2026-2031, outperforming every traditional format.
Why are ad-supported streaming tiers gaining traction?
Ad-funded tiers attract price-sensitive viewers, boost engagement, and create incremental revenue for platforms facing subscription fatigue.
Which region offers the highest growth potential?
The Middle East and Africa region is expected to record a 6.70% CAGR through 2031, driven by sports rights investments and improved connectivity.
How is AI changing content production?
Generative AI reduces production timelines by up to 30%, allowing studios to scale output while containing costs.
What challenges threaten Media market growth?
Escalating content costs, piracy in high-growth markets, and subscription saturation in North America and Europe weigh on long-term expansion.
Page last updated on:


