Online Display Advertising Market Size and Share
Market Overview
| Study Period | 2020 - 2031 |
|---|---|
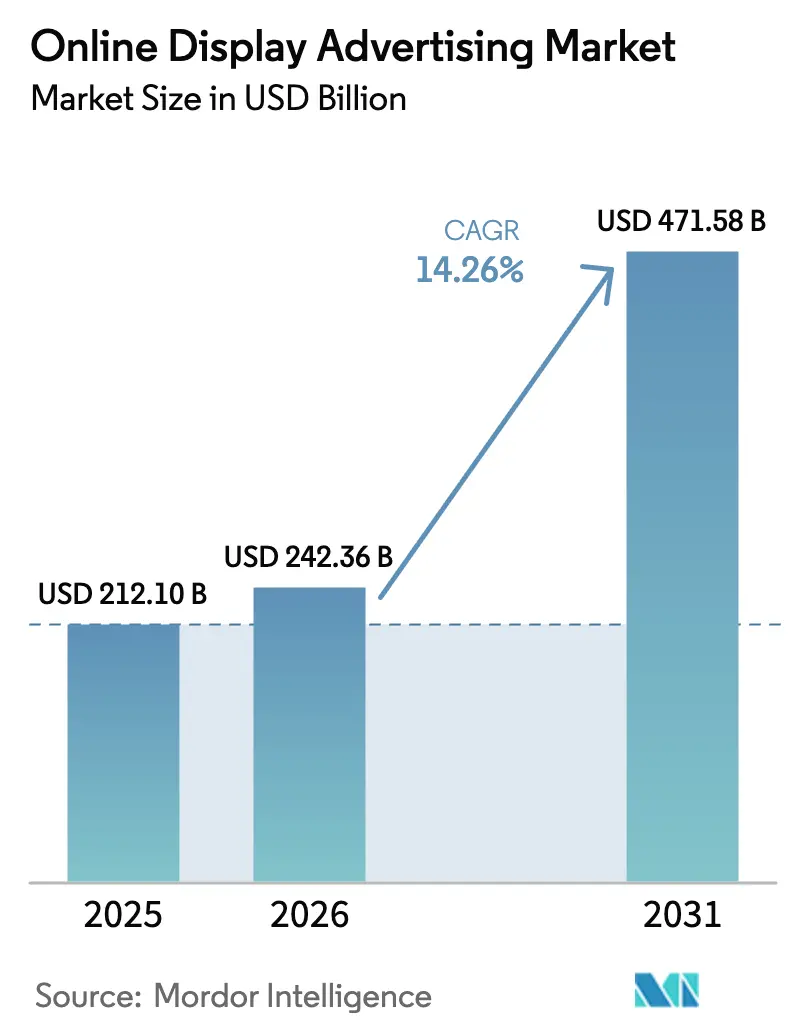
| Market Size (2026) | USD 242.36 Billion |
| Market Size (2031) | USD 471.58 Billion |
| Growth Rate (2026 - 2031) | 14.26% CAGR |
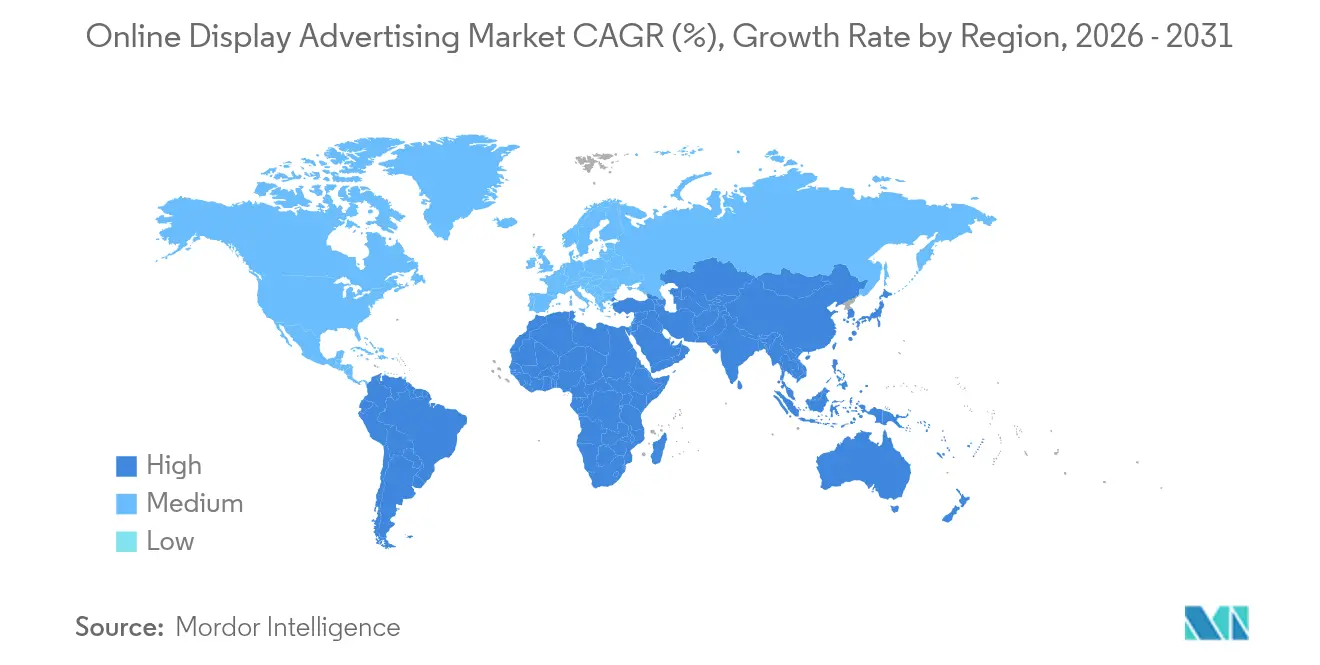
| Fastest Growing Market | Asia |
| Largest Market | North America |
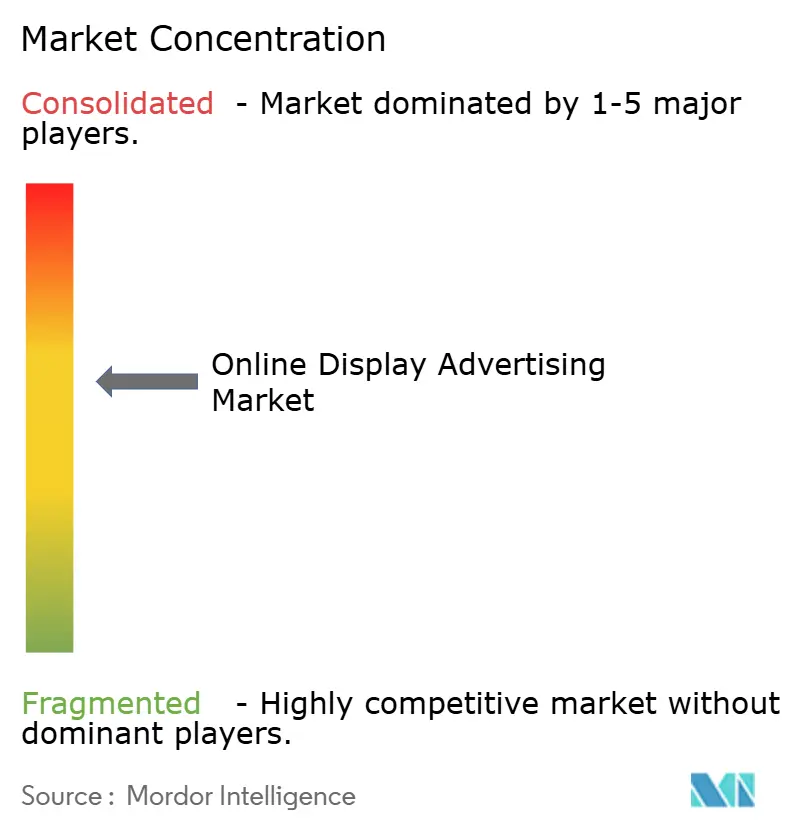
| Market Concentration | Medium |
Major Players *Disclaimer: Major Players sorted in no particular order Image © Mordor Intelligence. Reuse requires attribution under CC BY 4.0. | |
Online Display Advertising Market Analysis by Mordor Intelligence
Online display advertising market size in 2026 is estimated at USD 242.36 billion, growing from 2025 value of USD 212.10 billion with 2031 projections showing USD 471.58 billion, growing at 14.26% CAGR over 2026-2031. This strong trajectory underscores advertisers’ pivot toward performance-driven media buying, led by programmatic infrastructure upgrades, the rapid rise of retail media networks, and the migration of linear television budgets into connected environments. Programmatic guaranteed deals now lock in premium connected-TV (CTV) inventory at higher yields, while 5G expansion enables high-resolution mobile video that lifts engagement. Privacy-first identity solutions, dynamic creative optimization, and richer creative formats are redefining success metrics for the online display advertising market, even as cookie deprecation and ad-fraud risks add cost pressures.
Key Report Takeaways
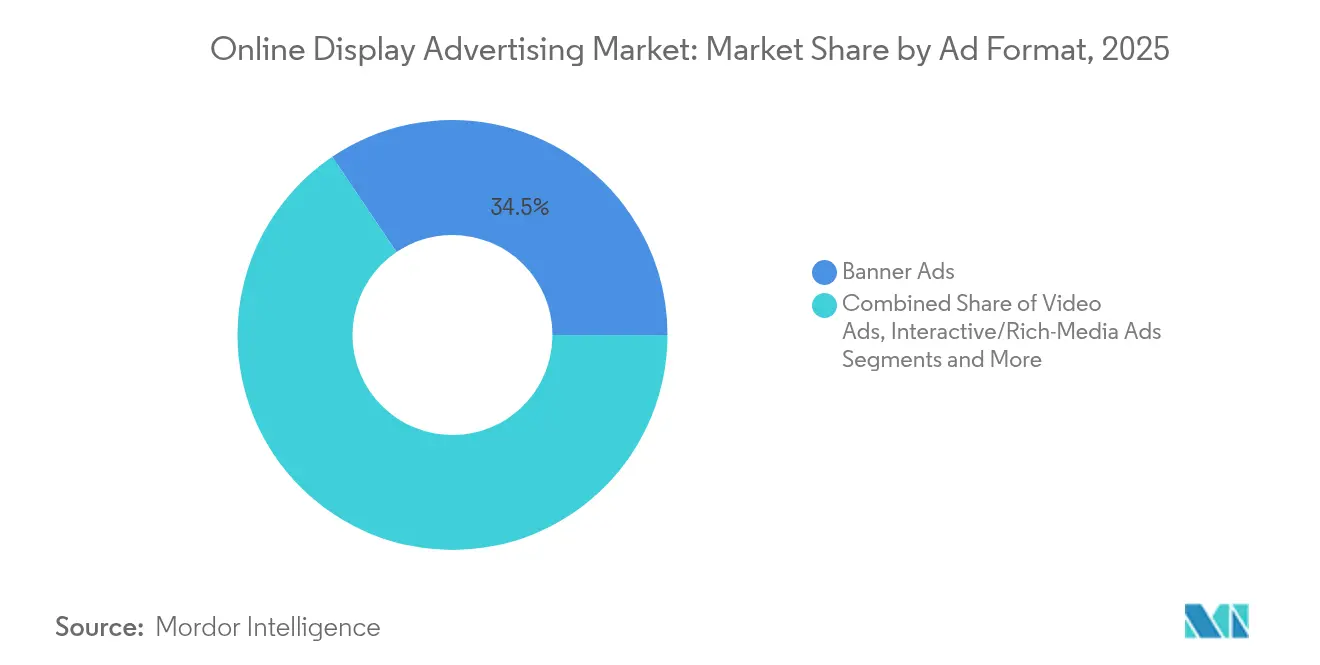
- By ad format, Banner Ads held a 34.45% share of the online display advertising market in 2025; Video Ads are projected to expand at a 17.9% CAGR through 2031.
- By device type, Mobile and Tablet commanded 57.20% of 2025 spending of the online display advertising market, whereas CTV is forecast to grow at a 21.1% CAGR through 2031.
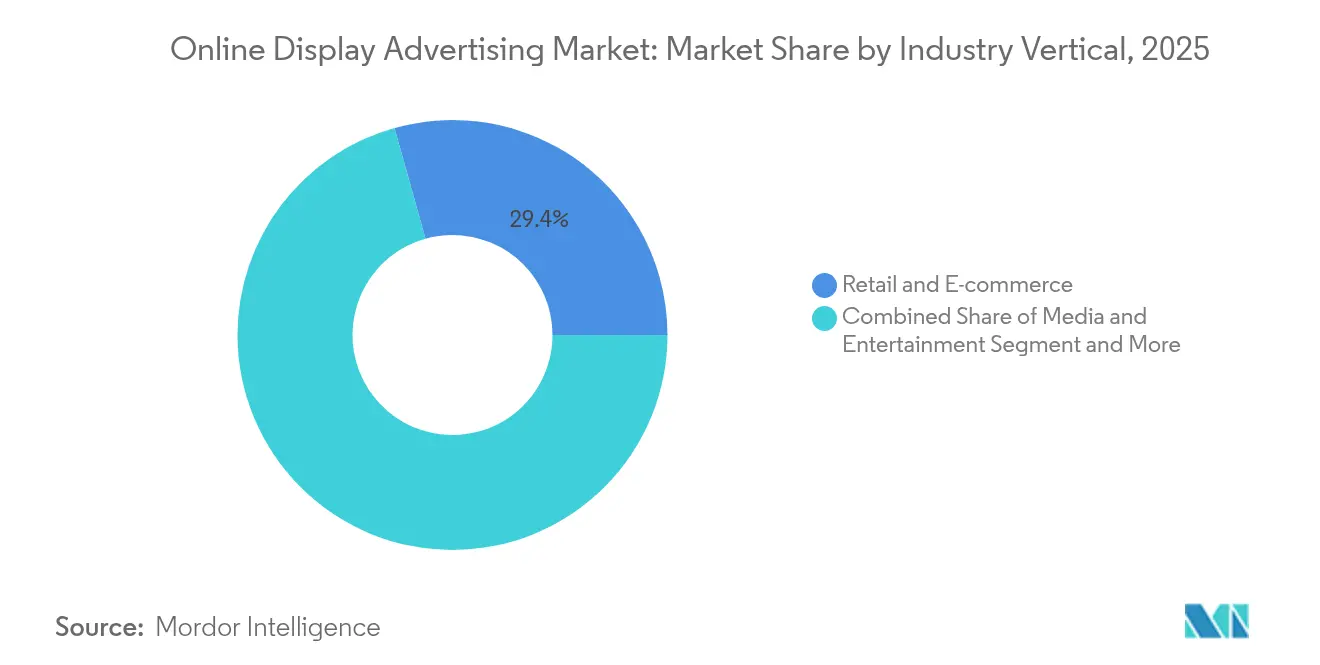
- By industry vertical, Retail and E-commerce captured 29.35% of the 2025 spend; Media and Entertainment is expected to be the fastest-growing vertical, with a 16.55% CAGR over 2026-2031 of the online display advertising market.
- By geography, North America led with 36.40% of the 2025 revenue of the online display advertising market, while Asia-Pacific is projected to post a 16.45% CAGR by 2031.
Note: Market size and forecast figures in this report are generated using Mordor Intelligence’s proprietary estimation framework, updated with the latest available data and insights as of 2026.
Global Online Display Advertising Market Trends and Insights
Drivers Impact Analysis*
| Driver | (~) % Impact on CAGR Forecast | Geographic Relevance | Impact Timeline |
|---|---|---|---|
| Retailers’ first-party data monetization | +2.50% | North America, Europe, spillover to Asia-Pacific | Medium term (2-4 years) |
| Programmatic guaranteed deals in CTV | +3.20% | US and EU, emerging Asia-Pacific | Short term (≤2 years) |
| 5G roll-outs enabling high-resolution mobile video | +2.80% | Asia, accelerating in North America and Europe | Medium term (2-4 years) |
| Social-commerce livestream ads | +1.90% | China and Southeast Asia, early North America | Short term (≤2 years) |
| Retail media networks’ on-site display expansion | +1.60% | Global, strongest in North America and Europe | Medium term (2-4 years) |
| AI-powered dynamic creative optimization | +1.50% | Global, early North America | Medium term (2-4 years) |
| Source: Mordor Intelligence | |||
Retailers’ First-Party Data Monetization Boosts Display Yield
Retailers’ extensive purchase data now powers premium audience segments that achieve higher CPMs and stronger return on ad spend. Amazon’s ad revenue climbed 24% year over year in 2023 to USD 47 billion as sponsored display rooted in first-party data sharpened campaign attribution.[1]Amazon.com, Inc., “Amazon.com, Inc. 2023 Annual Report,” amazon.com Brick-and-mortar chains are following suit by building data platforms linking online exposure to in-store sales. Closed-loop attribution unlocks marketing budgets that previously favored search and social, reinforcing growth for the online display advertising market.
Programmatic Guaranteed Deals Expand in CTV Ecosystems
Automation now underpins 85% of premium video transactions, with most classified as guaranteed, reflecting buyers’ preference for predictable reach without sacrificing targeting. In CTV, roughly 75% of deals are already programmatic, and publishers fetch 30-40% price premiums versus open auction inventory. This certainty attracts branding budgets and accelerates revenue expansion across the online display advertising market.
5G Infrastructure Unlocks High-Resolution Mobile Video
Throughputs nearing 10 Gbps and sub-millisecond latency enable seamless delivery of 4K and interactive ads on handheld devices, spurring short five-second “burst” creatives optimized for mobile. Asia’s mobile-first audiences push rapid uptake, while North America and Europe echo the trend as carriers densify networks. Advertisers exploit this bandwidth to blend augmented reality and shoppable video, elevating engagement metrics for the online display advertising market.
Social-Commerce Livestreaming Creates New Inventory
Live shoppable video combines entertainment and instant checkout, forging highly engaged placements. Streaming now occupies 44.5% of Southeast Asian TV viewing. TikTok Shop generated USD 33 billion GMV in 2024 despite missing loftier targets, underscoring momentum for video commerce techbuzzchina. Agencies such as AnyMind’s newly acquired Vibula position early for the format’s projected 20% share of regional e-commerce GMV
Restraints Impact Analysis*
| Restraint | (~) % Impact on CAGR Forecast | Geographic Relevance | Impact Timeline |
|---|---|---|---|
| Cookie-less identity signal loss | -1.20% | Global, highest in Europe and North America | Short term (≤2 years) |
| EU ePrivacy regulation uncertainty | -0.90% | Europe, global spillover | Medium term (2-4 years) |
| OTT/CTV ad-fraud (IVT, device farms) | -0.80% | Global, highest in North America | Short term (≤2 years) |
| Publisher ad-load limits | -0.60% | Global | Medium term (2-4 years) |
| Source: Mordor Intelligence | |||
Cookie-Deprecation Curtails Addressable Impressions
Google’s August 2024 decision to delay third-party cookie phase-out offered temporary relief yet prolonged planning uncertainty. Marketers now pivot to first-party and contextual approaches that demand new tech stacks, elevating costs and risking reach fragmentation. Identity-resolution firms cite mounting demand but uneven readiness, limiting growth for the online display advertising market in the near term.
Regulatory Complexity Hampers Cross-Site Tracking
The forthcoming EU ePrivacy Regulation complicates data-sharing and forces global advertisers to adopt Europe’s strictest compliance standard. Academic work shows earlier tax changes raised ad prices 25-38% as platforms absorbed regulatory frictions. Smaller publishers face steeper hurdles, slowing innovation and constraining supply across the online display advertising market.
*Our forecasts treat driver/restraint impacts as directional, not additive. The impact forecasts reflect baseline growth, mix effects, and variable interactions.
Segment Analysis
By Ad Format: Video Accelerates as Engagement Catalyst
Video Ads are set to grow at an 17.9% CAGR from 2026 to 2031, eclipsing static placements as brands pursue richer storytelling. Video drew USD 63 billion in 2024 global spend, rising 16% year on year. Banner Ads kept a 34.45% share yet face banner-blindness, spurring migration to interactive Rich Media that posts 267% higher engagement. Immersive formats like AR product try-ons raise dwell time and conversion, aligning with retailer goals in the online display advertising market.
Rich Media’s traction is technology-driven. Programmatic transactions handled 81% more video views in early 2022, confirming the shift toward automated, data-driven buying. Innovations such as 3D configurators for automotive and beauty spur interaction, with brands reporting double-digit lifts in purchase intent. This momentum underpins steady expansion in the online display advertising market.


By Device Type: Connected TV Reshapes Screen Hierarchy
CTV is forecast to post a 21.1% CAGR through 2031 as audiences cut cords and advertisers chase addressable living-room impressions. CTV spend is projected to exceed USD 36.9 billion in 2026, rising 12.6% year on year. Mobile and Tablet kept 57.20% share in 2025, upheld by smartphone ubiquity and 5G throughput. Desktop retains a niche for B2B and finance, where complex journeys favor larger screens.
Programmatic infrastructure tailwinds reinforce CTV growth. Innovid’s Harmony Direct yields an average 8% rise in working media for agencies and up to a 15% yield lift for publishers. The convergence of TV’s immersive environment with digital targeting elevates CPMs, increasing total addressable spend within the online display advertising market.
By Industry Vertical: Retail Leads, Media and Entertainment Gains Speed
Retail and E-commerce commanded 29.35% of 2025 spend, propelled by closed-loop attribution on retailer properties and the booming retail media ecosystem. Retail media is forecast to reach USD 179.5 billion in 2025, equating to 23% of digital spend, and forms a cornerstone of the online display advertising market. Media and Entertainment, projected at a 16.55% CAGR, accelerates as streaming services lean on ad tiers for growth. Automotive brands use lead-gen formats through Google’s network, which owns 91.54% search share, to nurture prospects. BFSI advertisers move to privacy-first targeting and lifetime-value goals, reflecting maturing digital playbooks
Geography Analysis
North America secured 36.40% of 2025 revenue, underpinned by advanced programmatic adoption and the retail media boom. The 2024 US presidential election injected USD 11 billion of incremental spend, lifting overall budgets. Nonetheless, OTT fraud rates as high as 90% on suspect inventory underscore vigilance needs.
Asia-Pacific is the fastest-growing region, registering a 16.45% CAGR outlook to 2031. Regional ad spend climbed 7.5% in 2024 to USD 289 billion, with digital driving the gain. Social-commerce livestreaming and swift 5G deployment fuel richer formats. YouTube ad revenue rose 9% in Q4 2024, signalling runway for further monetization.
Europe faces regulatory drag from ePrivacy deliberations yet still records steady gains. Omnicom cited European demand as a material contributor to Q2 2024 growth. Latin America delivered 24.5% organic revenue growth for Omnicom the same quarter, while the Middle East and Africa posted 8% growth, highlighting emerging opportunities as connectivity expands.

Competitive Landscape
The online display advertising market features high concentration among Google, Meta, and Amazon, yet new challengers emerge through retail media and specialized demand-side platforms. A federal judge ruled in April 2025 that Google illegally monopolizes ad tech, possibly forcing divestitures and altering competitive. [2]The New York Times, “Google Is Illegally Monopolizing Online Advertising Tech,” nytimes.com
First-party data strategies dominate investment themes as privacy risk reshapes targeting. Verve Group’s acquisition of Jun Group broadens demand-side scale and indicates renewed M&A aimed at omnichannel reach. [3]Verve Group SE, “Capital Markets Day,” investors.verve.comAI integration accelerates as platforms embed creative optimization, campaign pacing, and fraud detection to protect performance.
White-space opportunities remain in CTV and immersive formats, where standardization lags and premium supply grows. Retailers’ walled gardens, telecom data partnerships, and self-service ad portals cultivate competition and diversify spend flows within the online display advertising market.
Online Display Advertising Industry Leaders
Google LLC
Meta Platforms, Inc.
Amazon.com, Inc.
Microsoft Corporation
Adobe Inc.
- *Disclaimer: Major Players sorted in no particular order

Recent Industry Developments
- May 2025: Amazon’s ad revenue reached USD 13.9 billion in Q1 2025, up 18% year on year, illustrating retail media momentum
- April 2025: A federal judge ruled Google illegally monopolizes ad tech, raising potential divestiture scenarios
- April 2025: AnyMind Group acquired Vietnam-based Vibula to strengthen live-commerce capabilities
- April 2025: Coalition for Innovative Media Measurement released a diagnostic of programmatic TV supply-chain gaps


Global Online Display Advertising Market Report Scope
The online display advertising market refers to the digital marketing segment where advertisers use visually engaging formats, such as banners, videos, and interactive ads, to reach target audiences across websites, social media platforms, and mobile apps. It includes both direct and programmatic ad placements, offering advertisers tools for targeting specific user segments. The market's growth is driven by increasing internet penetration, mobile usage, and advancements in ad technologies.
The Online Display Advertising market is segmented by ad format (banner ads, video ads, interactive ads, pop-ups and overlays, other ad formats), device type (desktop, mobile, connected TVs (CTV)), industry vertical (retail & e-commerce, media & entertainment, automotive, FMCG, travel & hospitality, BFSI, other industry verticals), and geography (North America, Europe, Asia Pacific, Latin America, and Middle East And Africa). The market sizes and forecasts are provided in terms of value (USD) for all the above segments.
| Banner Ads |
| Video Ads |
| Interactive/Rich-Media Ads |
| Pop-ups and Overlays |
| Other Ad Formats |
| Desktop |
| Mobile |
| Connected TVs (CTV) |
| Retail and E-commerce |
| Media and Entertainment |
| Automotive |
| FMCG/CPG |
| Travel and Hospitality |
| BFSI |
| Other Verticals |
| North America | United States |
| Canada | |
| Mexico | |
| South America | Brazil |
| Argentina | |
| Chile | |
| Peru | |
| Rest of South America | |
| Europe | Germany |
| United Kingdom | |
| France | |
| Italy | |
| Spain | |
| Rest of Europe | |
| Asia-Pacific | China |
| Japan | |
| South Korea | |
| India | |
| Australia | |
| New Zealand | |
| Rest of Asia-Pacific | |
| Middle East | United Arab Emirates |
| Saudi Arabia | |
| Turkey | |
| Rest of Middle East | |
| Africa | South Africa |
| Rest of Africa |
| By Ad Format | Banner Ads | |
| Video Ads | ||
| Interactive/Rich-Media Ads | ||
| Pop-ups and Overlays | ||
| Other Ad Formats | ||
| By Device Type | Desktop | |
| Mobile | ||
| Connected TVs (CTV) | ||
| By Industry Vertical | Retail and E-commerce | |
| Media and Entertainment | ||
| Automotive | ||
| FMCG/CPG | ||
| Travel and Hospitality | ||
| BFSI | ||
| Other Verticals | ||
| By Geography | North America | United States |
| Canada | ||
| Mexico | ||
| South America | Brazil | |
| Argentina | ||
| Chile | ||
| Peru | ||
| Rest of South America | ||
| Europe | Germany | |
| United Kingdom | ||
| France | ||
| Italy | ||
| Spain | ||
| Rest of Europe | ||
| Asia-Pacific | China | |
| Japan | ||
| South Korea | ||
| India | ||
| Australia | ||
| New Zealand | ||
| Rest of Asia-Pacific | ||
| Middle East | United Arab Emirates | |
| Saudi Arabia | ||
| Turkey | ||
| Rest of Middle East | ||
| Africa | South Africa | |
| Rest of Africa | ||


Key Questions Answered in the Report
What is the current value of the online display advertising market?
The online display advertising market is valued at USD 242.36 billion in 2026.
How fast is the market expected to grow?
It is projected to advance at a 14.26% CAGR, reaching USD 471.58 billion by 2031.
Which ad format shows the strongest growth outlook?
Video Ads are forecast to expand at an 17.9% CAGR during 2026-2031, outpacing other formats.
Why is Connected TV attracting more ad budgets?
CTV blends television-style attention with programmatic precision and is expected to grow at a 21.1% CAGR through 2031.
How will cookie deprecation affect advertisers?
Loss of third-party cookies reduces addressable impressions, forcing investment in first-party data and contextual targeting, which may raise campaign costs in the short term.
Page last updated on:


