Digital Media Market Size and Share
Market Overview
| Study Period | 2020 - 2031 |
|---|---|
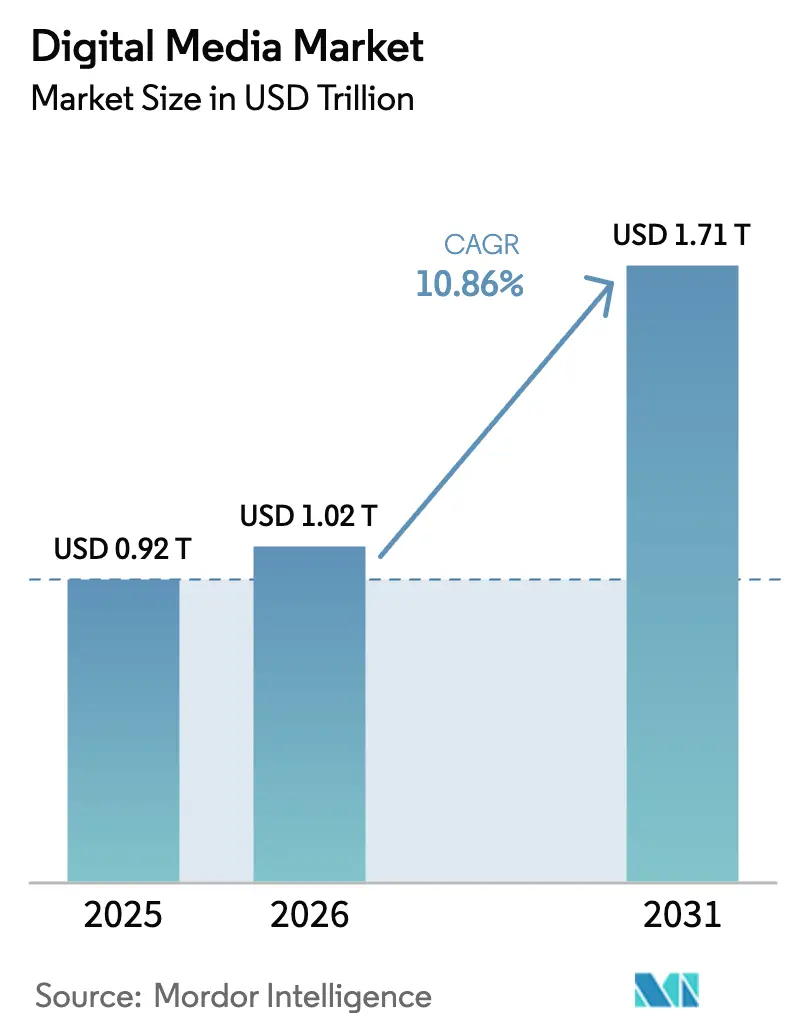
| Market Size (2026) | USD 1.02 Trillion |
| Market Size (2031) | USD 1.71 Trillion |
| Growth Rate (2026 - 2031) | 10.86% CAGR |
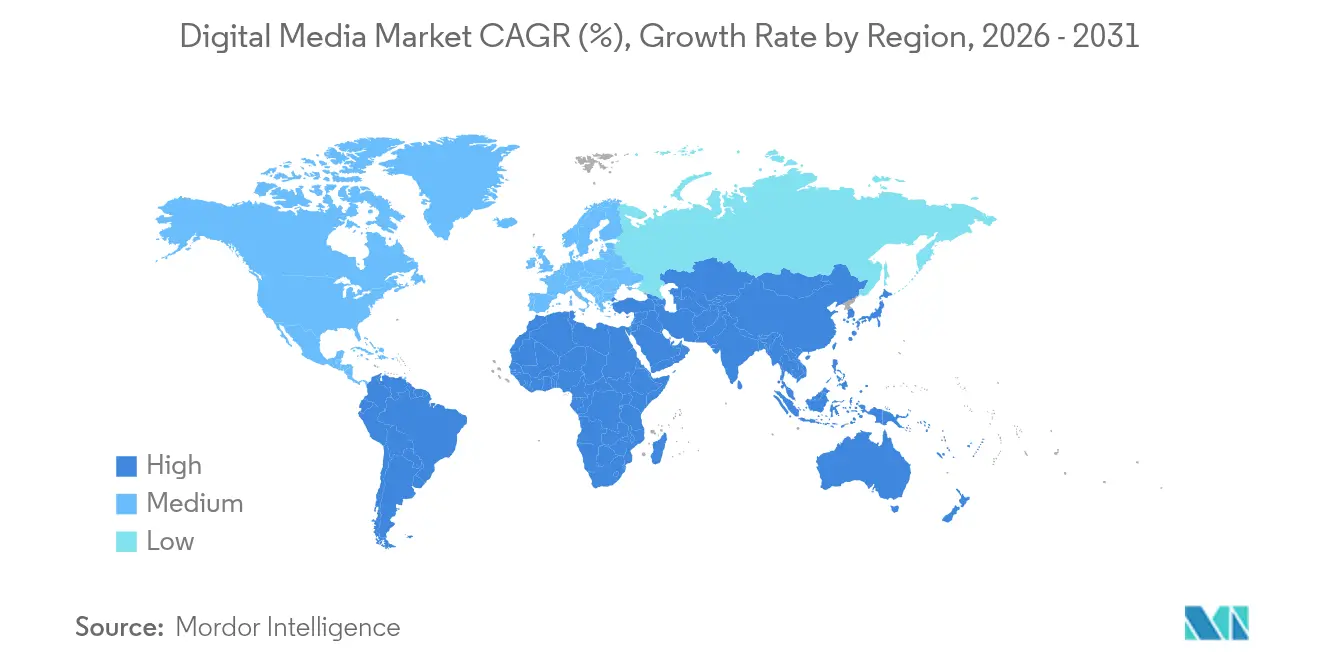
| Fastest Growing Market | Asia Pacific |
| Largest Market | North America |
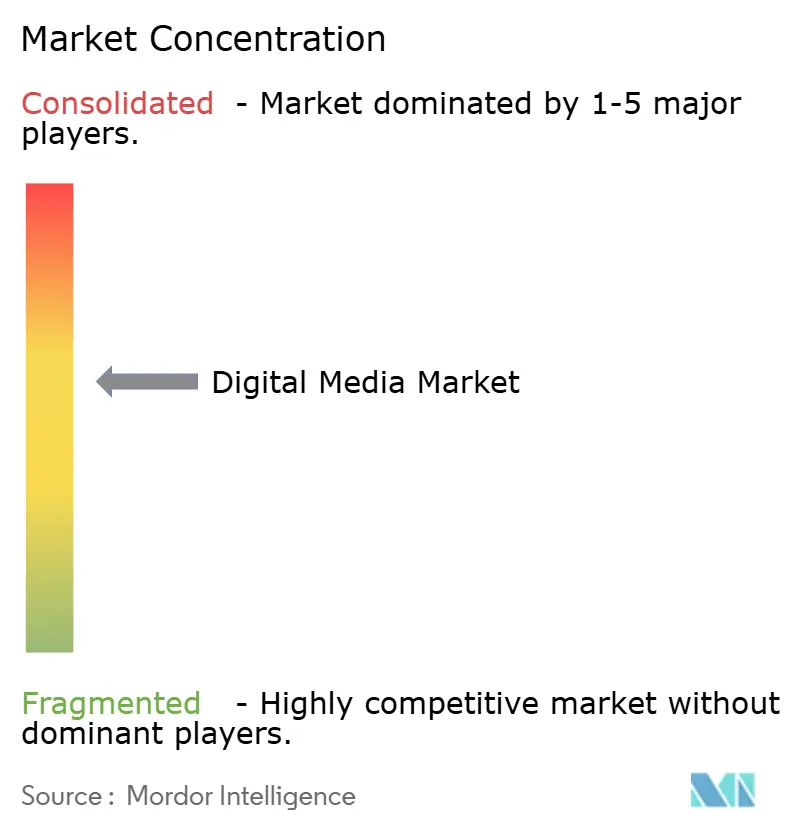
| Market Concentration | Medium |
Major Players *Disclaimer: Major Players sorted in no particular order Image © Mordor Intelligence. Reuse requires attribution under CC BY 4.0. | |
Digital Media Market Analysis by Mordor Intelligence
Digital media market size in 2026 is estimated at USD 1.02 trillion, growing from 2025 value of USD 0.92 trillion with 2031 projections showing USD 1.71 trillion, growing at 10.86% CAGR over 2026-2031. Demand accelerates as connected devices proliferate, 5G coverage widens, and artificial intelligence (AI) personalizes user journeys. Short-form video, free ad-supported streaming television (FAST), and creator-led advertising pull incremental spending toward digital channels. Platform operators are countering subscription fatigue by rolling out lower-priced, ad-supported tiers, while advertisers increase video budgets in response to improved cross-platform measurement. North America currently commands the largest slice of the digital media market, yet Asia-Pacific drives the steepest growth curve as mobile-first habits spread.
Key Report Takeaways
- By content type, video captured 56.70% of the digital media market share in 2025, whereas immersive formats are projected to log an 17.35% CAGR through 2031.
- By platform, smartphones held 45.40% of the digital media market size in 2025; XR/VR devices are on track for 19.1% CAGR between 2026-2031.
- By business model, advertising-supported formats generated 61.30% of 2025 revenue, while hybrid tiers combining ads and subscriptions are forecast to grow at 13.6% CAGR to 2031.
- By industry vertical, entertainment accounted for 39.40% of the digital media market size in 2025, while healthcare applications are expected to post a 14.6% CAGR over the forecast horizon.
- By geography, North America led with 34.60% of the digital media market share in 2025; Asia-Pacific is poised to expand at a 13.2% CAGR through 2031.
Note: Market size and forecast figures in this report are generated using Mordor Intelligence’s proprietary estimation framework, updated with the latest available data and insights as of 2026.
Global Digital Media Market Trends and Insights
Drivers Impact Analysis*
| Driver | (~) % Impact on CAGR Forecast | Geographic Relevance | Impact Timeline |
|---|---|---|---|
| Mobile-First Consumption Surge in Emerging Asia (5G + Affordable Data) | +1.8% | APAC core, spill-over to MEA | Medium term (~ 3-4 years) |
| FAST (Free Ad-Supported TV) Channel Proliferation in North America | +1.2% | North America, expanding to Europe | Short term (≤ 2 years) |
| Creator-Economy Monetisation Tools Accelerating SME Advertising Demand | +0.9% | Global, strongest in North America and APAC | Medium term (~ 3-4 years) |
| AI-Driven Hyper-personalisation Elevating Engagement and CPMs | +1.5% | Global, led by North America and Europe | Medium term (~ 3-4 years) |
| Cross-platform Measurement Standards Boosting Brand ROI Confidence in Europe | +0.7% | Europe, North America | Short term (≤ 2 years) |
| OTT Sports Rights Bidding Intensifying Premium Subscription Uptake in MENA | +0.6% | MENA, with expansion to APAC | Medium term (~ 3-4 years) |
| Source: Mordor Intelligence | |||
Mobile-first consumption reshapes Asian digital landscape
Rapid 5G rollouts and affordable data plans have pushed mobile internet penetration to 63% across Asia-Pacific. [1]GSMA, “The State of Mobile Internet Connectivity 2024,” gsma.com India illustrates the shift, with mobile devices overtaking television for media spends in 2024. Short-form vertical video now dominates viewing time, encouraging studios to prioritize mobile-optimized storytelling. Although 5G adoption accelerates, 4G remains prevalent, underscoring the headroom still available for higher-bandwidth services. Advertisers are reallocating budgets toward creator-led mobile inventory to catch incremental reach in growth markets.
FAST channels redefine streaming economics in North America
The United States hosted more than 1,900 FAST channels by 2024, a 214% jump from 2020. Studios leverage these services to offset subscription fatigue and monetize back catalogs without paywall barriers. Advertisers value FAST for delivering premium, full-screen inventory at competitive CPMs while reaching cord-cutting households. Live news has emerged as a cornerstone, representing 69% of FAST news outlets. The model’s momentum is prompting global distributors to package curated linear experiences within on-device hubs.
AI-driven hyper-personalization elevates engagement
AI engines now adjust thumbnails, sequencing, and ad pods in real time, lifting watch-time metrics and click-through rates. Personalization can lower customer acquisition costs by up to 50% and raise revenue 5-15% for platforms that execute well. In advertising, machine-learning models optimize creative rotation against probabilistic purchase intent, heightening return on spend. Super-aggregation portals employing AI to search across subscriptions are easing content discovery, thereby reducing churn. Investment in proprietary recommendation engines has become a critical competitive lever.
Creator-economy tools unlock SME advertising demand
More than 200 million people now identify as content creators, and low-cost AI video editors have democratized production workflows. Small businesses tap influencer storefronts, tipping functions, and programmatic self-service dashboards to reach niche communities previously inaccessible through mass media. India’s digital ad market, for instance, grew 29% year on year in FY 2024-25 as SMEs redirected budgets from linear television toward creator channels. The resulting long-tail inventory broadens the digital media market by attracting advertisers with modest budgets yet high conversion expectations.
Restraints Impact Analysis*
| Restraint | (~) % Impact on CAGR Forecast | Geographic Relevance | Impact Timeline |
|---|---|---|---|
| Escalating Content-Acquisition Costs Compressing Margins | -1.3% | Global, most acute in North America | Short term (≤ 2 years) |
| Browser and Identifier Deprecation Limiting Third-Party Ad-Targeting | -0.9% | Global, led by Europe and North America | Medium term (~ 3-4 years) |
| Rising Subscription Fatigue Among Gen-Z Audiences | -1.1% | Global, particularly in mature markets | Medium term (~ 3-4 years) |
| Fragmented Rights Management Regulations in Multi-territory Deals | -0.6% | Global, most complex in Europe | Long term (≥ 5 years) |
| Source: Mordor Intelligence | |||
Escalating content costs compress margins
Streaming platforms reignited bidding wars for premium series and live sports, driving programming budgets higher in 2025. To offset the squeeze, operators raised prices, introduced ads, and enforced password rules—moves that risk accelerating churn. Mid-tier services lacking scale face tougher economics, encouraging partnerships and catalog licensing to spread amortization across wider footprints.
Subscription fatigue tempers growth
More than 60% of US streamers reported canceling at least one service during 2024. Price hikes averaging 25% worsened the sentiment. Younger viewers gravitate toward bundles that combine video, music, and gaming, signaling appetite for aggregation instead of standalone subscriptions. Providers are countering with lower-priced ad tiers and cross-service discounts, yet the balancing act between revenue per user and retention remains delicate.
*Our forecasts treat driver/restraint impacts as directional, not additive. The impact forecasts reflect baseline growth, mix effects, and variable interactions.
Segment Analysis
By Content Type: Video Commands Scale, Immersive Builds Momentum
Video generated 56.70% of 2025 revenue within the digital media market, giving it the largest footprint among content formats. Live sports streaming, short-form clips, and cinematic originals all underpin its heft. The digital media market size for immersive formats is projected to climb at an 17.35% CAGR through 2031 as consumer-grade headsets fall below the USD 500 threshold and enterprise pilots migrate into production. Growth is amplified by medical use cases, where regulators have cleared 69 AR/VR devices to date.
Rising adoption of volumetric capture tools allows studios to repurpose assets across both flat-screen and extended-reality experiences, improving return on production spend. Meanwhile, podcast networks and audiobook platforms report steady listener gains, pointing to cross-format consumption that complements video rather than cannibalizes it. Text-based media remains resilient in education and reference niches, underscoring how diversified consumption patterns sustain overall digital media market growth.


By Platform: Smartphones Dominate, XR/VR Devices Accelerate
Smartphones accounted for 45.40% of 2025 usage hours across the digital media market, reflecting 4.7 billion global mobile internet users. Mobile watch-time continues to rise as 5G lowers latency and data caps expand. Computers retain relevance for productivity and high-fidelity streaming, channeling 43% of web traffic.
XR/VR wearables post the fastest platform growth, at 19.1% CAGR to 2031, buoyed by advances in Wi-Fi 7 that slash latency below 5 milliseconds. A newly issued US patent enables continuous gesture inputs for hands-free navigation, signaling user-experience refinements that could broaden mass-market appeal. Smart-TV operating systems, led by Samsung’s Tizen at 12.9% share, remain core living-room gateways, bridging linear sensibilities with on-demand libraries.
By Business Model: Ads Lead, Hybrids Surge
Advertising-supported models contributed 61.30% of 2025 revenue, demonstrating sustained advertiser appetite and consumer price sensitivity. Internet ad spend hit USD 259 billion, with digital video climbing 19.2% in the same year. The digital media industry nevertheless sees increasing reliance on hybrid constructs that blend subscription benefits with occasional ads; this structure is forecast to chart a 13.6% CAGR through 2031 as platforms chase diversified monetization.
Pure subscription growth slows amid saturation, yet bundling initiatives and loyalty perks aim to keep average revenue per user stable. Transactional pay-per-view remains relevant for marquee events but yields a shrinking slice of the digital media market size as recurring models proliferate.

By Industry Vertical: Entertainment Leads, Healthcare Gains Speed
Entertainment generated 39.40% of 2025 spending, driven by premium series and blockbuster gaming releases. Studios are optimizing distribution windows to maximize ad and subscription income across FAST, SVOD, and theatrical release cycles. Healthcare, in contrast, though smaller, records the highest trajectory at a 14.6% CAGR, fueled by telemedicine platforms, wellness apps, and immersive therapeutic tools. Physicians increasingly rely on digital search and video explainers for in-practice education, broadening pharmaceutical engagement opportunities.
Retail media networks, BFSI tutorials, and government service portals round out demand, illustrating how diversified verticals reinforce the digital media market. As sector-specific standards tighten—for instance, IAB’s retail media measurement guidelines—brands gain confidence in channel effectiveness, unlocking incremental budgets.
Geography Analysis
North America retained 34.60% of 2025 revenue within the digital media market, anchored by deep broadband penetration and the gravitational pull of major platform headquarters. The United States alone booked USD 380 billion in ad sales, buoyed by consumer goods and technology categories.
Asia-Pacific is the fastest-growing region, forecast at 13.2% CAGR to 2031. China powers more than half of regional ad expenditure, with cultural enterprises logging 5.9% year-on-year revenue gains in the first three quarters of 2024. Mobile-led economies such as Indonesia and Vietnam continue to register double-digit data-traffic growth, reinforcing localized creator ecosystems.
Europe blends advanced infrastructure with strong consumer privacy regimes. The rollout of unified cross-platform measurement standards—exemplified by Comscore Campaign Ratings integration—is improving transparency and return-on-investment calculations. Regulatory coherence, propelled by the Digital Services Act, should unfreeze budgets previously held back by attribution concerns, further enlarging the regional digital media market.
Latin America and the Middle East and Africa show varied adoption curves. MENA’s surge in premium sports streaming demonstrates how exclusive rights can fast-track subscription uptake; meanwhile, Brazil’s dense social-media penetration underscores mobile video’s role as the principal engagement vehicle. Infrastructure upgrades and localized payment solutions remain critical to sustaining momentum in these emerging territories.
Mordor Intelligence provides coverage of the digital media market across other key regional markets. Detailed country-level analysis extends to Indonesia incorporating local coverage and market participation, as required.

Competitive Landscape
The digital media market features a blend of concentrated and fragmented arenas. Search, short-form social, and e-commerce skew oligopolistic, whereas content production, podcasting, and specialty platforms remain open to challengers. Competitive intensity escalates as technology majors pursue vertical integration—Amazon’s USD 47 billion ad services line and live sports innovation on Prime Video exemplify the tactic.
AI adoption shapes differentiation strategies. Netflix fine-tunes thumbnails and previews using proprietary algorithms, while Spotify applies predictive analytics to surface relevant podcasts. Advertisers respond by allocating larger budgets to ecosystems offering granular targeting and closed-loop attribution. Concurrently, privacy-preserving identity solutions gain traction as third-party cookies sunset, presenting white-space opportunities for independent vendors.
Mergers, content-licensing coalitions, and scaled ad-tech partnerships illustrate defensive and offensive moves to shore up bargaining power. Roku, reporting 89.8 million streaming households and 35.8 billion quarterly viewing hours, leverages operating-system reach to secure premium inventory for its demand-side platform. Smaller services increasingly license catalogues to larger aggregators, trading exclusivity for distribution depth.
Digital Media Industry Leaders
Alphabet Inc. (Google)
Meta Platforms Inc.
Amazon.com Inc.
Netflix Inc.
Walt Disney Company
- *Disclaimer: Major Players sorted in no particular order

Recent Industry Developments
- May 2025: Wearable Devices Ltd. secured a U.S. patent for gesture-based continuous control technology aimed at AR/VR interfaces, widening hands-free interaction options.
- April 2025: IAB’s annual report confirmed internet advertising revenue reached USD 259 billion in 2024, with digital video up 19.2%.
- March 2025: Roku disclosed 89.8 million streaming households and 35.8 billion viewing hours for Q1 2025, underscoring the platform’s engagement scale.
- January 2025: IAB and MRC issued retail media measurement guidelines that define transparency and accuracy benchmarks for the fast-growing channel.
- October 2024: GSMA reported that 4.6 billion people—57% of the world’s population—used mobile internet in 2023, with most new users located in low- and middle-income nations.


Global Digital Media Market Report Scope
The digital media market includes diverse offerings, such as digital content (encompassing videos, music, images, and text), digital advertising, and social media platforms.
The study tracks the revenue accrued through the sale of digital media products by various players across the globe. The study also tracks the key market parameters, underlying growth influencers, and major vendors operating in the industry, which supports the market estimations and growth rates over the forecast period. The study further analyses the overall impact of COVID-19 aftereffects and other macroeconomic factors on the market. The report’s scope encompasses market sizing and forecasts for the various market segments.
The digital media market is segmented by content type (video, audio, text, images, and others), platform (smartphone, television, computer, tablets, and others), industry vertical (entertainment, retail & e-commerce, healthcare, government, BFSI, telecom, automotive, hospitality, non-profit organizations, publishing, and others), and geography (North America, Europe, Asia Pacific, Middle East & Africa, and Latin America). The market sizes and forecasts regarding value (USD) for all the above segments are provided.
| Video |
| Audio |
| Text/E-books |
| Still Images/Graphics |
| Interactive and Immersive (AR/VR/Metaverse) |
| Smartphones |
| Television (Smart and Connected) |
| Computers/Laptops |
| Tablets and Hybrid PCs |
| XR/VR Devices and Wearables |
| Advertising-Supported |
| Subscription (SVOD, AVOD-Lite) |
| Transactional / Pay-Per-View / Download-to-Own |
| Hybrid and Bundled Models |
| Entertainment and Media |
| Retail and E-commerce |
| Healthcare and Pharma |
| Government and Public Sector |
| BFSI |
| Telecom and IT Services |
| Others (Automotive and Mobility, Hospitality and Travel, Education and EdTech, Non-Profit and Advocacy Groups) |
| North America | United States |
| Canada | |
| Mexico | |
| South America | Brazil |
| Argentina | |
| Rest of South America | |
| Europe | Germany |
| United Kingdom | |
| France | |
| Italy | |
| Spain | |
| Rest of Europe | |
| Asia-Pacific | China |
| Japan | |
| South Korea | |
| India | |
| Australia | |
| New Zealand | |
| Rest of Asia-Pacific | |
| Middle East and Africa | United Arab Emirates |
| Saudi Arabia | |
| South Africa | |
| Rest of Middle East and Africa |
| By Content Type | Video | |
| Audio | ||
| Text/E-books | ||
| Still Images/Graphics | ||
| Interactive and Immersive (AR/VR/Metaverse) | ||
| By Platform | Smartphones | |
| Television (Smart and Connected) | ||
| Computers/Laptops | ||
| Tablets and Hybrid PCs | ||
| XR/VR Devices and Wearables | ||
| By Business Model | Advertising-Supported | |
| Subscription (SVOD, AVOD-Lite) | ||
| Transactional / Pay-Per-View / Download-to-Own | ||
| Hybrid and Bundled Models | ||
| By Industry Vertical (Enterprise Use-Cases) | Entertainment and Media | |
| Retail and E-commerce | ||
| Healthcare and Pharma | ||
| Government and Public Sector | ||
| BFSI | ||
| Telecom and IT Services | ||
| Others (Automotive and Mobility, Hospitality and Travel, Education and EdTech, Non-Profit and Advocacy Groups) | ||
| By Geography | North America | United States |
| Canada | ||
| Mexico | ||
| South America | Brazil | |
| Argentina | ||
| Rest of South America | ||
| Europe | Germany | |
| United Kingdom | ||
| France | ||
| Italy | ||
| Spain | ||
| Rest of Europe | ||
| Asia-Pacific | China | |
| Japan | ||
| South Korea | ||
| India | ||
| Australia | ||
| New Zealand | ||
| Rest of Asia-Pacific | ||
| Middle East and Africa | United Arab Emirates | |
| Saudi Arabia | ||
| South Africa | ||
| Rest of Middle East and Africa | ||


Key Questions Answered in the Report
What is the current value of the digital media market?
The digital media market is valued at USD 1.02 trillion in 2026 and is projected to reach USD 1.71 trillion by 2031.
Which region is growing fastest in digital media spend?
Asia-Pacific leads growth with a forecast 13.20% CAGR through 2031, fueled by mobile-first usage and expanding middle-class demographics.
How are platforms addressing subscription fatigue?
Providers introduce ad-supported tiers, bundle complementary services, and experiment with flexible pricing to retain users while maintaining revenue.
Why are FAST channels important to advertisers?
FAST delivers premium, full-screen inventory at competitive CPMs, reaching both cord-cutters and traditional TV audiences without subscription barriers.
Which content format is expanding quickest after video?
Immersive formats—AR, VR, and interactive 3D—are forecast to grow at an 17.35% CAGR between 2026-2031 due to lower hardware costs and new enterprise use cases.
What role does AI play in digital media monetization?
AI personalizes recommendations, optimizes ad placements, and reduces acquisition costs, contributing up to a 1.5-percentage-point lift in forecast CAGR for the market.
Page last updated on:


