Smart Advertising Services Market Size and Share
Market Overview
| Study Period | 2019 - 2030 |
|---|---|
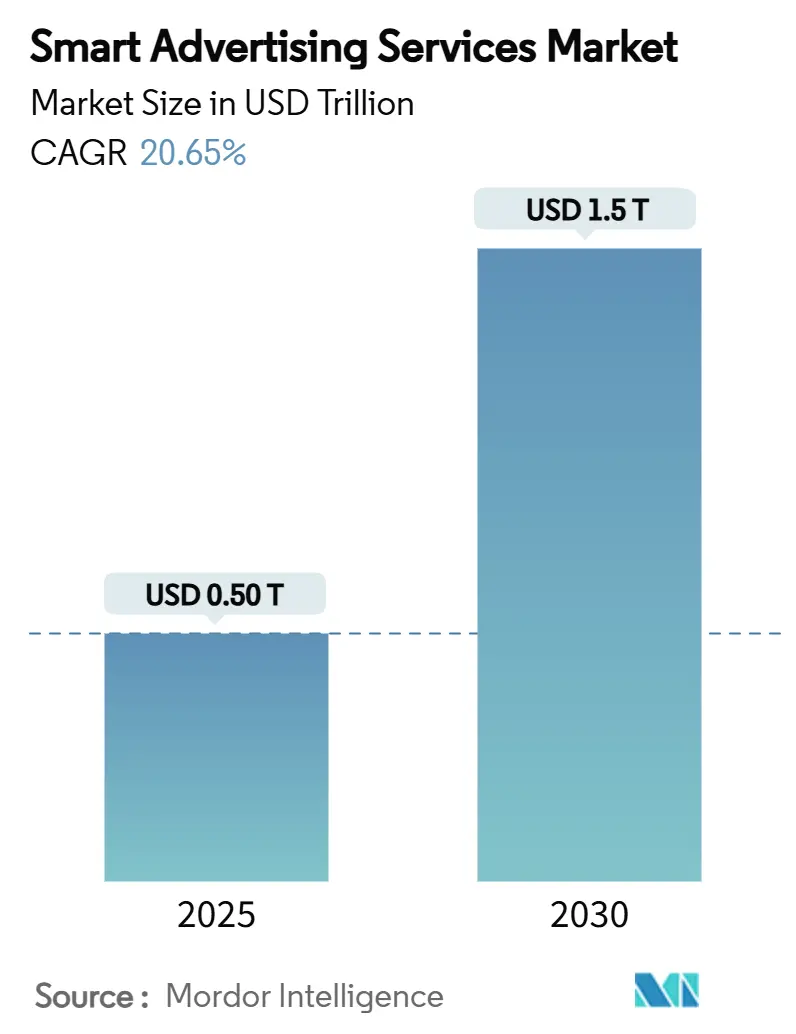
| Market Size (2025) | USD 0.50 Trillion |
| Market Size (2030) | USD 1.5 Trillion |
| Growth Rate (2025 - 2030) | 20.65% CAGR |
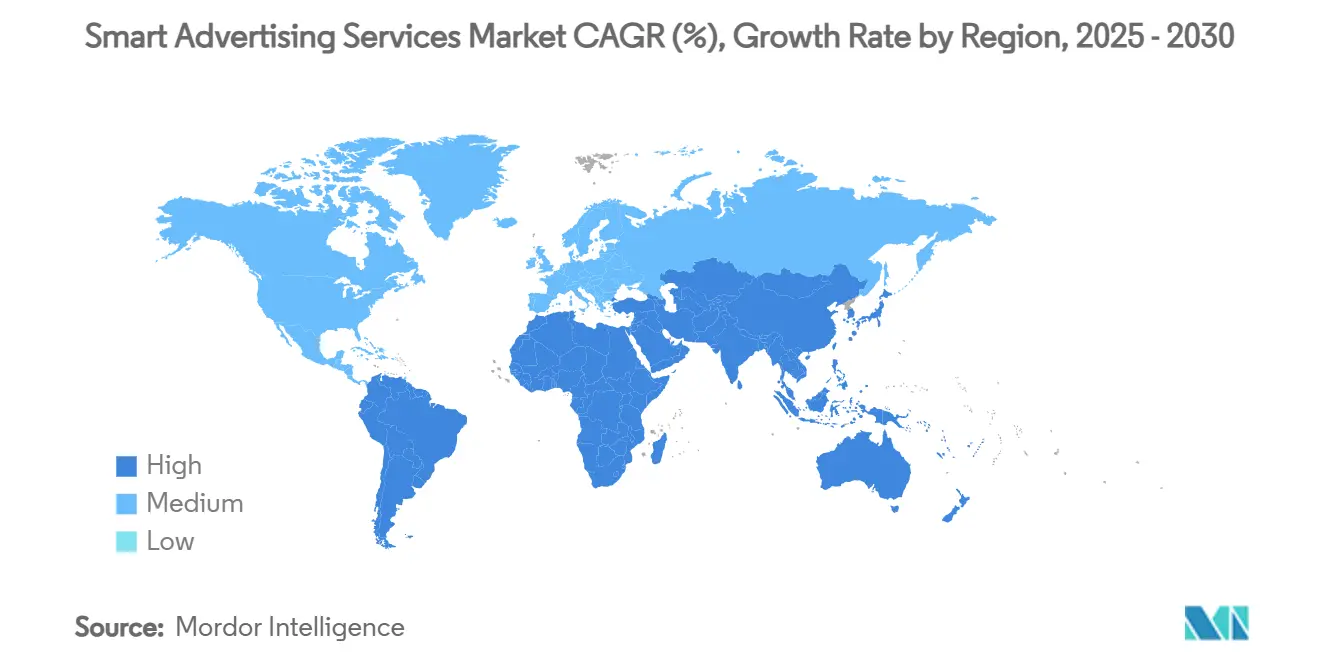
| Fastest Growing Market | Asia |
| Largest Market | North America |
| Market Concentration | Medium |
Major Players *Disclaimer: Major Players sorted in no particular order Image © Mordor Intelligence. Reuse requires attribution under CC BY 4.0. | |
Smart Advertising Services Market Analysis by Mordor Intelligence
The Smart Advertising Services Market size is estimated at USD 0.50 trillion in 2025, and is expected to reach USD 1.5 trillion by 2030, at a CAGR of 20.65% during the forecast period (2025-2030).
Programmatic bidding that relies on artificial intelligence is scaling rapidly because brands can adjust campaigns in real time and reduce wasted impressions. [2]Google LLC, “Performance Max: AI Unlocks New Demand,” about.google Growth in 5G subscriber bases across Asia is lifting mobile video ad viewability, which in turn is pushing up priced-in CPMs. Retail media networks in North America are converting first-party checkout and loyalty data into addressable inventory, attracting performance-oriented advertisers despite higher cost-per-action fees.[3]Amazon Advertising LLC, “First-Party Insights Power Retail Media,” advertising.amazon.com Browser-level depreciation of third-party cookies is steering budgets toward contextual algorithms and privacy-preserving cohort models, strengthening publishers that can demonstrate compliant data flows. In Europe, connected-TV adoption is opening inventory for addressable linear and on-demand placements that mirror digital targeting precision while retaining the reach of prime-time TV.
Key Report Takeaways
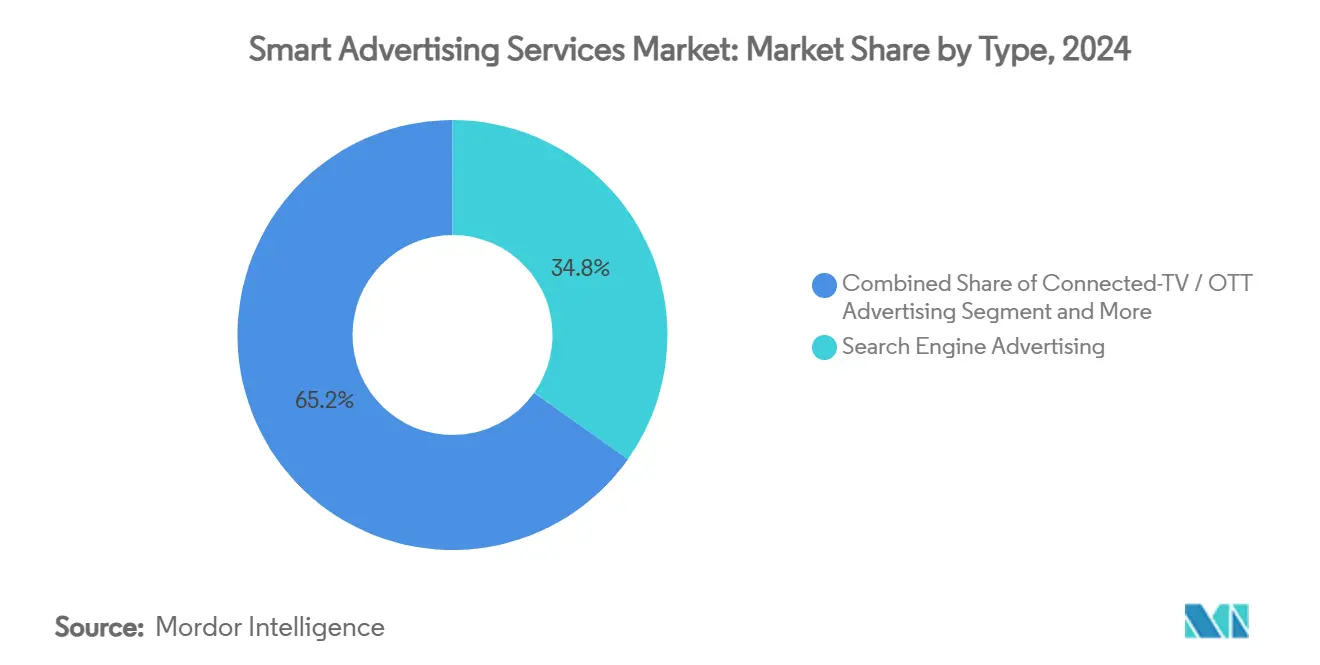
- By type, search engine advertising held 34.8% of the smart advertising services market share in 2024, whereas connected-TV/OTT advertising is forecast to post a 28.7% CAGR through 2030.
- By platform, combined mobile web and in-app channels commanded 69.2% of the smart advertising services market size in 2024; connected-TV is set to grow at a 26.4% CAGR to 2030.
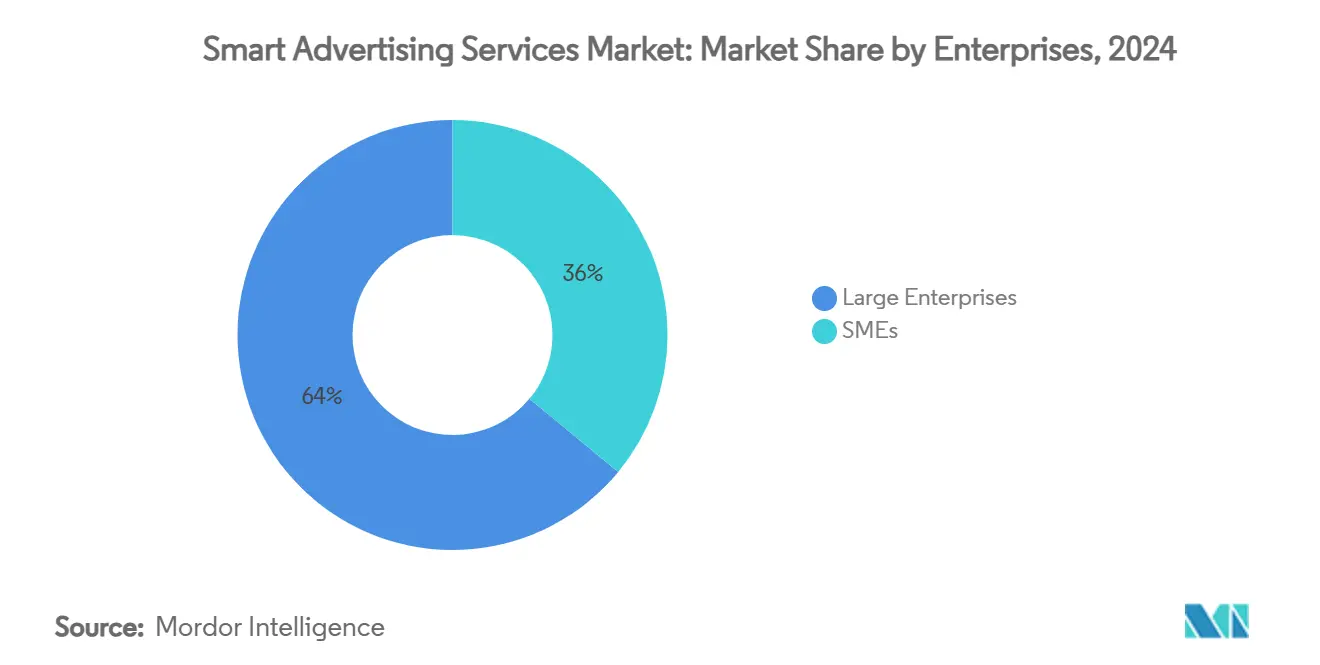
- By enterprise segment, large enterprises contributed 64% of 2024 revenue, while SMEs are anticipated to record a 24.3% CAGR between 2025 and 2030.
- By end user, retail and e-commerce generated a 21.5% revenue share in 2024, and healthcare and pharma is projected to expand at a 25.6% CAGR in the forecast window.
- By geography, North America represented 40.2% of 2024 revenue; Asia-Pacific is expected to advance at a 23.8% CAGR to 2030.
Global Smart Advertising Services Market Trends and Insights
Drivers Impact Analysis*
| Driver | (~) % Impact on CAGR Forecast | Geographic Relevance | Impact Timeline |
|---|---|---|---|
| AI-driven programmatic ad buying | +3.0% | Global | Long term (≥ 4 years) |
| 5G-enabled mobile video growth | +2.4% | Asia-Pacific | Medium term (2-4 years) |
| Retail-media networks monetising first-party data | +1.8% | North America | Short term (≤ 2 years) |
| Cookie deprecation spurring contextual targeting | +2.1% | Europe and North America | Medium term (2-4 years) |
| Connected-TV penetration enabling addressable TV campaigns | +1.6% | Europe | Medium term (2-4 years) |
| Generative-AI-powered dynamic-creative optimisation | +1.2% | Global | Long term (≥ 4 years) |
| Source: Mordor Intelligence | |||
Growing Deployment of AI-Driven Programmatic Ad Buying Optimising Spend
Demand-side platforms are integrating large-language-model-based optimisation layers that parse millions of bid signals in sub-second windows, letting buyers fine-tune frequency caps and creative rotations without manual rules. This capability cuts inefficient impressions and lifts return on ad spend, encouraging brands to divert budget from static network buys into the smart advertising services market. Supply-side partners benefit as well because smarter bidding raises fill rates for mid-tail publishers whose inventory was historically undervalued. Global agencies have begun embedding proprietary artificial neural nets into trading desks, lowering human labour costs and generating predictive segments from consented data. The resulting workflow improvements are persuading procurement teams that the smart advertising services market can deliver measurable savings over analogue direct-buy models. As a result, forward-thinking advertisers allocate a growing fraction of top-of-funnel spend to AI-ready pipes, reinforcing the flywheel for demand-side and supply-side technology integration
5G-Enabled Mobile Video Boom in Asia Unlocking Real-Time Ad Inventory
Operators in China, Japan, South Korea and India crossed 900 million cumulative 5G subscriptions in early 2025, and average download speeds now exceed 350 Mbps in tier-one urban markets. The bandwidth jump reduces buffering, which lifts completion rates on rich-media pre-roll and rewarded in-app placements. Publishers can therefore charge premium CPMs and still deliver brand-safe experiences, compelling regional buyers to shift linear TV allocations into the smart advertising services market. Higher throughput also makes real-time creative substitution feasible at scale, allowing location-aware ads during live sports streams. DSPs that aggregate carrier-grade audience identifiers gain fresh privacy-compliant signals, improving look-alike models for regional brands. As telco-media joint ventures expand edge-compute nodes, latency drops further, enabling true interactive video formats that commercial broadcasters could not support on 4G. The totality of these network-driven gains accelerates revenue growth for both walled-garden super-apps and independent apps funded by advertising.
Retail Media Networks Monetising First-Party Data in North America
Major omni-channel retailers in the United States and Canada have converted point-of-sale and loyalty data sets into closed-loop ad platforms, offering deterministic attribution that rivals traditional performance channels. Brands targeting last-mile conversion are willing to pay cost-per-click premiums of 30% compared with generic search because they can link impressions to verified purchase receipts. The arrangement also lets retailers claim a growing share of co-op marketing budgets, adding a lucrative margin stream that offsets thin grocery profits. Those mechanics channel incremental spend into the smart advertising services market as agencies reallocate lower-funnel dollars. Platform expansions into off-site inventory through demand-side platform partnerships extend reach while maintaining retailer data control. This hybrid activation, paired with robust measurement dashboards, widens adoption among non-endemic advertisers such as financial-services providers eager for deterministic shopper insights.
Cookie Deprecation Accelerating Contextual and Cohort-Based Targeting Adoption
Chrome’s phased blocking of third-party cookies in 2025 is forcing advertisers to rebuild user-level profiling mechanisms. Contextual engines that map on-page semantics to brand-safe topics are attracting renewed demand, strengthening premium publisher yields. Parallel efforts like Google’s Topics API allow cohort-level segments that respect user privacy yet retain targeting granularity. Advertisers balancing compliance and performance are therefore pivoting spend toward cookieless formats offered by the smart advertising services market. Measurement firms integrate publisher log-level data with cleanroom technologies to maintain cross-channel reach and frequency controls without exposing personal data. As regulators scrutinise consent flows, the ecosystem gravitates toward transparent taxonomies, improving buyer confidence and sustaining media investment in privacy-oriented solutions.
Restraints Impact Analysis*
| Restraint | (~) % Impact on CAGR Forecast | Geographic Relevance | Impact Timeline |
|---|---|---|---|
| EU Digital Services Act limiting behavioural targeting | -1.9% | Europe | Short term (≤ 2 years) |
| Rising mobile in-app ad-fraud sophistication | -1.4% | Global | Long term (≥ 4 years) |
| Publisher push-back on retail-media revenue-share models | -1.0% | North America | Medium term (2-4 years) |
| High latency and inventory fragmentation on connected-TV | -0.8% | Global | Short term (≤ 2 years) |
| Source: Mordor Intelligence | |||
EU Digital Services Act 2024 Limiting Behavioural Targeting Capabilities
The Digital Services Act that took effect across the European Union in February 2024 restricts data-processing practices for very large online platforms, including explicit bans on sensitive-category personalised ads. To comply, platforms must add consent gating and reduce micro-targeting precision, which drops effective CPMs on high-value inventory. SME advertisers who relied on performance retargeting experience immediate campaign-level ROI erosion, reducing their spend in the smart advertising services market. Publishers face yield pressure as behavioural segments lose depth, prompting heavier reliance on contextual intelligence or aggregated cohort solutions that recover only part of the lost value. Until common technical frameworks stabilise and legal interpretations settle, risk-averse brands curtail European programmatic budgets, dampening near-term market momentum.
Rising Mobile In-App Ad-Fraud Sophistication Eroding ROI
Fraud rings now weaponise generative adversarial networks to create synthetic device fingerprints and to mimic human swipe patterns, bypassing standard invalid-traffic filters. As a result, advertisers deploying user-acquisition budgets via cost-per-install models observe inflated conversion dashboards, only to face post-install churn spikes. Verification vendors respond with server-side SDK attestation, but coverage gaps persist across fragmented long-tail app stores. The threat drives cautious buyers to shift allocations toward closed ecosystems with proven anti-fraud protocols, trimming open-exchange growth within the smart advertising services market. App publishers bear heavier integration costs and must accept third-party measurement tags, increasing operational complexity. Persistent fraud ultimately raises average customer-acquisition costs, slowing spend expansion in susceptible verticals such as casual gaming and fintech.
*Our forecasts treat driver/restraint impacts as directional, not additive. The impact forecasts reflect baseline growth, mix effects, and variable interactions.
Segment Analysis
By Type: Search Dominance Meets OTT Acceleration
The search engine advertising segment produced the largest slice of 2024 revenue, capturing 34.8% of the smart advertising services market share as multiformat queries on mobile remained the most dependable intent signal. Brand marketers prize predictable keyword auctions that deliver measurable short-cycle conversions; therefore, search continues to anchor omnichannel strategies despite rising cost-per-click benchmarks. Cross-channel attribution studies indicate that sponsored search still contributes one out of every four incremental online purchases in mature digital economies. Simultaneously, voice-activated queries embedded in connected appliances are enlarging net query volume, keeping the growth trajectory intact. The segment’s head start in zero-click product listings further solidifies its influence over retail funnel entry points.
Connected-TV/OTT advertising, though smaller in absolute terms, delivers the fastest growth, estimated at a 28.7% CAGR through 2030. Inventory scarcity on premium long-form content incentivises networks to expand ad pods, yet strict frequency capping retains favourable viewer sentiment. Addressable overlays paired with household graph data make linear budgets fungible, pushing incremental spend into the smart advertising services market. Measurement alliances among broadcasters, smart-TV manufacturers and data-cleanroom providers bridge the gap between streaming and traditional rating systems, giving planners renewed confidence in cross-screen reach calculations. Dynamic ad insertion capabilities, facilitated by low-latency ad-serving infrastructure, bolster monetisation for live sports streams, which historically relied on blanket national buys. The interplay of quality inventory, audience addressability and outcome-based pricing keeps OTT on a steep adoption curve even as competition for placement intensifies.


By Platform: Mobile Web and App Hold Reign While CTV Surges
Combined mobile web and in-app channels accounted for 69.2% of the smart advertising services market size in 2024 as audiences spend roughly five hours daily engaging with handheld devices. Always-on presence propels brands to prioritise mobile-first creatives, especially vertical video formats that leverage gesture-based interactivity. The proliferation of mobile wallets co-located with ad SDKs improves conversion tracking, reinforcing budget commitments. Layer-two developer kits enable server-side bidding that reduces header-bidding latency, preserving user experience and boosting auction density. Advanced privacy sandboxes such as Apple’s SKAdNetwork v4 expand campaign analytics while maintaining consent integrity, reassuring regulated verticals such as finance and healthcare.
Connected-TV, representing a smaller revenue base, is forecast to log a 26.4% CAGR between 2025 and 2030. Household adoption curves align with declining cable penetration, widening the addressable streaming footprint. Full-screen lean-back viewing environments promote high viewability and brand recall, persuading CPG and auto advertisers to allocate incremental reach budgets. Device operating systems incorporate certified measurement libraries that mitigate signal loss caused by IP masking, allowing precise ad-delivery verification. Integrations with DSPs bring real-time bidding to traditionally reserved scatter markets, unlocking algorithmic pacing for prime-time slots. Consequently, CTV’s share of the smart advertising services market climbs steadily, supported by both brand-lift metrics and performance-linked shoppable ad units.
By Enterprise Size: Large-Enterprise Budget Scale Meets SME Agility
Large enterprises commanded 64% of 2024 spending, driven by global brands that maintain multi-region always-on campaigns across dozens of channels. Their deep pockets allow investment in custom data-cleanroom infrastructure, which safeguards proprietary customer graphs while enabling precise media modelling. Enterprise procurement teams also negotiate agency retainer contracts that bundle trading-desk services with creative automation, creating economies of scale. High-volume buying qualifies them for preferred programmatic fees, reducing marginal acquisition costs and solidifying their dominance within the smart advertising services market.
Small- and medium-sized enterprises (SMEs) are slated for a 24.3% CAGR through 2030, thanks to self-serve ad portals lowering entry barriers. No-code creative wizards cut production lead times, letting boutique brands ship direct-response campaigns inside a single business day. AI-powered budget recommendation engines interpret real-time auction signals and adjust spend caps automatically, freeing resource-constrained teams from 24/7 optimisation tasks. Vertical-specific templates—such as local services booking flows—compress learning curves, enhancing early ROI and encouraging continued spend. Third-party resellers cushion SMEs from minimum-spend thresholds previously imposed by walled gardens, unlocking fresh demand pockets that expand the smart advertising services market.
By End User: Retail and E-Commerce Lead While Healthcare and Pharma Accelerate
Retail and e-commerce retained a 21.5% revenue share in 2024, channelling performance budgets into sponsored product listings and shoppable live streams that close the sale in a single click. The always-cyclical retail calendar, punctuated by high-intensity events such as Singles’ Day and Cyber Week, sustains year-round advertising velocity. Direct integration between enterprise resource-planning platforms and ad cloud APIs enables real-time inventory-aware bidding, preventing wasted impressions for out-of-stock items. Loyalty-program data enriches predictive audiences, heightening conversion efficiency and reinforcing retail dominance in the smart advertising services market.
Healthcare and pharma advertisers were once constrained by compliance approvals and limited creative variation but will grow market expenditure at a 25.6% CAGR to 2030. Regulatory clarifications issued in late 2024 clarified how patient-level data can be de-identified for cohort activation, unlocking new programmatic inventory previously off-limits. Over-the-counter brands leverage interactive symptom checkers embedded in ad units to drive qualified telemedicine appointments, validating higher CPM bids. AI-generated voiceovers let pharma marketers create multi-language variants rapidly, improving localisation without ballooning production budgets. With disease-awareness initiatives now eligible for broader social-media targeting, the vertical accelerates its presence within the smart advertising services market.
Geography Analysis
North America generated 40.2% of 2024 revenue, buoyed by high credit-card penetration that translates into rich first-party purchase data for targeting. Mature broadband coverage sustains high-definition video streaming, supporting brand storytelling formats. Widespread privacy-law adoption drives cleanroom investment but has not materially slowed budget growth, as advertisers accept stricter data-handling demands in exchange for deterministic outcomes.
Europe remains more fragmented, with disparate language and privacy landscapes forcing granular localisation strategies. GDPR compliance continues to elevate contextual targeting tools, supporting publisher CPMs even as behavioural inventory shrinks. Connected-TV penetration in the United Kingdom, Germany and France fuels addressable spending, compensating for static linear-TV outlays. The EU Digital Services Act introduces short-term friction, yet long-term standardisation promises harmonised safety baselines that ultimately stabilise the smart advertising services market.
Asia-Pacific posts the fastest growth at a 23.8% CAGR, propelled by 5G rollouts, mobile-first consumer behaviour and rising disposable income. Super-apps in China and Southeast Asia aggregate payments, social interaction and content, exposing native ad placements that blur commerce and entertainment. Local regulatory frameworks increasingly mandate data localisation, which stimulates the build-out of regional data-centre capacity and low-latency ad-delivery nodes. India’s Unified Payments Interface and Japan’s high smartphone penetration create fertile ground for performance campaigns, solidifying the region’s role as a key growth frontier for the smart advertising services market.

Competitive Landscape
Competition spans global technology conglomerates such as Google, Meta Platforms and Amazon Advertising, independent demand-side platforms like The Trade Desk, and large agency holding companies that run integrated trading desks. Scale providers leverage proprietary identity graphs and exclusive inventory access to lock in demand, while independents position around transparency and open-internet reach. Consolidation remains active: Magnite acquired SpringServe’s CTV ad-serving stack to deepen its supply-side differentiation, and Roku integrated Shopify transaction data to introduce shoppable TV ads .
Strategic alliances between data-cleanroom vendors and streaming publishers help de-risk paid-media measurement as privacy regulations tighten. Salesforce Marketing Cloud embedded generative-AI copy assistants in March 2025, enabling near-instant creative variation across 30 languages, which enlarges addressable global advertiser pools. Verizon Media (now Yahoo) pushed deeper into native commerce by acquiring discount-code platform Media.net in May 2025, enhancing post-click monetisation for lifestyle publishers.[1]Roku Inc., “CTV Households in Europe Hit 70 Million,” roku.com
Agencies respond by building proprietary algorithmic trading layers atop multiple DSPs, promising unified reach and brand-safety assurances. WPP’s Choreograph data platform signed a multi-year partnership with Walmart Connect in April 2025 to co-develop retail-media measurement standards. Dentsu invested in machine-learning anti-fraud firm TrafficGuard to deepen its brand-protection credentials. Omnicom Group activated a carbon-emission dashboard within its Omni operating system, catering to sustainability-minded advertisers and adding a new decision factor in partner selection within the smart advertising services market.
Smart Advertising Services Industry Leaders
Google LLC
Meta Platforms, Inc.
Amazon Web Services, Inc.
Adobe Inc.
The Trade Desk, Inc.
- *Disclaimer: Major Players sorted in no particular order

Recent Industry Developments
- May 2025: Yahoo Inc. acquired Media.net to enhance its native commerce product suite and deepen publisher revenue streams.
- April 2025: WPP’s Choreograph and Walmart Connect launched a joint cleanroom solution enabling closed-loop attribution for off-site media buys.
- March 2025: Salesforce Marketing Cloud introduced Einstein Generative Copy, an LLM-based creative variation engine integrated across email, social and display modules.
- January 2025: Google completed global rollout of Privacy Sandbox relevance APIs to 100% of Chrome traffic, initiating the final phase of third-party-cookie deprecation.


Global Smart Advertising Services Market Report Scope
Smart advertising services use machine learning and automation to optimize ad campaigns in real-time. It encompass a range of offerings designed to assist businesses in creating and implementing targeted and data-driven advertising.
The smart advertising services market is segmented by type (email advertising, video advertising, search engine advertising, social media advertising, online display advertising, other types), by platform (mobile, desktop and tablets, other platforms), by enterprises (SMEs, large enterprises), by end-users (media & entertainment, BFSI, education, IT & telecom, healthcare, retail, other end-users), by geography (North America, Europe, Asia-Pacific, Latin America, Middle East and Africa). The market sizes and forecasts are provided in terms of value (USD) for all the above segments.
| Email Advertising |
| Video Advertising |
| Search Engine Advertising |
| Social Media Advertising |
| Online Display Advertising |
| Native Advertising |
| In-App Advertising |
| Connected-TV / OTT Advertising |
| Audio / Podcast Advertising |
| Digital Out-of-Home (DOOH) |
| Mobile Web |
| Mobile In-App |
| Desktop and Tablet Web |
| Connected-TV |
| DOOH Screens |
| SMEs |
| Large Enterprises |
| Retail and E-Commerce |
| Media and Entertainment |
| BFSI |
| Travel and Hospitality |
| Healthcare and Pharma |
| IT and Telecom |
| Education |
| Automotive |
| Consumer Packaged Goods (CPG) |
| Other End-users |
| North America | United States |
| Canada | |
| Mexico | |
| South America | Brazil |
| Argentina | |
| Chile | |
| Rest of South America | |
| Europe | Germany |
| United Kingdom | |
| France | |
| Italy | |
| Spain | |
| Rest of Europe | |
| Asia-Pacific | China |
| Japan | |
| South Korea | |
| India | |
| Australia | |
| New Zealand | |
| Rest of Asia-Pacific | |
| Middle East | United Arab Emirates |
| Saudi Arabia | |
| Africa | South Africa |
| Rest of Africa |
| By Type | Email Advertising | |
| Video Advertising | ||
| Search Engine Advertising | ||
| Social Media Advertising | ||
| Online Display Advertising | ||
| Native Advertising | ||
| In-App Advertising | ||
| Connected-TV / OTT Advertising | ||
| Audio / Podcast Advertising | ||
| Digital Out-of-Home (DOOH) | ||
| By Platform | Mobile Web | |
| Mobile In-App | ||
| Desktop and Tablet Web | ||
| Connected-TV | ||
| DOOH Screens | ||
| By Enterprises | SMEs | |
| Large Enterprises | ||
| By End-users | Retail and E-Commerce | |
| Media and Entertainment | ||
| BFSI | ||
| Travel and Hospitality | ||
| Healthcare and Pharma | ||
| IT and Telecom | ||
| Education | ||
| Automotive | ||
| Consumer Packaged Goods (CPG) | ||
| Other End-users | ||
| By Geography | North America | United States |
| Canada | ||
| Mexico | ||
| South America | Brazil | |
| Argentina | ||
| Chile | ||
| Rest of South America | ||
| Europe | Germany | |
| United Kingdom | ||
| France | ||
| Italy | ||
| Spain | ||
| Rest of Europe | ||
| Asia-Pacific | China | |
| Japan | ||
| South Korea | ||
| India | ||
| Australia | ||
| New Zealand | ||
| Rest of Asia-Pacific | ||
| Middle East | United Arab Emirates | |
| Saudi Arabia | ||
| Africa | South Africa | |
| Rest of Africa | ||


Key Questions Answered in the Report
What is the current size of the smart advertising services market?
The Smart Advertising Services Market size is estimated at USD 0.50 trillion in 2025, and is expected to reach USD 1.5 trillion by 2030, at a CAGR of 20.65% during the forecast period (2025-2030).
Which segment holds the largest smart advertising services market share?
Search engine advertising led in 2024 with a 34.8% revenue share, supported by intent-driven keyword buying.
Which platform is growing the fastest within the market?
Connected-TV advertising is expected to record a 26.4% CAGR from 2025 to 2030 as streaming households expand.
Why are retail media networks important for advertisers?
They provide first-party purchase data and closed-loop attribution that improve return on ad spend, attracting more performance budgets.
How does cookie deprecation affect advertisers?
With third-party cookies disappearing, advertisers are pivoting to contextual and cohort-based targeting solutions to maintain reach while complying with privacy rules.
What are the main challenges faced by the smart advertising services industry?
Key challenges include regulatory limits on behavioural targeting in Europe and rising mobile in-app ad fraud that inflates reported campaign performance.
Page last updated on:


