Cloud Advertising Market Size and Share
Market Overview
| Study Period | 2020 - 2031 |
|---|---|
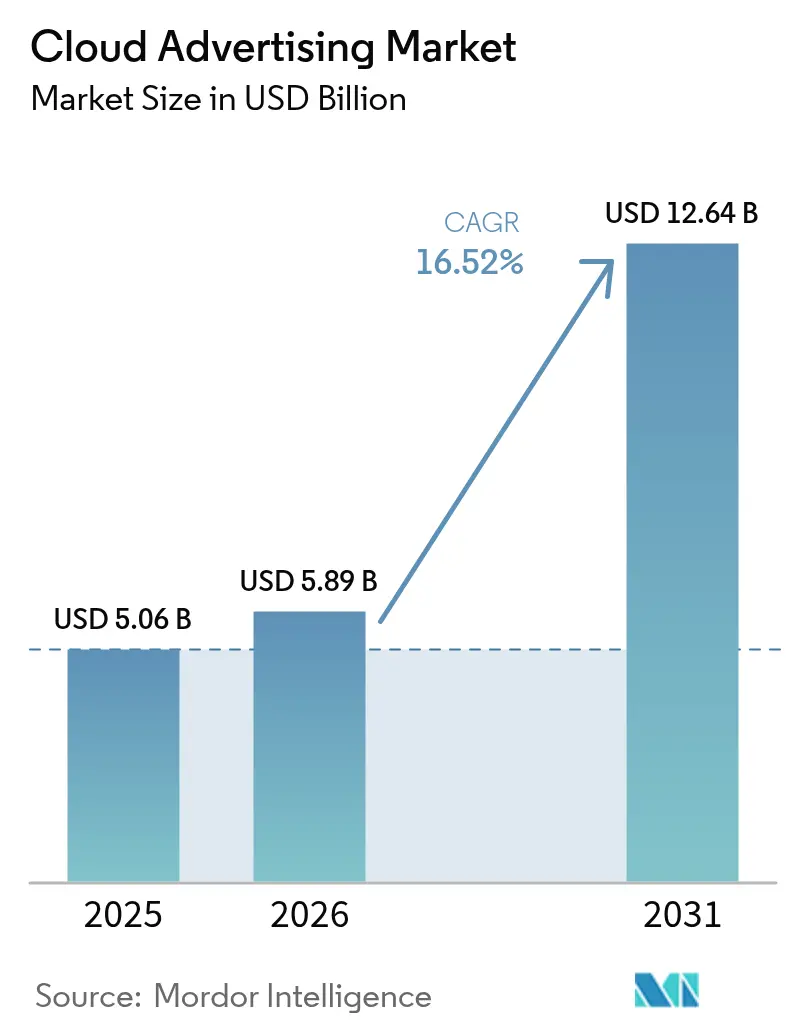
| Market Size (2026) | USD 5.89 Billion |
| Market Size (2031) | USD 12.64 Billion |
| Growth Rate (2026 - 2031) | 16.52% CAGR |
| Fastest Growing Market | Asia |
| Largest Market | North America |
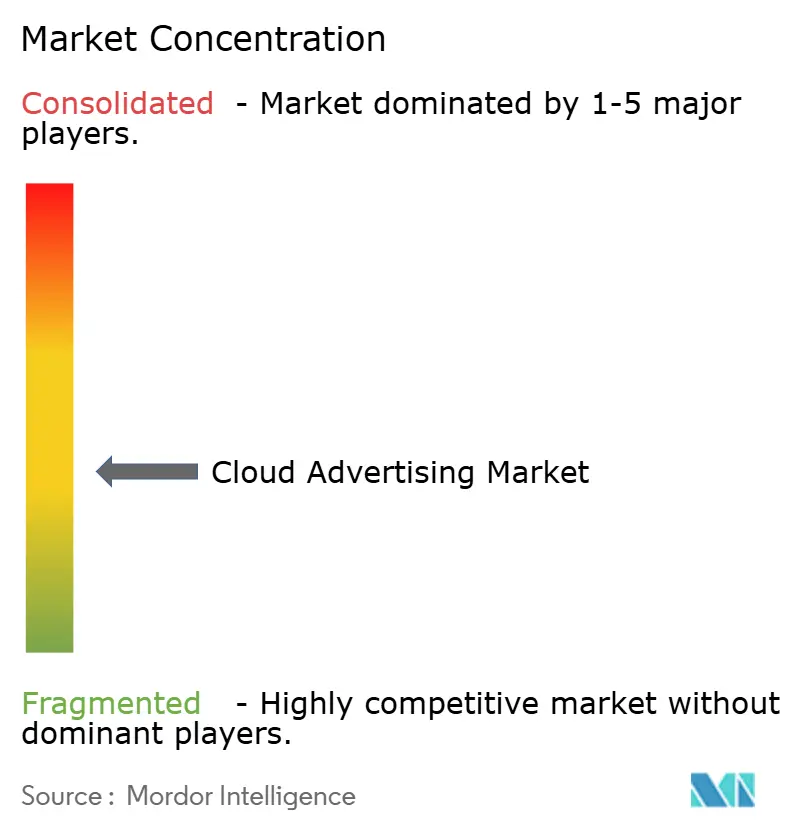
| Market Concentration | Medium |
Major Players *Disclaimer: Major Players sorted in no particular order Image © Mordor Intelligence. Reuse requires attribution under CC BY 4.0. | |
Cloud Advertising Market Analysis by Mordor Intelligence
The cloud advertising market size was valued at USD 5.06 billion in 2025 and estimated to grow from USD 5.89 billion in 2026 to reach USD 12.64 billion by 2031, at a CAGR of 16.52% during the forecast period (2026-2031). Demand accelerates as advertisers trade on-premises stacks for elastic, AI-enabled cloud services that deliver millisecond bidding, real-time analytics, and integrated privacy controls. Each new billion flowing into cloud workloads lifts spending on observability, encryption, and GPU-rich instances, making infrastructure a direct revenue lever. Workloads that manage identity graphs, creative generation, and campaign measurement increasingly run in sovereign or logically isolated regions, pushing hyperscalers to bundle clean-room templates and customer-managed keys into reserved-instance offers. Procurement cycles now involve marketing, legal, and IT in equal measure because campaign agility and regulatory alignment have converged into one negotiation.
Key Report Takeaways
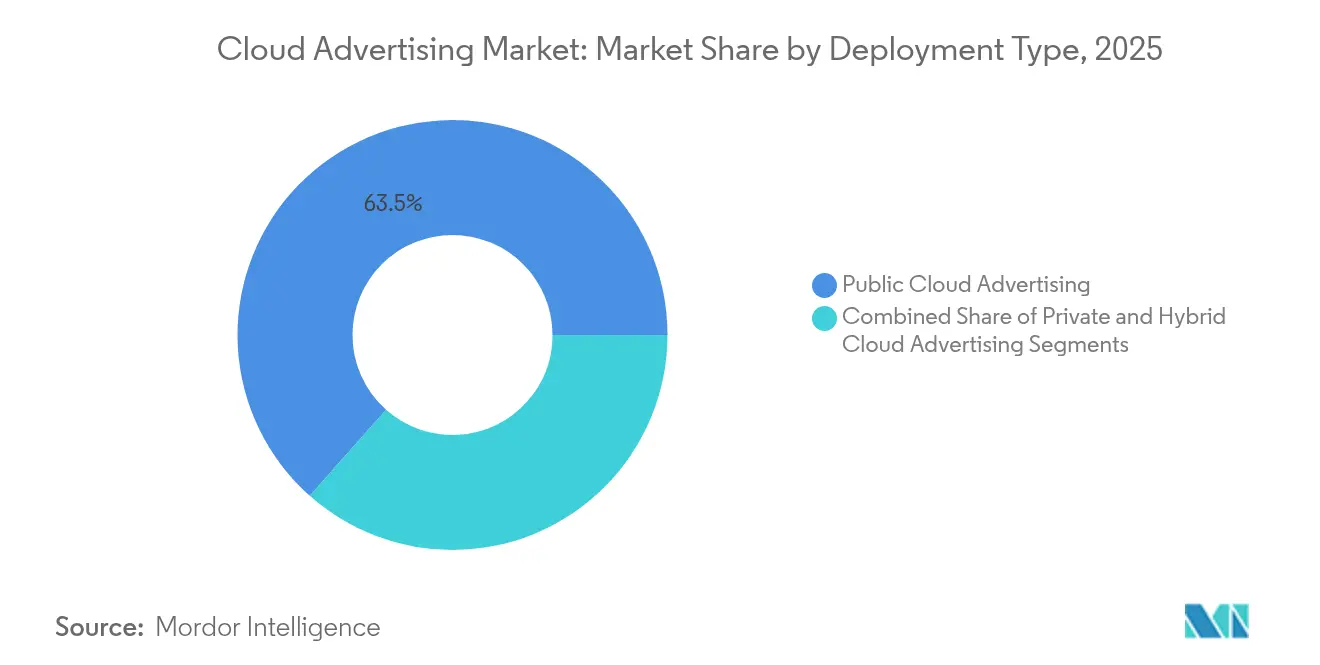
- By deployment type, public-cloud tenants held 63.45% of the cloud advertising market share in 2025, while hybrid-cloud solutions are expanding at a 22.97% CAGR through 2031.
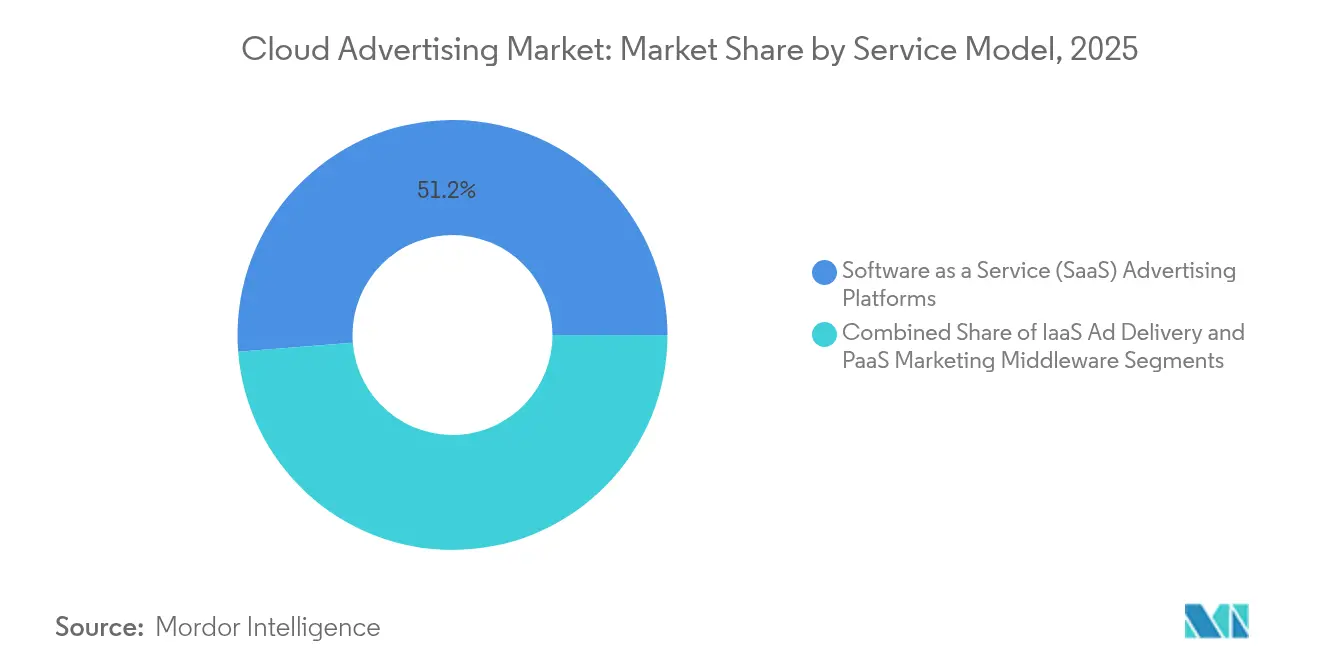
- By service model, software-as-a-service suites accounted for 51.25% of the cloud advertising market size in 2025; platform-as-a-service middleware is advancing at a 21.87% CAGR to 2031.
- By end-user industry, retail & e-commerce led with 23.62% cloud advertising market share in 2025; media & entertainment is projected to grow at a 20.94% CAGR through 2031.
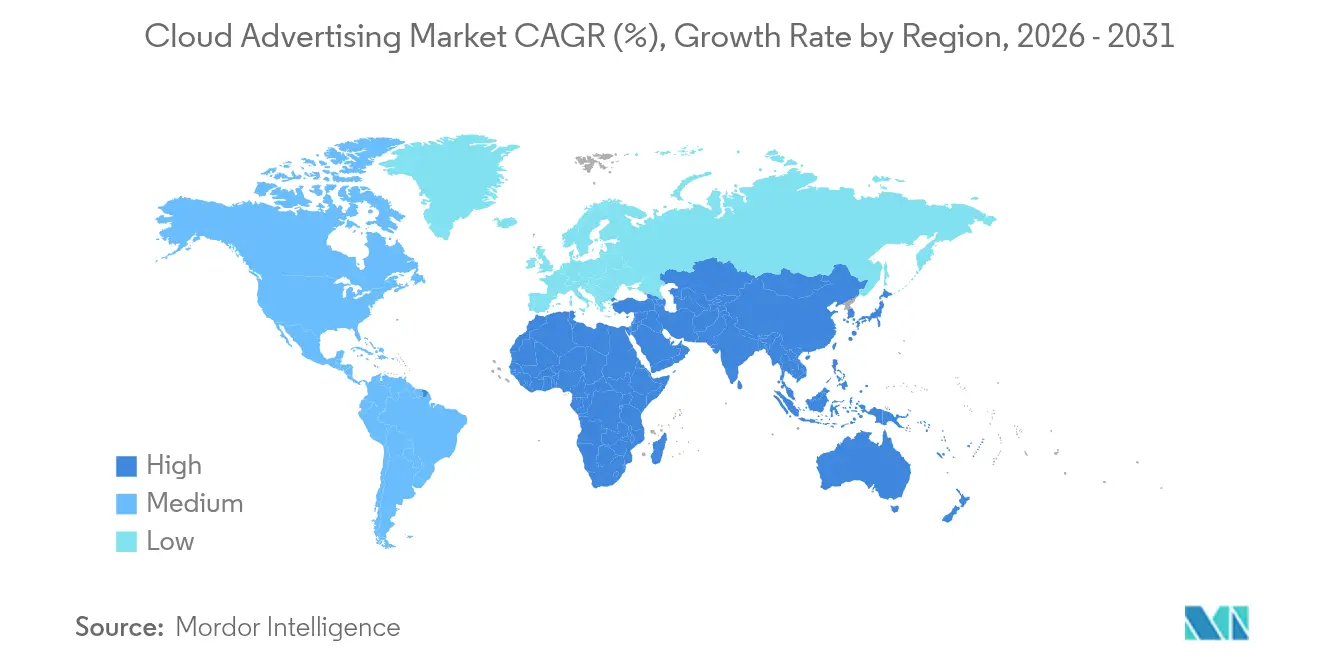
- By geography, North America commanded 37.65% of 2025 revenue, whereas Asia-Pacific is set to grow the fastest at a 19.46% CAGR between 2026 and 2031.
- The three largest vendors together controlled less than 50% of spend in 2024, indicating a moderately concentrated supplier base.
Note: Market size and forecast figures in this report are generated using Mordor Intelligence’s proprietary estimation framework, updated with the latest available data and insights as of 2026.
Global Cloud Advertising Market Trends and Insights
Drivers Impact Analysis*
| Driver | (~) % Impact on CAGR Forecast | Geographic Relevance | Impact Timeline |
|---|---|---|---|
| Public Cloud Adoption by Retail-Media Networks | +4.2% | Global, with concentration in North America | Medium term (3-4 yrs) |
| Privacy-Centric First-Party Data Clean Rooms in Europe | +2.8% | Europe, with spillover to North America | Short term (≤2 yrs) |
| Programmatic Video Boom Fueling Cloud DSP Demand in Asia | +3.5% | Asia-Pacific, with global influence | Medium term (3-4 yrs) |
| Edge-AI Bidding Engines Requiring GPU-Rich IaaS | +3.8% | Global, led by North America and Asia | Long term (≥5 yrs) |
| Generative-AI Creative Suites Driving SaaS Uptake | +2.5% | Global, with early adoption in North America | Medium term (3-4 yrs) |
| SMB eCommerce Expansion in Latin America | +1.8% | Latin America, primarily Brazil and Mexico | Medium term (3-4 yrs) |
| Source: Mordor Intelligence | |||
Public-Cloud Retail-Media Acceleration
Retailers operating large e-commerce storefronts shifted ad-serving code to public clouds in 2024. One marketplace cut flash-campaign launch times by 43% after moving to serverless GPU pools and reported double-digit off-peak cost savings, freeing budget for immersive video formats[1]Amazon Newsroom, “2025 Retail-Media Update,” aboutamazon.com. Hourly inventory-aware promotions have replaced weekly refresh cycles, demonstrating how cloud economics reshape merchandising strategy.
Privacy-Centric First-Party Data Clean Rooms
Europe’s GDPR continues to steer architecture decisions. In spring 2025, a multinational broadcaster migrated audience-matching to an encrypted BigQuery clean room, enabling advertisers to measure lift without accessing raw tables [2]Google Cloud Blog, “Secure Data Sharing with BigQuery Clean Rooms,” cloud.google.com. Agencies now request similar blueprints in new tenders, indicating that clean rooms are becoming a default requirement rather than a premium add-on.
Programmatic Video Expansion in Asia
Mobile streaming minutes rose sharply across India, Indonesia, and the Philippines in 2024. A regional DSP added GPU nodes in Singapore and cut auction latency by 27% during Lunar-New-Year peaks, boosting win rates on premium CTV slots [3]DSP-Asia Investor Relations, “Q1 2025 Latency Optimisation,” investor.dsp-asia.com. Telcos responded by marketing edge-hosting tiers tailored to ad-tech workloads, opening a new revenue stream.
Edge-AI Bidding Engines
Transformer-based models now predict engagement scores on the fly. A social-video platform deploying NVIDIA Grace-Blackwell clusters from CoreWeave trimmed inference time for bid optimisation by 70%, lifting cleared impressions and channeling fresh spend into real-time creative testing [4]Michael Intrator, “IPO Filing and 2024 Results,” coreweave.com. As inference approaches network-propagation limits, competitive advantage shifts to edge deployments.
Restraints Impact Analysis*
| Restraint | (~) % Impact on CAGR Forecast | Geographic Relevance | Impact Timeline |
|---|---|---|---|
| Rising Cloud Egress Fees Elevating TCO | -2.3% | Global, with higher impact in data-intensive regions | Short term (≤2 yrs) |
| Regional Data-Sovereignty Mandates | -1.9% | Europe, Asia-Pacific, Middle East | Medium term (3-4 yrs) |
| Ad-Fraud Detection Latency Concerns | -1.7% | Global, with higher impact in emerging markets | Short term (≤2 yrs) |
| Kubernetes / DevOps Talent Shortage | -1.2% | Global, with concentration in high-growth markets | Medium term (3-4 yrs) |
| Source: Mordor Intelligence | |||
Rising Cloud Egress Fees Elevating TCO
Advertisers discovered in 2024 that data-out charges can erode ROI when impression logs traverse multiple clouds. A European gaming publisher cut seven-figure costs by repatriating traffic to a colocation facility with private fiber, without latency penalties. Finance teams now treat network topology as a core budget variable.
Regional Data-Sovereignty Mandates
Australia’s 2025 security amendment requires certain citizen data to remain onshore. A domestic bank launched a credit-card rewards campaign atop a sovereign-cloud stack built on VMware Cloud Foundation, maintaining API parity while satisfying regulators. Similar rules in South Korea and Saudi Arabia point toward code portability with policy granularity as standard practice.
*Our forecasts treat driver/restraint impacts as directional, not additive. The impact forecasts reflect baseline growth, mix effects, and variable interactions.
Segment Analysis
By Deployment Type: Hybrid cadres balance scale with control
Hybrid-cloud advertising market size is projected to grow at a 22.97% CAGR through 2031, underscoring brands’ need for elastic compute without relinquishing sensitive identity graphs. A global airline ran edge Kubernetes clusters for passenger-list processing while bursting forecasting tasks to public zones, enabling GDPR-compliant retargeting and real-time yield management. Public-cloud advertising retained 63.45% cloud advertising market share in 2025 as a streaming service halved rendering costs by using reserved GPU blocks for AV1 encoding. Private-cloud deployments remain critical in finance and healthcare, with a European insurer cutting regulatory man-hours by 20% after migrating segmentation models to a private OpenShift cluster.


By Service Model: SaaS suites converge creation and attribution
Software-as-a-service platforms captured 51.25% of the cloud advertising market size in 2025, led by fashion retailers that launched capsule collections through integrated creative-to-checkout workflows. Platform-as-a-service middleware, growing at 21.87% CAGR, unifies loyalty, point-of-sale, and ad-delivery streams to optimize promotional spend. Infrastructure-as-a-service increasingly favors GPU-dense instances; a Korean mobile-game studio reported a 12% drop in cost-per-acquisition after adopting on-demand H100 nodes for real-time diffusion creatives.
By End-User Industry: Retail maintains lead while media accelerates
Retail & e-commerce accounted for 23.62% cloud advertising market share in 2025, driven by big-box algorithms that privilege high-margin SKUs in search results. Media & entertainment is forecast to expand at 20.94% CAGR as sports platforms monetize dynamic overlays that double average CPMs. Telecom operators, banks, and healthcare providers also adopt cloud advertising, though they emphasize consent management and audit readiness.
Geography Analysis
North America generated 37.65% of 2025 revenue, supported by dense inter-cloud connectivity that keeps median bid-request round-trip below 120 ms. State-level privacy laws introduced in 2025 spurred demand for policy-as-code tooling, rewarding vendors that abstract compliance into declarative templates.
Asia-Pacific is expected to record the fastest regional growth at 19.46% CAGR from 2026-2031. Government incentives for data-center construction, renewable energy projects in Guangdong, and low-earth-orbit connectivity across remote Indonesian islands together extend mobile-ad reach to previously unreachable audiences.
Europe faces the strictest privacy regime. A pan-European grocery chain federated encrypted loyalty IDs through sovereign clouds in 2025, trading minor latency overhead for compliance certainty. Advertisers across the region increasingly accept such performance tradeoffs to mitigate regulatory risk.
Latin America’s virtuous cycle of logistics investment and advertising revenue continues. A Brazilian fulfilment specialist extended same-day delivery to 55% of urban consumers, boosting click-through rates on sponsored listings and enabling ad revenue to outpace GMV growth.
Middle East and Africa benefit from new terrestrial fiber routes and sovereign-cloud builds. A Gulf airline’s Arabic-language retargeting campaign launched from an Abu Dhabi stack in 2025 generated incremental bookings in markets that previously under-indexed on digital spend.

Competitive Landscape
The cloud advertising market shows moderate concentration. Hyperscale providers integrate impression pipelines, edge inference, and revenue attribution in single-tenant consoles, but specialized GPU clouds such as CoreWeave attract buyers with billing based on inference seconds rather than VM hours, aligning directly to bidding economics. Traditional ad-tech intermediaries reposition as orchestration overlays, exposing transparent cost-of-sale metrics instead of percentage-of-media fees. Vendors catering to regulated verticals emphasize HITRUST or ISO-27701 attestations, demonstrating that marketing acceleration can coexist with strict compliance.
Cloud Advertising Industry Leaders
Adobe Systems Incorporated
Amazon Web Services Inc.
Google LLC
Microsoft Corporation
Oracle Corporation
- *Disclaimer: Major Players sorted in no particular order

Recent Industry Developments
- March 2025: Salesforce introduced AgentExchange, a marketplace of reusable AI components for omni-channel journeys.
- February 2025: Microsoft enabled showroom-style interactive ads inside Copilot, allowing natural-language product exploration.
- February 2025: Adobe launched commercial-tier Firefly subscriptions within Creative Cloud, offering image, vector, and video generation utilities on consumption pricing.
- January 2025: Roku upgraded its clean-room product into Roku Data Cloud to supply granular CTV measurement within privacy frameworks.


Research Methodology Framework and Report Scope
Market Definition and Key Coverage
Our study defines the cloud advertising market as all revenues generated from software-as-a-service, platform-as-a-service, and infrastructure-as-a-service tools that let brands plan, buy, serve, and measure digital advertisements through public, private, or hybrid cloud deployments. The scope captures spend tied to display, search, social, video, and emerging programmatic formats that rely on elastic cloud resources rather than on-premise ad stacks.
Scope exclusion: Traditional on-premise ad-serving appliances and isolated managed-hosting contracts are outside this market.
Segmentation Overview
- By Deployment Type
- Public Cloud Advertising
- Private Cloud Advertising
- Hybrid Cloud Advertising
- By Service Model
- Software as a Service (SaaS) Advertising Platforms
- Demand-Side Platforms (DSP)
- Supply-Side Platforms (SSP)
- Ad Exchanges
- Infrastructure as a Service (IaaS) for Ad Delivery
- Compute-Optimized Instances
- GPU-Accelerated Instances
- Edge / Content Delivery Networks
- Platform as a Service (PaaS) Marketing Middleware
- Data Clean Rooms
- API Management and Micro-services
- AI / ML Model-Training Platforms
- Software as a Service (SaaS) Advertising Platforms
- By End-User Industry
- Retail and eCommerce
- Media and Entertainment
- Information Technology and Telecom
- Banking, Financial Services and Insurance (BFSI)
- Government and Public Sector
- Others
- By Geography
- North America
- United States
- Canada
- South America
- Brazil
- Argentina
- Rest of South America
- Europe
- Germany
- United Kingdom
- France
- Italy
- Spain
- Rest of Europe
- Asia-Pacific
- China
- Japan
- South Korea
- India
- Australia
- New Zealand
- Rest of Asia-Pacific
- Middle East and Africa
- United Arab Emirates
- Saudi Arabia
- South Africa
- Rest of Middle East and Africa
- North America
Detailed Research Methodology and Data Validation
Primary Research
We interviewed senior media buyers, cloud solution architects, and brand marketers across North America, Europe, and Asia Pacific. Their insights on campaign migration rates, preferred service models, and budget allocation patterns helped us close data gaps, pressure-test price assumptions, and align forecast drivers with real purchasing behavior.
Desk Research
Mordor analysts began with datasets from tier-1 public sources such as the Interactive Advertising Bureau, UN Comtrade, national statistics portals, and regional telecom regulators, which reveal ad spend mix, cross-border data traffic, and cloud service adoption. Company 10-Ks, investor decks, and press releases supplied vendor revenue splits and average selling price cues, while patents and usage metrics accessed through Questel and Dow Jones Factiva signaled upcoming feature launches and demand shifts.
Additional reference points came from trade associations in retail and media, WTO tariff sheets that trace cross-border digital services, and IMF consumer-price files that ground currency normalization. The sources listed are illustrative only; many other public and proprietary documents were consulted to validate and clarify findings.
Market-Sizing & Forecasting
The baseline value was first estimated through a top-down reconstruction of worldwide digital ad spend, applying a cloud deployment penetration filter and then calibrating against regional cloud infrastructure revenue. Select bottom-up checks, such as sampled SaaS license counts, hybrid-cloud seat roll-ups, and channel ASP × volume probes, tempered over- or under-shoots. Key variables include programmatic share of total spend, mobile ad weight, average cloud CPM discount, multi-region data egress fees, and enterprise cloud adoption rates. A multivariate regression aligned these inputs with historic spend to project the market through 2030. Scenario analysis adjusted for privacy regulation shocks and macro slowdowns. Missing granular vendor data were bridged using regional intake ratios derived from customs records and moderated by expert consensus.
Data Validation & Update Cycle
Outputs are stress-tested through anomaly checks, variance flags, and peer review. Once the model clears review, we lock the report, refresh it every twelve months, and trigger interim updates when material events, such as large M&A, disruptive regulation, or currency swings, occur. A final analyst pass takes place just before delivery so clients see the most recent view.
Why Mordor's Cloud Advertising Baseline Commands Reliability
Published figures for cloud advertising often diverge because studies apply different ad-format baskets, cloud service mixes, and refresh cadences.
Key gap drivers include whether private-cloud managed services are counted, how aggressively mobile in-app ads are forecast, the currency conversion year, and, critically, if supplier-level checks are used to temper spend extrapolations. Mordor's model reports a balanced base year, whereas some publishers release optimistic totals built on ad-spend growth factors alone or conservative numbers that ignore hybrid deployments.
Benchmark comparison
| Market Size | Anonymized source | Primary gap driver |
|---|---|---|
| USD 5.06 B | Mordor Intelligence | - |
| USD 85.69 B | Global Consultancy A | Includes on-premise ad tech and counts agency service fees |
| USD 4.47 B | Industry Association B | Omits private-cloud and hybrid revenue, older currency conversion |
These comparisons show that our disciplined scope selection, dual-track validation, and annual refresh yield a dependable market baseline that decision-makers can trace back to transparent variables and repeatable steps.


Key Questions Answered in the Report
What is driving the rapid growth of cloud advertising?
Elastic compute, integrated AI creative tools, and privacy-first data architectures simultaneously boost performance and compliance, motivating sustained budget migration to cloud platforms.
How does a hybrid deployment improve advertising outcomes?
Hybrid architectures keep sensitive identity data in controlled environments while bursting analytics to public clouds, balancing compliance with sub-second bid response.
What role does generative AI play in marketing asset creation?
Generative AI compresses production from days to hours, enabling dozens of creative variants to be tested in flight and improving return on media spend.
Are cloud egress fees materially affecting ad-tech ROI?
Yes. Data-out charges can add notable cost, prompting many advertisers to consolidate analytics within a single provider or invest in direct interconnects.
How do data-sovereignty laws influence deployment choices?
Mandates that restrict data residence compel region-specific instances, pushing vendors to supply compliant sovereign-cloud templates and policy-as-code frameworks.
Which industry vertical is expanding fastest in cloud advertising adoption?
Media & entertainment is pacing the highest growth, fueled by the monetization of streaming inventory and interactive in-stream ad formats.
Page last updated on:


