
Inductor Market Size and Share
Market Overview
| Study Period | 2020 - 2031 |
|---|---|
| Market Size (2026) | USD 11.76 Billion |
| Market Size (2031) | USD 14.47 Billion |
| Growth Rate (2026 - 2031) | 4.23 % |
| Fastest Growing Market | Asia Pacific |
| Largest Market | Asia Pacific |
| Market Concentration | Medium |
Major Players *Disclaimer: Major Players sorted in no particular order Image © Mordor Intelligence. Reuse requires attribution under CC BY 4.0. | |
Inductor Market Analysis by Mordor Intelligence
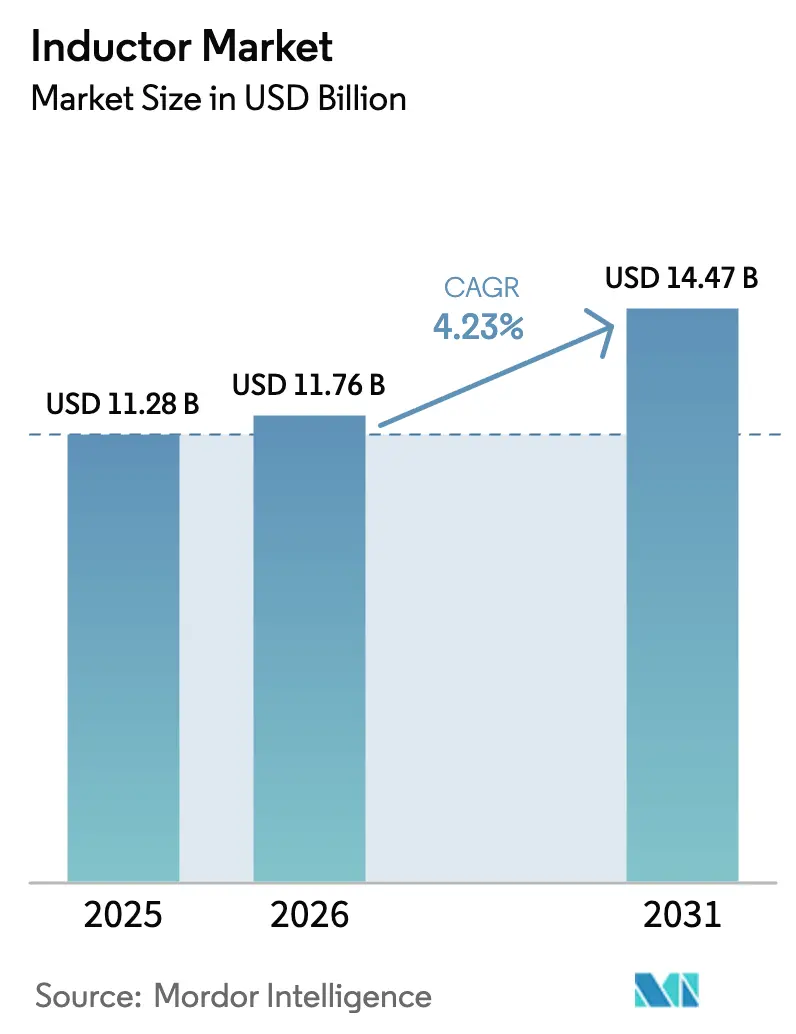
The Inductor Market size is expected to grow from USD 11.28 billion in 2025 to USD 11.76 billion in 2026 and is forecast to reach USD 14.47 billion by 2031 at 4.23% CAGR over 2026-2031. Robust demand from electric-vehicle powertrains, 5G radio access networks, and edge AI servers is driving steady expansion in the inductor market, even as smartphone unit growth plateaus. Supply chains are shifting toward thin-film and nanocrystalline solutions that deliver ultra-low core loss above 1 MHz, while end users are tightening electromagnetic interference limits, which favor shielded constructions. Asia Pacific anchors capacity, yet regional reshoring in North America and Europe is accelerating to mitigate geopolitical risks and raw material price swings. Competitive differentiation now centers on vertical integration of ferrite powders, automated winding equipment, and co-packaging of integrated magnetics with wide-bandgap switches.
Key Report Takeaways
- By Inductor type, fixed inductors commanded 42.52% of the inductor market size in 2025; thin-film devices are growing at the fastest 4.91% CAGR to 2031.
- By end-user vertical, consumer electronics held 34.37% of the inductor market share in 2025, while automotive applications are forecast to expand at a 5.82% CAGR through 2031.
- By core material, ferrite cores led with 55.16% revenue share in 2025, whereas nanocrystalline and amorphous alloys are the quickest-rising segment at a 5.16% CAGR through 2031.
- By mounting technique, surface-mount technology dominated with a 68.63% share in 2025, while embedded-PCB inductors are expected to grow at a 6.43% CAGR through 2031.
- By shielding, shielded constructions accounted for 60.53% of the 2025 revenue and are projected to advance at a 5.11% CAGR through 2031.
- By geography, Asia-Pacific commanded 36.23% of the inductor market share in 2025 and is poised to grow at 6.51% CAGR through 2031.
Note: Market size and forecast figures in this report are generated using Mordor Intelligence’s proprietary estimation framework, updated with the latest available data and insights as of January 2026.
Market Trends and Insights
Drivers Impact Analysis of Inductor Market*
| Driver | (~) % Impact on CAGR Forecast | Geographic Relevance | Impact Timeline |
|---|---|---|---|
| Rising demand for miniaturized consumer electronics | +0.6% | Global with focus in Asia Pacific and North America | Short term (≤ 2 years) |
| Electrification of automotive sector (EVs) | +1.2% | China, Europe, North America | Medium term (2-4 years) |
| Expansion of 5G and high-speed communications | +0.8% | Asia Pacific core, spill-over to Middle East and Africa | Medium term (2-4 years) |
| Growth in renewable energy and power electronics | +0.7% | Europe and Asia Pacific, emerging in Middle East | Long term (≥ 4 years) |
| Adoption of GaN/SiC power stages | +0.9% | North America and Europe, expanding to Asia Pacific | Medium term (2-4 years) |
| On-device AI in edge servers | +0.5% | North America and Asia Pacific data-center hubs | Short term (≤ 2 years) |
| Source: Mordor Intelligence | |||
Electrification Of Automotive Sector
Battery-electric and plug-in hybrid vehicles captured 18% of global light-duty vehicle sales in 2025, and regulators aim for a penetration of more than 35% by 2030.[1] Each electrified platform integrates 150-300 inductors across traction inverters, on-board chargers, and DC-DC converters, lifting average content well above internal combustion levels. High-voltage 800 V buses require coupled inductors with saturation currents exceeding 200 A and leakage inductance under 50 nH to minimize switching losses. AEC-Q200 testing requires a 1,000-hour life at 150 °C, which restricts the qualified supplier pool and raises entry barriers. Tesla lowered per-vehicle inductor costs by 12% in 2025 through dual sourcing and design-for-manufacture initiatives.
Expansion Of 5G And High-Speed Communications
Global 5G base-station count exceeded 4 million in 2025, with China installing 60% of the sites. Massive-MIMO arrays integrate dozens of millimeter-wave inductors per RF front-end, each requiring self-resonant frequencies above 10 GHz. Murata reported 35% annual growth in demand for multilayer inductors rated for >10 GHz service. ETSI EN 301 908 tightened spurious-emission limits, compelling higher-Q designs that boost inductor market adoption. With mid-band traffic per user tripling to 35 GB per month in 2025, operators continue to densify networks, sustaining long-term order visibility.
Adoption Of GaN/SiC Power Stages
Gallium nitride and silicon carbide devices switch five times faster than silicon MOSFETs, pushing operating frequencies beyond 500 kHz. Infineon recorded 48% year-over-year GaN revenue growth in 2025, mainly from server and solar inverters. Standard ferrites incur >500 mW/cm³ core loss at 1 MHz, whereas nanocrystalline cores cut loss below 100 mW/cm³, enabling 98.5% converter efficiency in Wolfspeed demonstrations. Interleaved topologies favor coupled inductors that reduce ripple and capacitor count, reinforcing a premium segment within the inductor market.
On-Device AI In Edge Servers
Inference accelerators now draw peak currents beyond 400 A at sub-1 V rails, triple 2022 figures. Texas Instruments specifies multiphase buck converters using inductors with <0.3 mΩ DC resistance and saturation above 50 A to keep transients within 50 mV. NVIDIA’s next-generation GPU consumes 700 W, necessitating 12-phase regulators with integrated coupled inductors. Eaton disclosed that shipments of high-current molded inductors for AI doubled in 2025 as cloud providers adopted more edge deployments.
Restraints Impact Analysis of Inductor Market*
| Restraint | (~) % Impact on CAGR Forecast | Geographic Relevance | Impact Timeline |
|---|---|---|---|
| Volatility in copper and ferrite prices | -0.4% | Global, acute in Asia Pacific manufacturing hubs | Short term (≤ 2 years) |
| Global supply-chain disruptions | -0.3% | Global, concentrated in Asia Pacific and Europe | Short term (≤ 2 years) |
| Thermal management challenges in embedded inductors | -0.2% | North America and Europe advanced-packaging centers | Medium term (2-4 years) |
| Integrated passive devices eroding discrete demand | -0.3% | Global, led by Asia Pacific consumer electronics | Long term (≥ 4 years) |
| Source: Mordor Intelligence | |||
Volatility in Copper and Ferrite Prices
Copper accounted for 40-50% of wire-wound inductor cost structures, and London Metal Exchange spot prices fluctuated between USD 8 200 and USD 10 500 per ton in 2025. China controls about 70% of manganese-zinc ferrite capacity, and rare-earth export quotas imposed in early 2025 extended lead times from 8 to 16 weeks.[2] Mid-tier suppliers lacking hedging programs saw margin compression of 200-300 basis points, whereas vertically integrated majors stabilized input costs. Rising prices are nudging designers toward air-core alternatives for non-critical roles, though inductance density penalties limit broader substitution.
Thermal Management Challenges in Embedded Inductors
Embedding magnetic cores inside PCB substrates trims board area yet elevates thermal stress. IEEE testing showed a 15% inductance drop at 130 °C in a 48 V automotive DC-DC module, breaching ripple specifications. AT&S reported embedded-inductor module yields below 85% in 2025 due to delamination and coefficient of thermal expansion mismatch. Metal-composite or air-core spirals offer higher temperature headroom but deliver 30-40% lower inductance density, forcing trade-offs between footprint and efficiency.
*Our forecasts treat driver/restraint impacts as directional, not additive. The impact forecasts reflect baseline growth, mix effects, and variable interactions.
Inductor Market Segment Analysis
By Inductor Type:
Thin-Film Architectures Reshape RF And High-Frequency DesignThin-film devices captured notable momentum and are forecast to expand at a 4.91% CAGR to 2031. This slice of the inductor market benefits from RF modules that require self-resonant frequencies above 20 GHz and tolerance within ±2%. Fixed inductors retained 42.52% revenue share in 2025, supplying cost-sensitive DC-DC converters and lighting drivers. Sputtered copper traces on ceramic substrates shrink footprints to 0.4 mm x 0.2 mm, a level now entering volume production for millimeter-wave power amplifiers. Coupled inductors are gaining prominence in multiphase voltage regulators for AI accelerators, reducing the need for output capacitor banks by nearly half.
Thin-film adoption is spreading beyond phones into 5G base stations, where high-Q performance improves spectral masks. Meanwhile, molded and wire-wound designs dominate solar inverters and motor drives that demand >100 µH inductance and >100 A current ratings. Multilayer ceramic inductors remain competitive below 5 GHz but are ceding high-frequency sockets to thin-film options. This bifurcation highlights the inductor market's segmentation between price-driven mass volumes and performance-driven premium niches. Designers weigh cost, saturation, and self-resonance as they transition from legacy wire-wound architectures to thin-film solutions.


By Core Material:
Nanocrystalline Alloys Meet Wide-Bandgap NeedsFerrite cores accounted for 55.16% of shipments in 2025, reflecting scale economics and acceptable losses below 500 kHz. However, nanocrystalline and amorphous alloys are expected to climb at a 5.16% CAGR as GaN and SiC converters switch near 1 MHz. Hitachi Metals documented a 20% volume reduction in a 10 kW solar inverter when replacing ferrite with nanocrystalline ribbon, while core loss fell by two-thirds. IEC 60404 measurement standards allow designers to benchmark these materials against ferrites with confidence.
Iron-powder composites offer higher saturation than ferrite but lower permeability than amorphous ribbons, making them suitable for high-current automotive coils. Air and ceramic cores deliver zero hysteresis, yet have low inductance density, limiting their usage to RF tuning. The shift toward high-frequency, high-temperature operation elevates nanocrystalline alloys from a niche to a mainstream technology, injecting fresh competition into the inductor market.
By Mounting Technique:
Embedded PCB Inductors Pursue Sub-Millimeter HeightsSurface-mount technology commanded 68.63% of revenue in 2025 and remains the workhorse for automated pick-and-place lines. Embedded and integrated PCB inductors, projected to grow at a 6.43% CAGR, eliminate discrete packages and cut parasitic inductance by 30%. Apple’s 2025 flagship phone utilized embedded ferrite coils to reduce its total thickness by 0.3 mm. The advance aligns with thinner wearables and augmented-reality headsets that tolerate less than 0.5 mm z-height.
Through-hole components keep relevance in traction inverters where >50 A currents and 20 G vibration demand rugged pins. Yet OEM roadmaps increasingly favor embedded magnetics in power-module substrates to streamline assembly. Thermal buildup above 120 °C remains the adoption hurdle, driving R&D into metal-powder cores and microchannel cooling.

By Shielding:
Regulatory Pressure Elevates Shielded DesignsStricter CISPR 25 and IEC 60601 limits led shielded constructions to 60.53% revenue share in 2025, and they will advance at 5.11% CAGR. Magnetic enclosures cut radiated emissions by up to 40 dB, ensuring compliance for ADAS, medical imaging, and 5G radios. Unshielded inductors still appeal in portable gadgets where board-level filtering suffices and every milliohm of DC resistance counts.
In automotive domains, ISO 11452 mandates system-level EMC validation, tilting selection toward shielded variants, especially for 48 V battery rails. The trade-off between efficiency and noise will continue to push the inductor market toward shielded form factors as wireless interfaces proliferate.
By Inductance:
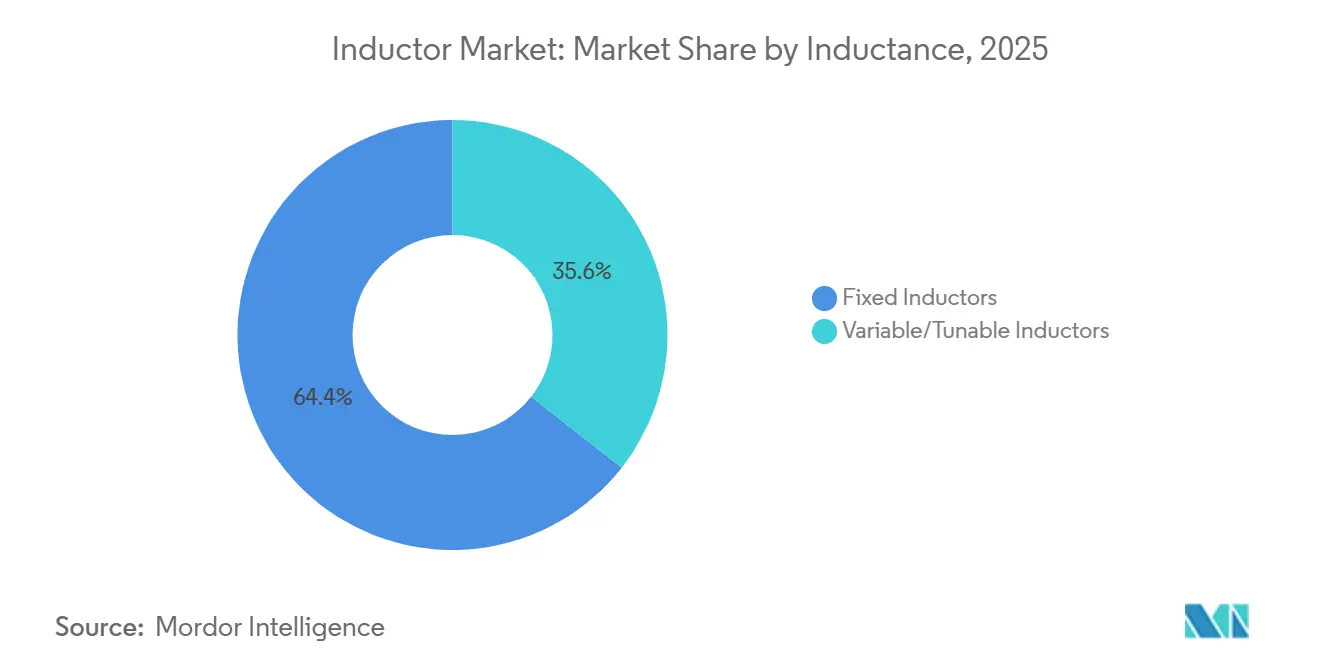
Variable Devices Enable Adaptive SystemsNon-tunable (fixed-inductance) products accounted for 64.42% of 2025 sales, powering converters where the values remain constant. Variable/tunable inductors, poised for a 6.76% CAGR through 2031, support antenna tuning and adaptive power delivery. Qualcomm integrated tunable elements into its RF360 platform to achieve 1.5 dB of radiated-power efficiency across 5G bands. Millimeter-wave deployments amplify the need for real-time impedance matching, boosting this specialized corner of the inductor market.
Mechanical, MEMS, or varactor-controlled products command premium prices due to tighter tolerances. While fixed coils will dominate high-current pathways, tunable options will proliferate in software-defined radios and user-equipment antenna arrays, carving out a resilient growth pocket.
By End-User Vertical:
Automotive Electrification Leads GrowthAutomotive applications are projected to grow at a market-leading 5.82% CAGR through 2031, driven by increasing inductor counts per electric drivetrain. Consumer electronics retained a 34.37% stake in 2025, yet unit saturation tempers future expansion. Telecommunications infrastructure benefits from 5G densification, with each macro cell embedding 200-400 inductors. Renewable energy installers specify high-power nanocrystalline cores for solar and wind converters, aligning with global decarbonization targets.[3]
Aerospace, defense, and medical equipment pay premium prices for radiation-hardened or sterilizable parts, but their volumes remain comparatively low. The divergence highlights the split in the inductor market between vast commodity demand and specialized, high-margin segments.
Geography Analysis
APAC Inductor Market
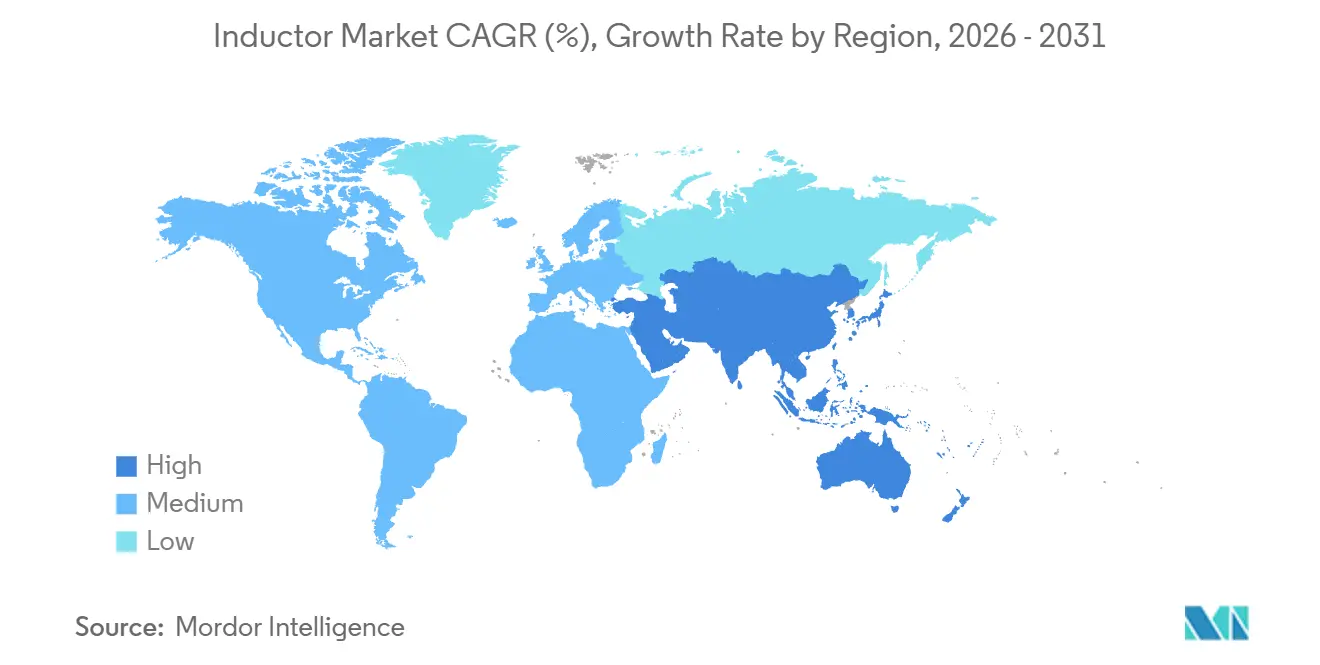
The Asia Pacific region held 36.23% of the 2025 revenue and is projected to advance at a 6.51% CAGR through 2031. China’s vertically integrated ferrite chain supplies 60% of global output, while Japan leads multilayer and thin-film manufacturing. South Korea integrates inductors within advanced packages for logic foundries, and Taiwan boosts capacity for high-current molded devices. India’s Production-Linked Incentive scheme attracted USD 1.2 billion to passive components in 2025, although inductor production still lags behind that of capacitors and resistors.
North America and Europe Inductor Market
North America garnered a 24% share in 2025, driven by domestic EV tax credits and the expansion of edge-data-center footprints. U.S. suppliers specialize in custom wire-wound and coupled inductors for aerospace and medical sectors. Canada’s renewable buildout and Mexico’s vehicle assembly lines add steady baseline demand. Europe captured approximately 22% of the revenue, with automotive electrification, under the Fit for 55 package, and offshore wind projects driving the demand for high-power components.[4] Germany anchors design activity, and Czech plants acquired by multinational vendors extend regional scale.
MEA and LATAM Inductor Market
The Middle East and Africa remain emerging territories, with demand tied to hyperscale data centers and off-grid solar. Latin America follows Brazilian EV production and Argentine wind farms, but economic volatility dampens capital flows. These regional trends illustrate how manufacturing scale, policy incentives, and energy transitions shape the distribution of the global inductor market.
Note: Segment Growth Rate of all individual regions available upon report purchase
Regulatory Landscape
Inductors are subject to a mix of product safety, EMC, and material compliance regimes that increasingly flow through to component qualification. In standards, prEN IEC 62674-1:2024 provides a component-level reference for fixed surface-mount inductors used in high-frequency electronics, supporting more consistent verification practices across suppliers and OEMs. For automotive and other regulated end uses, qualification and EMC expectations continue to favor shielded and high-temperature-rated constructions, aligned with AEC-Q200 and system-level EMC validation.
Trade and substance rules also add region-specific compliance overhead to global sourcing. In the United States, a Section 232 proclamation effective January 15, 2026 introduced 25% ad valorem duties on certain semiconductor and derivative products defined by technical parameters, increasing the need for bill-of-materials classification rigor when inductors ship as part of power modules and electronics assemblies. In China, MIIT published the Compliance Management Catalogue for Restricted Use of Hazardous Substances in Electrical and Electronic Products (2026 Edition) with an accompanying exemption list, expanding regulated categories from 12 to 33 and tying substance limits to GB 26572-2025, with an implementation milestone of August 1, 2027.
Value Chain Analysis
The inductor value chain begins with upstream inputs such as copper wire and core materials, including ferrite, iron/metal alloys, and nanocrystalline ribbons. It then moves through powder preparation, core forming and sintering, winding or multilayer and thin-film fabrication, shielding and molding, and electrical and thermal characterization, before reaching application-specific qualification such as AEC-Q200 for automotive. Scale leaders differentiate through vertical integration in ferrite synthesis and automated winding, packaging, and testing, while performance-driven segments increasingly require close co-design with power semiconductor and power-stage architects (GaN/SiC, multiphase regulators, and high-frequency RF front ends).
Midstream manufacturing remains concentrated in Asia-centric ecosystems, while distribution and demand fulfillment rely on global electronics channels and specialized distributors, with trade flows frequently routed through Hong Kong SAR and China as import-export hubs. In 2025, supply chain dynamics featured low inventories early in the year and heightened tariff concerns that influenced ordering patterns and inventory accumulation. Raw-material volatility, particularly in copper and magnetic materials, continued to pressure lead times and pricing discipline. As a result, OEMs and EMS providers are leaning toward multi-sourcing, qualifying alternate form factors such as shielded molded and thin-film devices, and collaborating more closely with suppliers to secure capacity for high-current AI server power and EV powertrain programs.
Competitive Landscape
The inductor market exhibits moderate consolidation, with the top five suppliers accounting for roughly 45% of the 2025 revenue, leaving ample room for niche challengers. Japanese and Taiwanese firms dominate multilayer and SMT categories through end-to-end ferrite synthesis and automated assembly. European and North American specialists defend wire-wound and aerospace-grade niches that require extensive qualification.
Patent filings for integrated magnetics and multiphase coupled coils increased 22% year-over-year to 320 grants in 2025, with TDK, Murata, and Infineon leading the way. Chinese vendors, such as Sunlord and Codaca, are leveraging domestic EV demand and cost advantages to gain market share, as evidenced by Sunlord’s 28% revenue surge in 2025. Strategic moves include co-location with wafer foundries for embedded inductors and partnerships between passive-component makers and wide-bandgap semiconductor houses.
Technology roadmaps emphasize DC resistance below 0.5 mΩ, self-resonance above 10 GHz, and embedded designs with a z-height of under 0.3 mm. Compliance hurdles such as AEC-Q200, IEC 60950, and MIL-PRF-27 extend qualification cycles to up to three years, shielding incumbents from rapid commoditization. Nevertheless, the quest for smaller, cooler, and quieter power stages keeps competitive pressure intense across the inductor market.
Inductor Industry Leaders
-
TDK Corporation
-
Murata Manufacturing Co. Ltd
-
Vishay Intertechnology Inc.
-
Panasonic Holdings Corporation
-
Taiyo Yuden Co. Ltd
- *Disclaimer: Major Players sorted in no particular order

Inductor Market Companies Covered in this Report
- TDK Corporation
- Murata Manufacturing Co. Ltd
- Vishay Intertechnology Inc.
- Panasonic Holdings Corporation
- Taiyo Yuden Co. Ltd
- Samsung Electro-Mechanics Co. Ltd
- Pulse Electronics (Yageo Corporation)
- Delta Electronics Inc.
- Coilcraft Inc.
- Bourns Inc.
- Wurth Elektronik GmbH & Co. KG
- Sumida Corporation
- TE Connectivity Ltd
- Chilisin Electronics Corporation
- AVX Corporation (Kyocera AVX)
- Bel Fuse Inc.
- Sunlord Electronics Co. Ltd
- Eaton Corporation (Coiltronics)
- KEMET Corporation (Yageo)
- API Delevan Inc.
Market Opportunities and Future Outlook
Design-in opportunities are expanding where inductors are coupled tightly to new power-conversion architectures, packaging choices, and compliance requirements, rather than driven by commodity replacement cycles. AI servers and edge compute power delivery are supporting demand for high-current, low-DCR inductors and coupled-inductor solutions used in multiphase regulators. At the same time, wide-bandgap (GaN/SiC) converters operating into the MHz range are accelerating adoption of low-loss magnetic materials such as nanocrystalline and advanced metal-composite cores. Embedded and integrated PCB inductors also represent a clear whitespace area, though thermal robustness and yield constraints limit how quickly designs can scale, keeping focus on materials changes, tighter process control, and supplier-OEM co-engineering.
Capacity allocation and facility moves in 2026 offer a clearer read on where suppliers are directing investment. Murata began construction of a new 13,391 square meter production building in Tome City, Miyagi Prefecture for chip inductors and EMI suppression filters (announced May 2026, approximately 9.7 billion yen investment), pointing to continued emphasis on high-volume chip inductors and EMI suppression components used across automotive and communications electronics. Parallel investments across adjacent passive and packaging ecosystems, including announced long-term plans by Samsung Electro-Mechanics and Kyocera tied to AI-oriented components and facilities, reinforce ongoing demand pull for higher-reliability passives and integration-ready form factors that fit advanced substrates and power-dense computing hardware.
Recent Industry Developments in Inductor Market
- June 2026: Murata Manufacturing Co., Ltd. collaborated with Synopsys to provide passive component simulation models, including thermal analysis data for power inductors, through Ansys electromagnetic and thermal analysis tools. The release supports earlier and more accurate inductor selection in power-density-driven designs such as AI server regulators and EV power electronics, tightening supplier engagement in customers design workflows. It also enables co-design workflows across supplier and customer teams to shorten development cycles.
- April 2026: TAIYO YUDEN CO., LTD. commenced mass production of its MCOIL LSCN series multilayer metal power inductors at WAKAYAMA TAIYO YUDEN CO., LTD. Moving to mass production expands available volumes of smaller-form-factor power inductors used in space-constrained consumer and computing designs where efficiency and current handling must be maintained as board area shrinks. The scale-up supports heightened demand in AI and automotive segments and enables new customer engagements.
- October 2025: Murata released a 150 C-rated nanocrystalline power inductor qualified to AEC-Q200 Grade 0 for SiC traction inverters. By combining high-temperature operation with automotive qualification, the product widens the qualified supplier pool for higher-frequency, higher-voltage EV powertrains and supports the shift from standard ferrites toward lower-loss magnetic materials. It also signals accelerated adoption of nanocrystalline cores in premium automotive power electronics.
Inductor Market Report Scope and Research Methodology
Market Definition and Coverage
For this methodology, the market covers finished inductor components sold as discrete parts that store energy in a magnetic field and manage current in electronic circuits. The sizing is global and counts revenue generated from inductor shipments across major end-use electronics and industrial demand.
Scope exclusions: We exclude loose ferrite beads, magnetic cores sold without windings, and inductors already integrated inside transformers.
Segments Covered in This Report
- By Inductor Type
- Power Inductors
- RF/High-Frequency Inductors
- Coupled Inductors
- Multilayer Inductors
- Thin-Film Inductors
- Molded/Wire-Wound Inductors
- By Core Material
- Air/Ceramic Core
- Ferrite Core
- Iron and Metal-Alloy Core
- Nanocrystalline and Amorphous Core
- By Mounting Technique
- Surface-Mount Technology (SMT)
- Through-Hole Technology (THT)
- Embedded/Integrated PCB Inductors
- By Shielding
- Shielded
- Unshielded
- By Inductance
- Fixed Inductors
- Variable/Tunable Inductors
- By End-User Vertical
- Automotive
- Aerospace and Defense
- Communications and 5G Infrastructure
- Consumer Electronics and Computing
- Industrial and Power
- Healthcare and Medical Devices
- Renewable Energy Systems
- By Geography
- North America
- United States
- Canada
- Mexico
- South America
- Brazil
- Argentina
- Rest of South America
- Europe
- Germany
- United Kingdom
- France
- Italy
- Spain
- Russia
- Rest of Europe
- Asia Pacific
- China
- Japan
- South Korea
- India
- Australia
- New Zealand
- Rest of Asia Pacific
- Middle East
- United Arab Emirates
- Saudi Arabia
- Turkey
- Rest of Middle East
- Africa
- South Africa
- Nigeria
- Kenya
- Rest of Africa
- North America
Data Sources, Market Sizing, and Validation
Desk Research
Desk research was used to set the fact base for demand signals, supply structure, and pricing direction before assumptions were finalized. We leaned on public sources such as World Semiconductor Trade Statistics for semiconductor cycle context, UN Comtrade for electronics trade direction, and OECD or World Bank macro series to anchor electronics production and consumption trends.
To keep the model realistic, we also reviewed filings and presentations from listed component manufacturers, import-export summaries, and reputable electronics press coverage for launch timing and capacity commentary. Patent databases were screened to track technology shifts in power and high-frequency designs, and company financials plus an intelligence subscription were used only to standardize revenue splits and avoid double counting across reporting entities. The desk sources listed here are illustrative, and additional public references were also used for data collection, validation, and clarification.
Primary Interviews and Surveys
Primary work focused on checking how inductors are specified, bought, and priced across large consuming industries such as consumer electronics, automotive electronics, telecom infrastructure, and industrial power. We spoke with component suppliers, distributors, and procurement or engineering stakeholders across key regions, and then used their feedback to refine gaps around ASP movement, product mix shifts, and lead-time related shipment timing.
To reduce assumption risk, we cross-checked results across APAC, EMEA, and the Americas, so a single-country bias did not drive the global totals, particularly when end markets moved at different speeds.
Distribution of primary research fieldwork respondents
| Company type | Respondent position | Region |
|---|---|---|
| Top tier: 33% | CXOs: 14% | APAC: 50% |
| Mid tier: 50% | Functional/Unit leaders: 31% | EMEA: 30% |
| Smaller Players: 17% | Managers: 55% | Americas: 20% |
Market-Sizing & Forecasting
Market sizing used a top-down and bottom-up blend, where the main build started from global electronics output and trade-linked demand pools and was then translated into inductor revenue using penetration and content assumptions by end-use. Because inductors are tied closely to power management and signal conditioning needs, we used indicators such as consumer electronics shipment direction, vehicle electrification intensity, telecom and data center build activity, industrial automation demand, and the mix shift between power and high-frequency applications to shape volumes.
Those totals were corroborated with selective bottom-up checks, including sampled ASP times estimated unit volumes, channel feedback on price bands, and supplier-side revenue pattern checks to ensure totals did not drift beyond what the supply chain can support. Where data was thin, gaps were handled by applying conservative range assumptions and then tightening them through repeated interview validation.
For forecasting, scenario analysis was used so the outlook could flex with electronics cycle swings, regional manufacturing shifts, and expected pricing normalization. The final path was selected after aligning key variables with what industry participants viewed as the most probable demand and inventory trajectory over the forecast window.
Data Validation & Update Cycle
Validation was handled through triangulation across independent signals, followed by structured variance checks at the region and application level so outliers were explained rather than averaged away. When a modeled jump in demand or pricing did not match trade direction, end-market shipment movement, or supplier commentary, the assumptions were reworked and, when needed, respondents were re-contacted to confirm what had changed.
Before sign-off, the work goes through multi-step analyst review where inputs, calculations, and conversions are rechecked, and inconsistencies are resolved with supporting notes. Reports are refreshed annually, and interim updates are made when material events occur, after which a final pre-delivery pass is completed so clients receive the latest updated view.
Mordor Intelligence's Global Inductors Market Size Compared With Other Published Estimates
Published market sizes for inductors rarely match exactly because the boundary of what counts as an inductor is not always treated the same way, and the year used for pricing and currency conversion can shift totals. Differences also come from whether the study uses a shipment-based view, a demand-content view, or a mix of both, which changes how inventory swings get reflected.
Key gap drivers in this market usually sit around product scope and the way ASPs are progressed through the cycle, particularly when power inductors and high-frequency parts are blended without clear mix logic. By tracking shipment-linked demand indicators and refresh timing, Mordor Intelligence places the estimate on discrete inductor revenue only (excluding loose beads and bare cores), which explains why some broader component counts land lower or higher depending on what they include.
Benchmark comparison
| Source | Market Size | Gaps in Research Methodology |
|---|---|---|
| Mordor Intelligence | USD 11.76 B (2026) | |
| Trade Publisher A | USD 7.30 B (2024) | Uses a base-year revenue view with a different time window and may lean on a narrower counted revenue pool tied to earlier-cycle pricing, which can understate later recovery and mix shift effects. |
| Industry Research Group B | USD 4.74 B (2024) | Appears to apply a tighter definition and a smaller covered revenue set, and the estimate is anchored to 2024 pricing levels that can compress value when compared with later-year normalization. |
The table shows that year selection and what gets counted as an inductor drive most of the spread, more than any single growth assumption. When the scope is kept to discrete inductors and pricing is aligned to the stated year, the resulting market size becomes easier to trace back to clear demand signals and repeatable calculation steps.
Key Questions Answered in the Report
What is the current size of the inductor market?
The global inductor market size reached USD 11.76 billion in 2026 and is forecast to grow to USD 14.47 billion by 2031.
Which segment is growing fastest in the inductor market?
Automotive applications are expanding at a 5.82% CAGR as electric-vehicle powertrains require significantly more inductors than combustion platforms.
Why are nanocrystalline cores gaining popularity?
Nanocrystalline alloys cut core loss at 1 MHz by more than 60% versus ferrite, making them ideal companions for GaN and SiC power stages.
How will 5G deployments influence inductor demand?
Each massive-MIMO 5G base station integrates hundreds of high-frequency inductors, supporting sustained demand as operators densify mid-band and millimeter-wave networks.
What are the main risks facing inductor suppliers?
Raw-material price volatility, particularly in copper and ferrite, plus thermal challenges in embedded designs, can squeeze margins and delay new product introductions.