Transparent Electronics Market Size and Share
Market Overview
| Study Period | 2020 - 2031 |
|---|---|
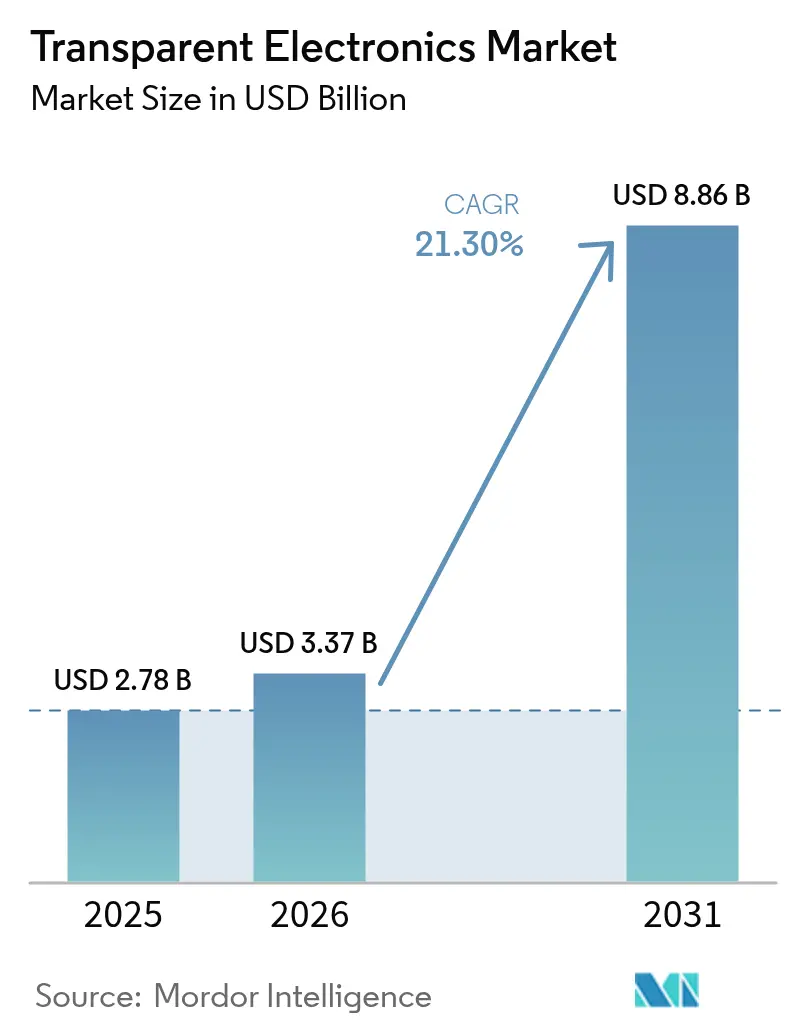
| Market Size (2026) | USD 3.37 Billion |
| Market Size (2031) | USD 8.86 Billion |
| Growth Rate (2026 - 2031) | 21.30% CAGR |
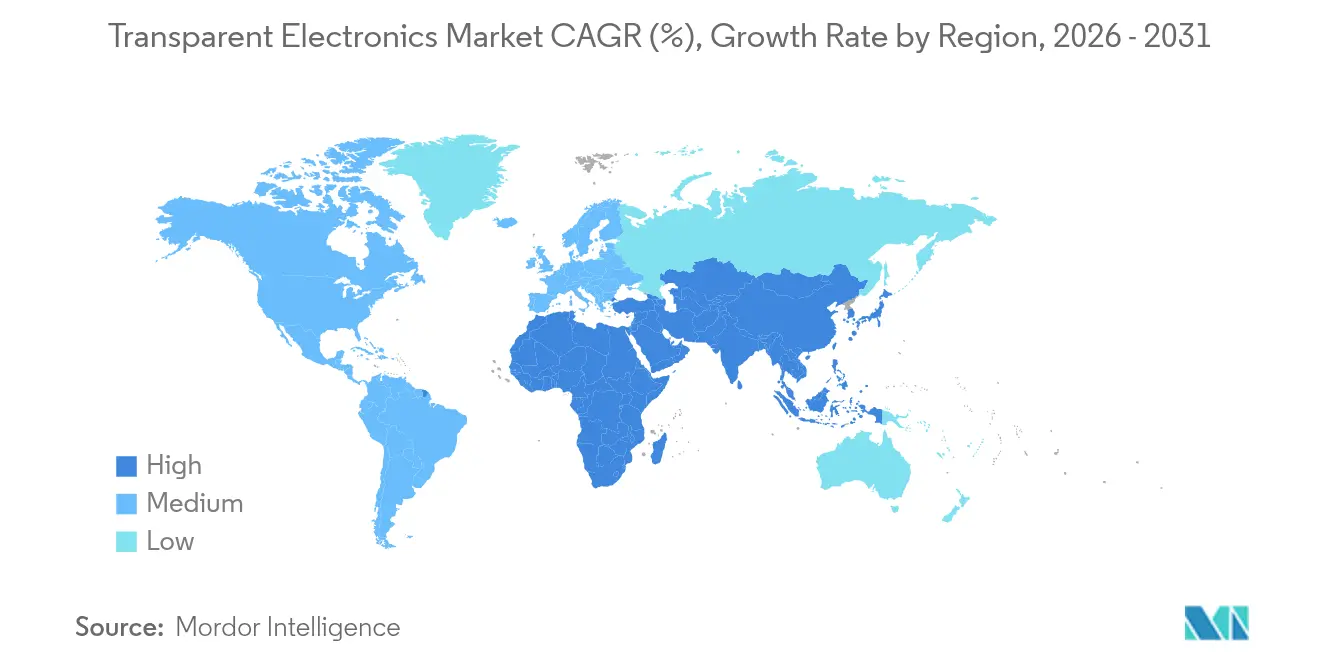
| Fastest Growing Market | Middle East |
| Largest Market | Asia Pacific |
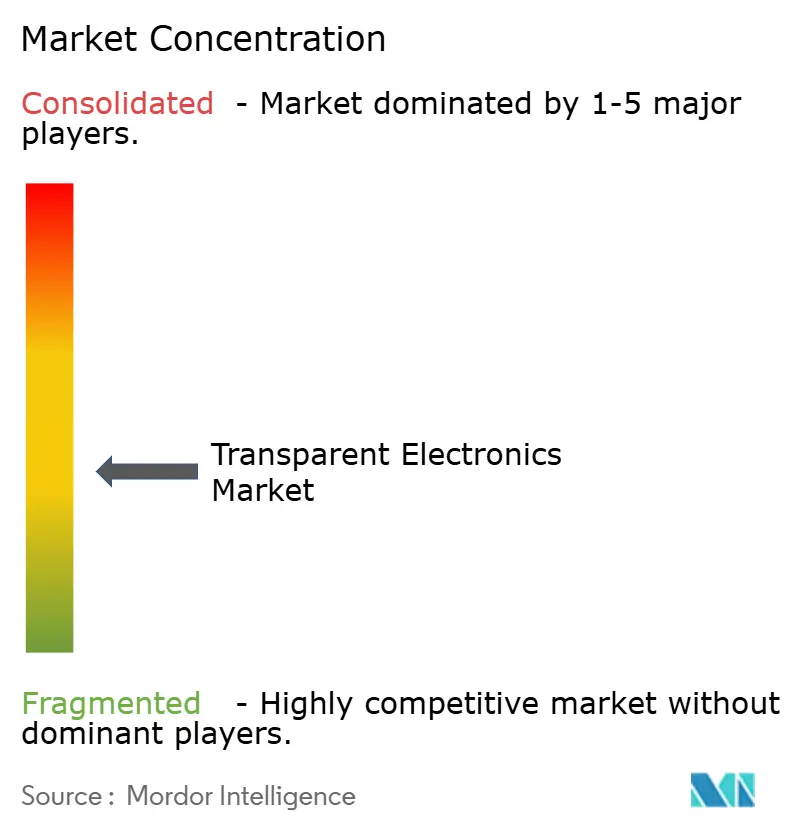
| Market Concentration | Medium |
Major Players *Disclaimer: Major Players sorted in no particular order Image © Mordor Intelligence. Reuse requires attribution under CC BY 4.0. | |
Transparent Electronics Market Analysis by Mordor Intelligence
The transparent electronics market size was valued at USD 2.78 billion in 2025 and estimated to grow from USD 3.37 billion in 2026 to reach USD 8.86 billion by 2031, at a CAGR of 21.30% during the forecast period (2026-2031). Product innovation that merges optical clarity with electronic functionality is shifting the technology from niche display uses toward mainstream roles in energy-smart buildings, advanced vehicle cockpits, and immersive retail. Regulatory pressure for net-zero construction, the electrification of transport, and rising demand for interactive commercial spaces are accelerating capital flows into transparent photovoltaic, micro-LED, and electrochromic platforms. Competitive advantage is increasingly determined by access to flexible materials and high-yield deposition processes rather than panel size alone. Manufacturers that diversify beyond indium tin oxide (ITO) and align with building-integrated photovoltaics (BIPV) or autonomous-vehicle electronics are positioned to capture the next wave of growth.
Key Report Takeaways
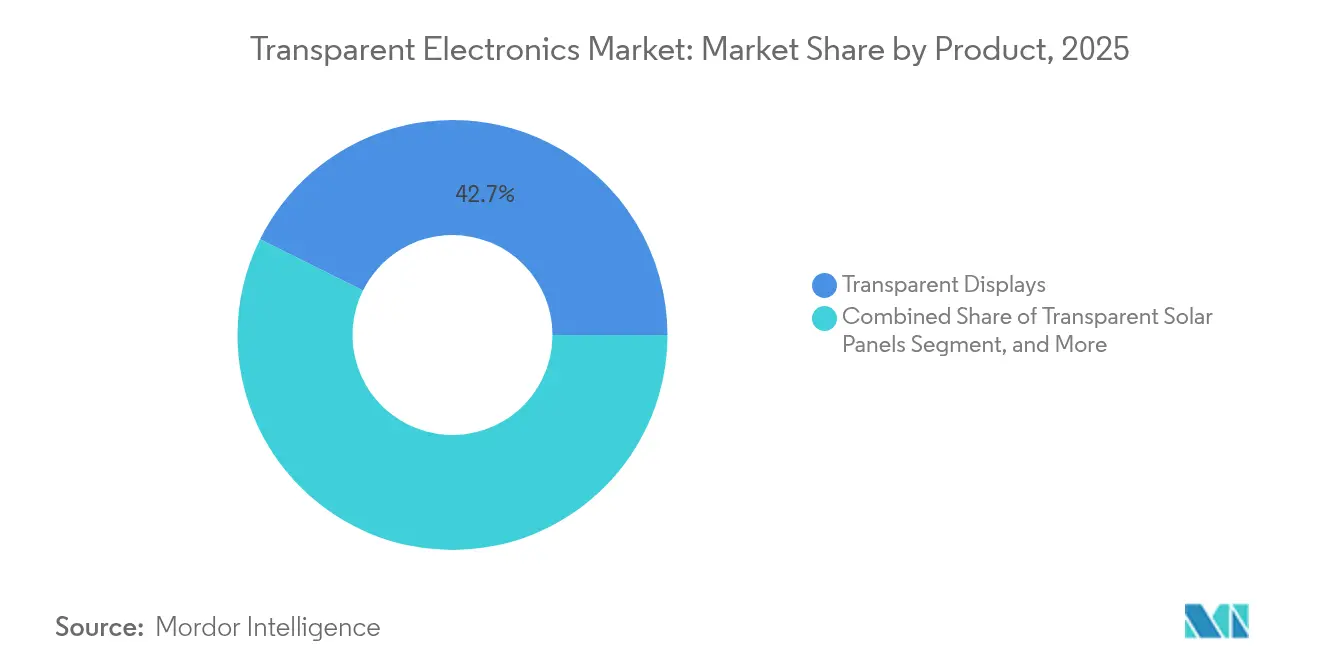
- By product, transparent displays led with 42.65% revenue share in 2025; transparent solar panels are projected to register the fastest CAGR at 25.05% through 2031.
- By material, indium tin oxide retained 51.35% share in 2025, while silver nanowire and metal mesh are advancing at 21.90% CAGR to 2031.
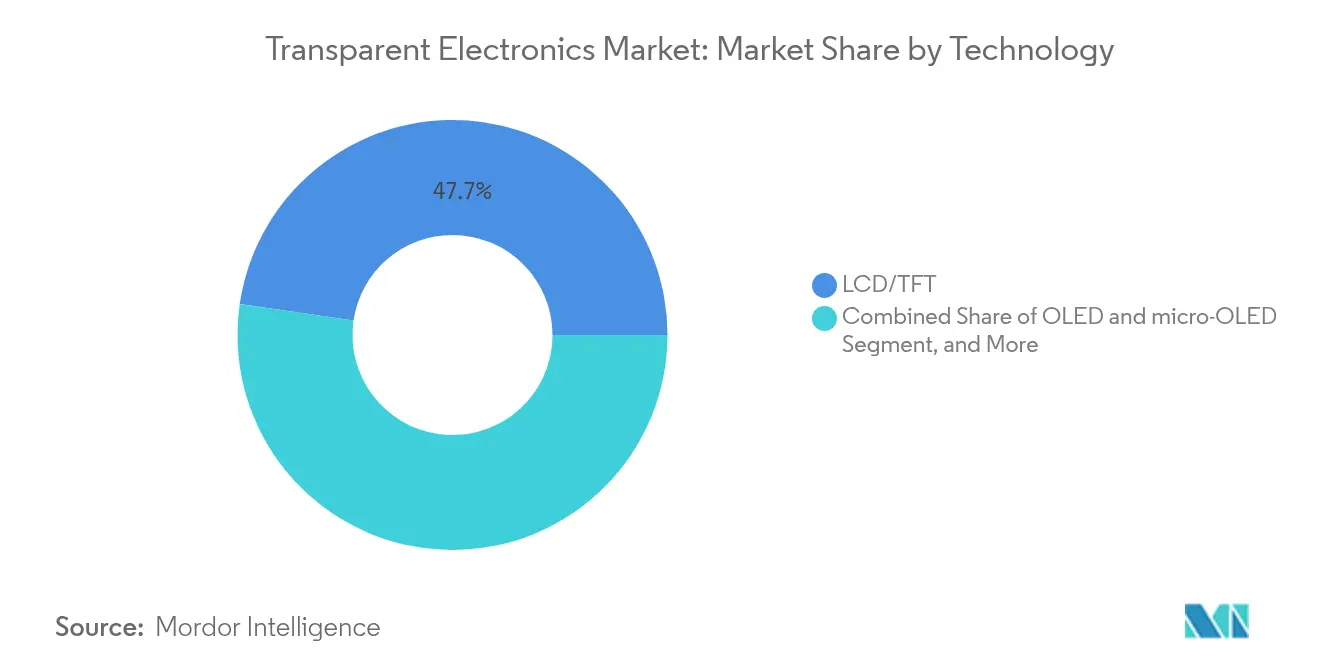
- By technology, LCD/TFT commanded 47.70% of the transparent electronics market size in 2025; OLED and micro-OLED are on track for a 22.80% CAGR to 2031.
- By end-user application, consumer electronics held 54.05% of the transparent electronics market size in 2025; building and infrastructure is forecast to expand at 25.10% CAGR to 2031.
- By geography, Asia Pacific captured 42.80% of transparent electronics market share in 2025, while the Middle East and Africa region is anticipated to grow at 22.15% CAGR from 2026 to 2031.
Note: Market size and forecast figures in this report are generated using Mordor Intelligence’s proprietary estimation framework, updated with the latest available data and insights as of 2026.
Global Transparent Electronics Market Trends and Insights
Drivers Impact Analysis*
| Driver | (~) % Impact on CAGR Forecast | Geographic Relevance | Impact Timeline |
|---|---|---|---|
| Net-zero building codes accelerating smart-window adoption | +5.3% | European Union; spillover to North America | Medium term (2-4 years) |
| Rapid uptake of head-up displays in autonomous and EV cockpits | +4.8% | North America, Europe, China, Japan | Short term (≤ 2 years) |
| AR-enabled transparent retail signage surge in Asia’s tier-1 cities | +3.7% | Asia Pacific | Short term (≤ 2 years) |
| Building-integrated PV mandates spurring transparent solar panels | +4.2% | China; wider Asia Pacific | Medium term (2-4 years) |
| Wearable medical sensors requiring flexible transparent conductors | +3.1% | Global | Medium term (2-4 years) |
| Source: Mordor Intelligence | |||
Net-zero building codes driving smart-window integration
European legislation that mandates nearly zero-energy performance for all new structures by 2030 is pushing architects toward electrochromic glazing that dynamically modulates solar gain. Pilot installations across Germany and Scandinavia have shown cooling-energy cuts exceeding 20%, and newer liquid-flow electrochromic designs added the ability to shift interior temperatures 5 °C seasonally[1]Yifeng Huang, “A Novel Liquid Flow Electrochromic Smart Window for All-Year-Round Dynamic Photothermal Regulation,” Energy and Environmental Science, rsc.org. Integration with building-automation systems is becoming standard, opening revenue streams for sensor and controls suppliers alongside panel manufacturers. Medium-term growth prospects are reinforced by funding under national renovation programs, which reserve dedicated budgets for envelope upgrades that include smart windows.
Autonomous vehicles accelerating transparent display adoption
Automakers are turning to large-format transparent head-up displays (HUDs) that project navigation, driver-assist, and infotainment data directly onto windshields. Recent micro-LED prototypes have achieved 85% transparency while retaining 1,000-nit brightness, overcoming prior glare limitations in variable daylight. This capability satisfies stringent driver-distraction and safety norms in the United States, Japan, and the EU, triggering design wins in mid-segment electric vehicles slated for 2026 release. Short-term demand is amplified by the transition to autonomous Level 3 functions, which require larger visual fields for system-status information.[2] Samsung Electronics, “AI-Driven and Sustainable Signage Solutions Earn Top Awards at ISE 2025,” news.samsung.com
Retail transformation through transparent digital signage
Flagship stores across Shanghai, Tokyo and Seoul are deploying augmented-reality retail walls that overlay dynamic content on physical merchandise without obstructing the view. The approach converts window space into interactive sales channels that raise foot-traffic conversion, especially in luxury goods and automotive showrooms. Rapid panel turnover cycles, driven by seasonal promotions, create repeat demand for lightweight, easy-change micro-LED glass modules. Category growth benefits from favorable shop-fittings regulations that classify transparent signage as façade enhancement rather than structural modification.
Building-integrated photovoltaics expanding transparent solar innovation
China’s BIPV quota that links commercial-property permits to rooftop or façade solar capacity is reshaping architectural glass procurement. Tandem perovskite-organic cells have reached 12.3% efficiency at 30% transparency, making them viable for curtain-wall applications where daylighting is critical[3]University of Southern Denmark, “Transparent Tandem Solar Cell Hits 12.3% Efficiency,” pv-magazine.com. Suppliers able to laminate photovoltaic layers within standard IGU formats are forming joint ventures with local façade contractors, accelerating market penetration over the next four years.
Restraints Impact Analysis*
| Restraint | (~) % Impact on CAGR Forecast | Geographic Relevance | Impact Timeline |
|---|---|---|---|
| Indium price volatility and supply concentration | −2.8% | Global; highest impact in Asia Pacific | Short term (≤ 2 years) |
| Low-yield scaling of large-area transparent OLED panels | −2.3% | Global manufacturing hubs | Medium term (2-4 years) |
| E-waste rules on heavy-metal oxide films | −1.7% | European Union | Medium term (2-4 years) |
| High CapEx for magnetron sputtering and ALD equipment | −1.9% | Global; emerging markets | Long term (≥ 4 years) |
| Source: Mordor Intelligence | |||
Indium supply vulnerabilities threatening production stability
ITO remains the workhorse transparent conductor, yet more than half of refined indium originates from a single country, exposing panel producers to sudden spot-price swings above 30% per annum. These spikes compress display-maker margins and delay capacity-expansion decisions. Materials firms are responding with silver-nanowire alternatives that exhibit sub-30 Ω/sq resistance at 90% transmittance while tolerating 1,000 bending cycles[4]DuPont, “Activegrid Silver-Nanowire Films Advance Flexible Transparent Electronics,” dupont.com. The transition, however, requires new curing temperatures and patterning chemistries, prolonging qualification cycles for high-volume production.
Yield losses escalate sharply when transparent OLED panels exceed 30-inch diagonals, driven by particle contamination and non-uniform organic deposition. Premium interior-design installations carry price tags up to USD 60,000 for a 55-inch panel, restricting volume adoption. Ongoing R&D focuses on hybrid laser-vacuum encapsulation to minimize moisture ingress, but scalable commercial solutions are unlikely before 2027. In the interim, suppliers segment the market into smaller consumer devices and high-margin architectural showcases.
*Our forecasts treat driver/restraint impacts as directional, not additive. The impact forecasts reflect baseline growth, mix effects, and variable interactions.
Segment Analysis
By Product: Transparent solar panels disrupt energy integration
Transparent displays generated the largest revenue share in 2025 at 42.65%, yet transparent solar panels are projected to grow at a 25.05% CAGR to 2031, propelled by building codes that reward on-site generation. A Swiss venture introduced a 400 W glass-like BIPV module that blends into standard façades without altering exterior aesthetics. The transparent electronics market size for solar panels is forecast to reach USD 2.26 billion by 2031, reflecting their dual role as power generators and daylighting surfaces. Product diversification now extends to transparent conductive films that underpin touch sensors and heaters, as well as rugged transparent ceramics for aerospace shielding. Smart-window units equipped with dynamic tinting continue to gain traction in commercial real estate, aided by operating-cost reductions that shorten payback periods to under five years in warm climates.
The transparent electronics market increasingly values interoperability between product categories. Emerging tandem solar cells share deposition tools with micro-LED backplanes, enabling multi-purpose manufacturing lines. Transparent sensors embedded in vehicle windshields are beginning to feed occupancy and environment data into advanced driver-assistance systems, illustrating how value migrates from stand-alone components to integrated functions.


By Material Type: Silver nanowires challenge ITO dominance
Indium tin oxide accounted for 51.35% of transparent electronics market share in 2025, underscoring its entrenched position across LCD/TFT and touch-panel supply chains. Nevertheless, silver-nanowire composites and metal meshes are expected to erode this lead, climbing at 21.90% CAGR through 2031. Lab devices have demonstrated 26 Ω/sq sheet resistance at 90% transmittance, with only 10% resistance drift under 120% strain, making them viable for foldable phones and e-skin patches. Application-specific optimisation guides material choice. Conductive polymers such as PEDOT:PSS now coat injection-moulded plastic substrates for low-cost, flexible displays, while graphene manages heat and signal-uniformity challenges in wearable biosensors. Transparent ceramics secure niche demand in harsh-environment optics, and carbon-nanotube hybrids are emerging in electromagnetic-shielding layers where optical transparency is non-negotiable.
By Technology: OLED innovations drive premium applications
LCD/TFT remained the volume leader with 47.70% share in 2025 thanks to mature fabrication and cost efficiency. However, the transparent electronics market anticipates faster expansion in OLED and micro-OLED at a 22.80% CAGR to 2031, buoyed by their high contrast and thin-film form factors. Recent demonstrators integrate fingerprint and heart-rate sensing within the OLED stack, removing separate cover-glass components.
Quantum-dot emissive layers are improving colour purity, while transparent micro-LED tiles deliver 1,000-nit brightness for sunlit retail environments. Electrochromic and suspended-particle-device technologies, though outside the display mainstream, now achieve switching times under one second, enabling dynamic storefronts that alternate between full signage and clear window modes throughout the trading day.
By End-user Application: Buildings emerge as growth catalyst
Consumer electronics held 54.05% of 2025 revenue, yet construction is poised to be the fastest-rising user segment at 25.10% CAGR. The transparent electronics market size for building applications is projected to surpass USD 1.24 billion by 2031 as smart façades combine power generation, daylight control and occupant-information displays. Electrochromic glazing linked to HVAC systems can cut annual cooling loads by 20% in temperate zones, bolstering facility-manager payback arguments.
Automotive suppliers weave transparent heaters into windshield HUDs to ensure all-weather performance, while agrivoltaic greenhouses employ semi-transparent photovoltaic roofs that balance light spectra for crop growth with electricity production. Healthcare is adopting stretchable transparent circuits in patches that unobtrusively track vital signs, signalling a move toward ambient, always-on medical diagnostics embedded in everyday surfaces.
Geography Analysis
Asia Pacific commanded 42.80% of 2025 revenue, anchored by high-volume fabs for displays and the world’s largest BIPV programme in China. Government incentives that link urban air-quality targets to renewable-energy capacity fuel adoption of transparent solar façades in megacities such as Shanghai and Shenzhen. Japanese and South Korean firms dominate OLED research, regularly showcasing prototypes that set new benchmarks in transmittance and pixel density.
North America leverages its leadership in autonomous-vehicle software to accelerate demand for transparent HUDs and sensor-rich windshields. Building-energy rules vary by state, yet collectively favour electrochromic adoption in commercial retrofits. Europe’s strict 2030 climate agenda places smart glass and BIPV at the centre of renovation funding, driving a surge of cross-border partnerships between façade contractors and materials specialists.
The Middle East and Africa is forecast to grow at 22.15% CAGR from 2026 to 2031 as smart-city investments integrate digital signage, adaptive shading and solar glass in landmark projects. Saudi Arabia’s Vision 2030 allocates multi-billion-dollar budgets to immersive heritage sites that blend transparent display walls with interactive content. Latin America represents an untapped frontier where abundant solar irradiance aligns with transparent PV adoption in urban high-rise developments, although supply-chain hurdles and financing costs temper near-term uptake.

Competitive Landscape
The market structure is moderately concentrated, with the top five display panel makers, led by Samsung Display, LG Display and BOE Technology, accounting for the bulk of transparent OLED and micro-LED capacity. Materials leadership resides with Corning, AGC and NSG Group for glass substrates, while DuPont and Cambrios champion silver-nanowire conductive inks. Ecosystem collaborations are pivotal: Nanolumens and AUO Display Plus jointly unveiled a 64-inch transparent micro-LED wall in 2025 that targets high-traffic retail and museum venues. Start-ups focus on white-space opportunities. Ubiquitous Energy pursues visibly clear photovoltaic coatings, and Brite Solar targets greenhouse glazing that manages photosynthetically active radiation. Intellectual-property battles underline the stakes; 2025 saw patent litigation in the United States over AMOLED emitter stacks, signalling rising entry barriers for latecomers. Capital intensity for vacuum-deposition lines remains high, steering newcomers toward asset-light licensing or component niches rather than full-panel fabrication.
Transparent Electronics Industry Leaders
ClearLED Ltd
Corning Incorporated
Samsung Display Co., Ltd
LG Display Co., Ltd.
Brite Solar Inc.
- *Disclaimer: Major Players sorted in no particular order

Recent Industry Developments
- May 2025: AUO captured “Best Micro LED-Based Technology” at SID 2025 with a 64-inch transparent display, and Nanolumens partnered with AUO to commercialise SeeThrµ panels for retail installations.
- May 2025: TOPPAN Holdings acquired Sonoco’s thermoformed and flexible-packaging assets, broadening its transparent barrier-film portfolio for food and medical use.
- April 2025: DuPont introduced Activegrid silver-nanowire films with enhanced flexibility for foldable OLED and transparent heater markets.
- March 2025: University of Southern Denmark researchers reached 12.3% efficiency at 30% transparency in tandem solar cells, advancing BIPV feasibility.
- February 2025: Samsung won “Digital Signage Innovation of the Year” at ISE 2025 for its transparent MICRO LED panels that combine crystal-clear glass and AI-driven content optimization.
- January 2025: G Electronics unveiled the Signature OLED T 4K transparent TV at CES 2025, offering switchable opacity for living-room or showroom settings.


Research Methodology Framework and Report Scope
Market Definitions and Key Coverage
Our study defines the transparent electronics market as the global sale of newly manufactured components and finished devices that retain at least 80 % optical transmittance while performing an electronic function; examples include transparent OLED and micro-LED displays, conductive films, smart windows, and see-through photovoltaic panels.
Scope Exclusion: Refurbished or aftermarket retrofit films and coatings are not included.
Segmentation Overview
- By Product
- Transparent Displays
- Transparent Solar Panels
- Smart Windows/Smart Glass
- Transparent Conductive Films
- Transparent Ceramics and Aluminum
- Transparent Sensors and Others
- By Material Type
- Indium Tin Oxide (ITO)
- Alternative TCOs (AZO, FTO)
- Silver Nanowire and Metal Mesh
- Carbon-Based Nanomaterials (Graphene, CNT)
- Conductive Polymers (PEDOT:PSS)
- By Technology
- LCD/TFT
- OLED and micro-OLED
- Quantum-Dot and micro-LED
- Thin-Film Photovoltaic (CIGS, Perovskite)
- Electrochromic and SPD
- By End-user Application
- Consumer Electronics
- Automotive and Transportation
- Building and Infrastructure
- Energy and Utilities (BIPV, Agrivoltaics)
- Aerospace and Defense
- Healthcare and Wearables
- Retail and Digital Signage
- By Geography
- North America
- United States
- Canada
- Mexico
- Europe
- Germany
- United Kingdom
- France
- Italy
- Spain
- Nordics (Denmark, Sweden, Norway, Finland)
- Rest of Europe
- Asia-Pacific
- China
- Japan
- South Korea
- India
- Southeast Asia
- Australia
- Rest of Asia-Pacific
- South America
- Brazil
- Argentina
- Rest of South America
- Middle East
- Gulf Cooperation Council Countries
- Turkey
- Rest of Middle East
- Africa
- South Africa
- Nigeria
- Rest of Africa
- North America
Detailed Research Methodology and Data Validation
Primary Research
Conversations with display-panel engineers, building-integrated photovoltaic installers, and Tier-1 automotive glazing buyers across Asia-Pacific, North America, and Europe clarified yield rates, adoption curves, and realistic average selling prices. Follow-up surveys with facility managers using transparent BIPV validated real-world payback assumptions that secondary data alone could not surface.
Desk Research
Public data streams anchor the evidence base. Analysts reviewed customs codes for indium tin oxide sheets, harmonized tariff 901380, on UN Comtrade; quarterly smartphone panel shipments from the International Data Corporation; thin-film solar efficiency charts published by the U.S. National Renewable Energy Laboratory; and patent families for transparent conductive oxides retrieved through Questel. Complementary context came from energy-efficient building statistics at the International Energy Agency and road-safety mandates for head-up displays released by the United Nations Economic Commission for Europe.
Financial signals were cross-checked in D&B Hoovers, while news flow from Dow Jones Factiva helped trace capacity expansions and pricing inflections for silver nanowire meshes. These sources, among many others, inform but do not dictate the final numbers.
Market-Sizing & Forecasting
A top-down reconstruction converts production output, import-export balances, and average device ASPs into revenue, which Mordor Intelligence calculates. Supplier roll-ups and sampled retail checks provide selective bottom-up reasonableness tests before adjustments. Key variables like OLED smartphone penetration, square-meter installs of smart glass in commercial façades, HUD fitment rates per vehicle class, ITO price trends, and graphene yield improvements drive the multivariate regression used for projections. Gap areas in bottom-up data are bridged through parametric interpolation agreed upon during expert calls.
Data Validation & Update Cycle
Outputs pass variance screens against independent series (e.g., architectural glass shipments, solar-module ASP indices). Senior reviewers interrogate anomalies, and a fresh data sweep precedes every annual refresh, with interim updates triggered by material events such as a major capacity shutdown.
Why Our Transparent Electronics Baseline Commands Reliability
Published estimates often diverge; scope width, price assumptions, and refresh cadence typically explain the spread.
External publishers may exclude smart-window glass or apply single-region ASPs, whereas our model weights six regions, updates exchange rates quarterly, and balances top-down totals with field-tested unit economics. Scenario drift is contained because we cap CAGR adjustments to validated capacity additions.
Benchmark comparison
| Market Size | Anonymized source | Primary gap driver |
|---|---|---|
| USD 2.78 B (2025) | Mordor Intelligence | - |
| USD 1.76 B (2024) | Global Consultancy A | Omits transparent solar panels and applies factory-gate prices only. |
| USD 2.20 B (2024) | Industry Association B | Uses revenue declarations without channel mark-up normalization. |
| USD 1.53 B (2023) | Trade Journal C | Extrapolates older data and lacks multi-region calibration. |
Taken together, the comparison shows that our disciplined scope setting and constant data hygiene yield a balanced, traceable baseline that decision-makers can reproduce and stress-test with confidence.


Key Questions Answered in the Report
What is the current value of the transparent electronics market?
The transparent electronics market size reached USD 3.37 billion in 2026 and is projected to hit USD 8.86 billion by 2031.
Which segment is expanding the fastest?
Transparent solar panels are forecast to grow at a 25.05% CAGR between 2026 and 2031 as building-integrated photovoltaics gain policy support.
Why is Asia Pacific so dominant?
The region hosts the largest display-fabrication clusters, aggressive BIPV mandates in China and rapid retail adoption of transparent digital signage, giving it 42.80% revenue share in 2025.
How are material shortages being addressed?
Manufacturers are diversifying beyond indium tin oxide by adopting silver-nanowire and metal-mesh conductors that deliver comparable transparency with greater flexibility.
What role do smart windows play in energy efficiency?
Electrochromic glazing integrated with building-management systems can cut cooling energy use by about 20%, supporting EU net-zero construction directives.
Are transparent electronics limited to displays?
No. Applications now include solar-generating curtain walls, windshield heaters, stretchable medical sensors and greenhouse roofs, reflecting a shift toward multifunctional surfaces.
Page last updated on:


