Electronic Components Market Size and Share
Market Overview
| Study Period | 2019 - 2030 |
|---|---|
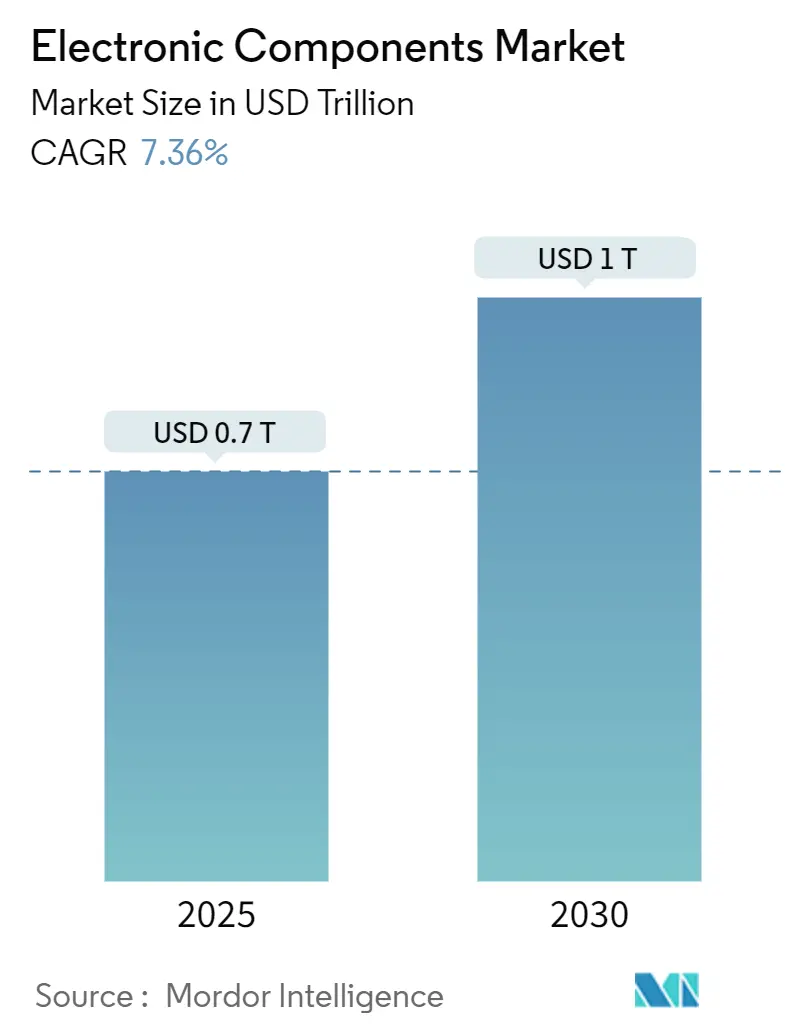
| Market Size (2025) | USD 0.7 Trillion |
| Market Size (2030) | USD 1 Trillion |
| Growth Rate (2025 - 2030) | 7.36% CAGR |
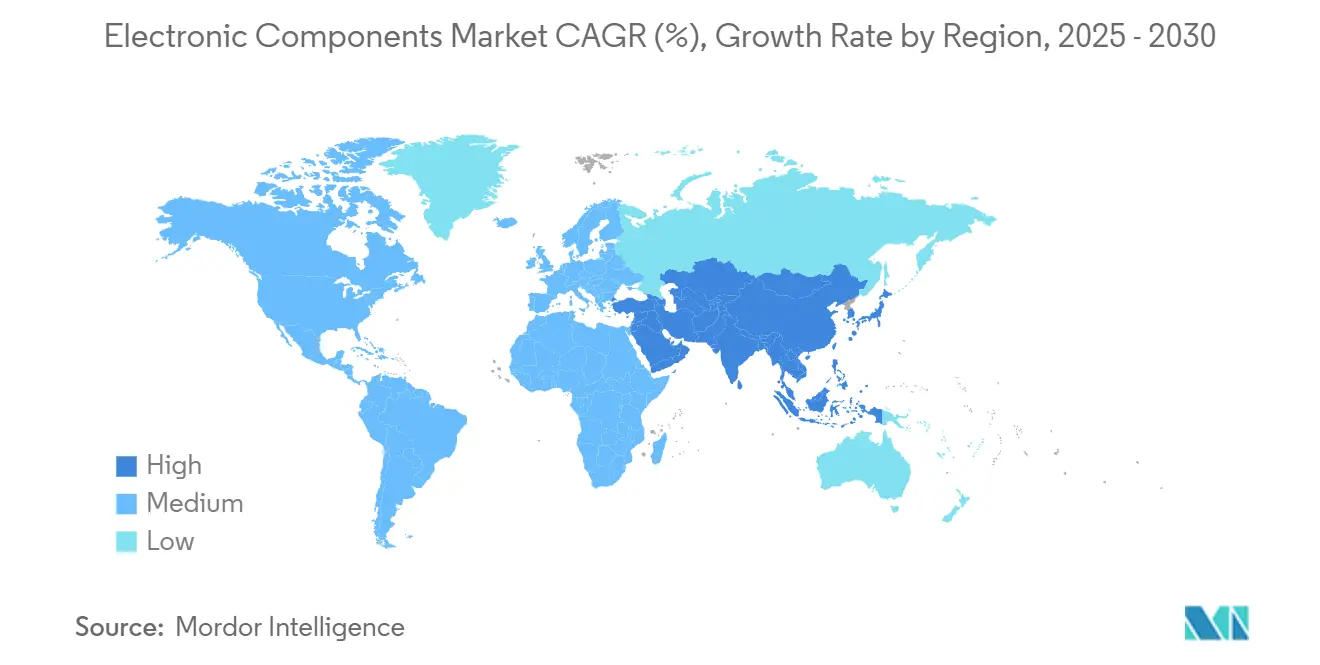
| Fastest Growing Market | Middle East and Africa |
| Largest Market | Asia Pacific |
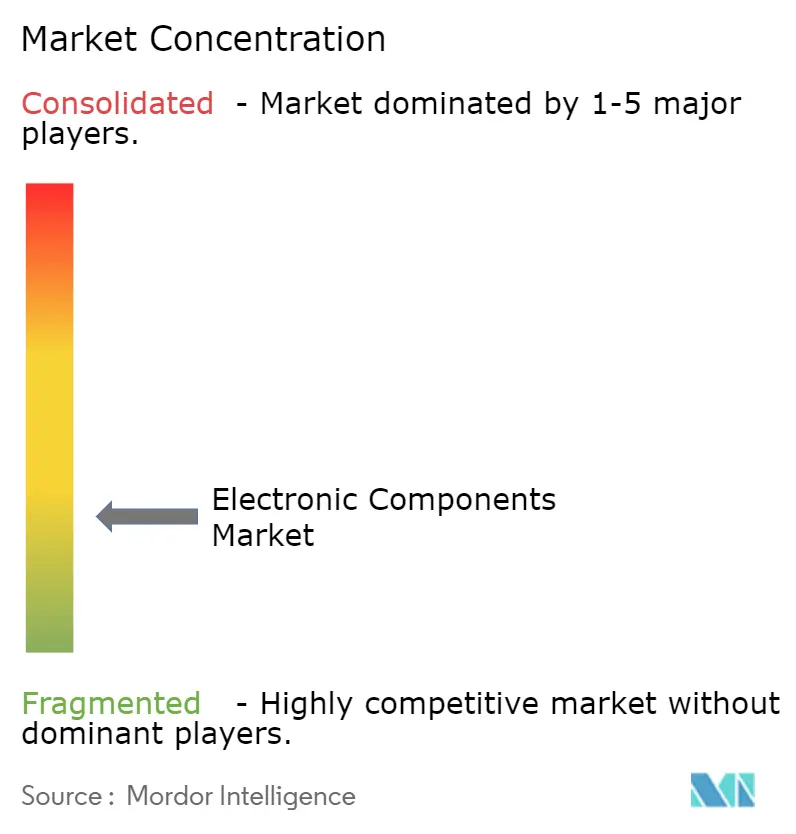
| Market Concentration | Low |
Major Players *Disclaimer: Major Players sorted in no particular order Image © Mordor Intelligence. Reuse requires attribution under CC BY 4.0. | |
Electronic Components Market Analysis by Mordor Intelligence
The electronic components market size reached USD 701 billion in 2025 and is forecast to rise to USD 1 trillion by 2030, reflecting a 7.36% CAGR over the period. Growth is underpinned by widening adoption of artificial-intelligence hardware, vehicle electrification, and factory digitalization. Government incentives such as the USD 52.7 billion U.S. CHIPS Act and the EUR 43 billion EU Chips Act are redrawing supply chains while keeping demand resilient.[1]Center for Strategic and International Studies, “Transatlantic Cooperation on Semiconductors and AI in 2024,” csis.org Asia-Pacific still accounts for almost half of global revenue but capacity diversification in North America, Europe, and India is accelerating. Rising fab equipment outlays-estimated at USD 400 billion for 300 mm lines between 2025 and 2027-illustrate the capital intensity of next-generation production.[2]SEMI, “Global Semiconductor Industry Plans to Invest USD 400 Billion in 300 mm Fab Equipment Over Next Three Years,” semi.org At the same time, component miniaturization, wide-bandgap power devices, and high-frequency RF front-ends are broadening the application landscape and lifting average content per end product.
Key Report Takeaways
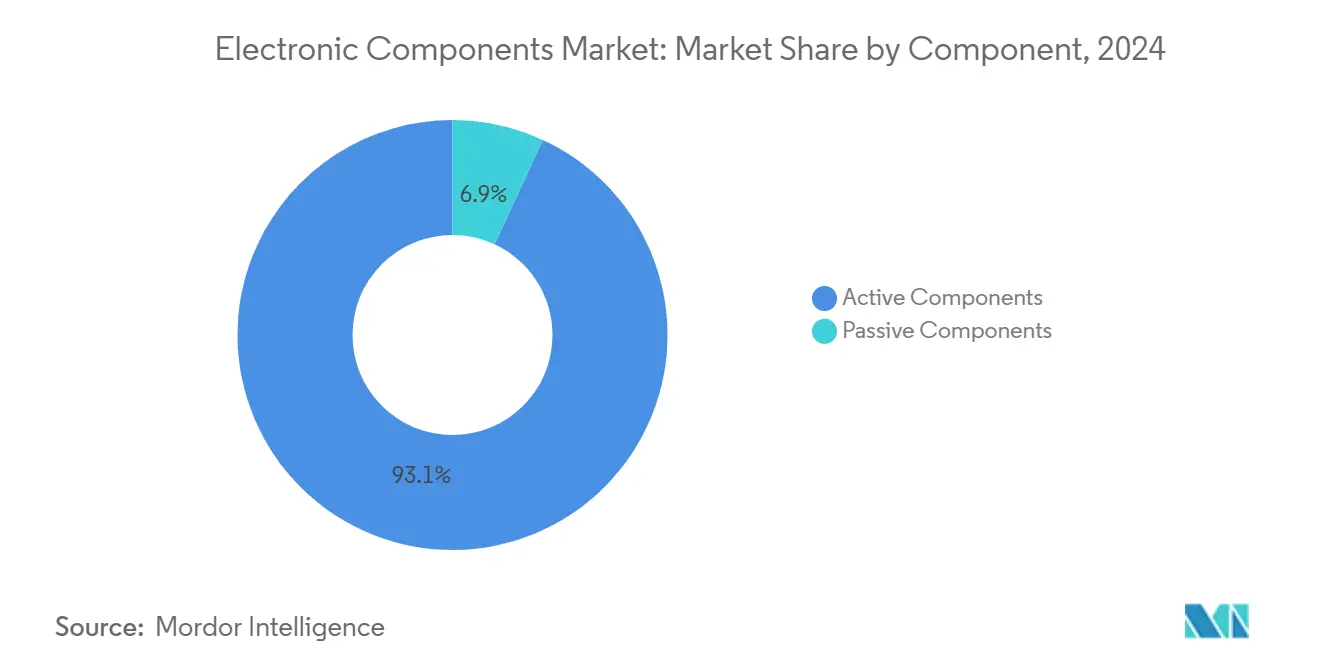
- By component, active devices led with 93.1% of electronic components market share in 2024, while passive parts are projected to expand at an 8.3% CAGR through 2030.
- By mounting technology, surface-mount devices held 81.6% revenue share in 2024; the same category is forecast to grow 7.5% annually to 2030.
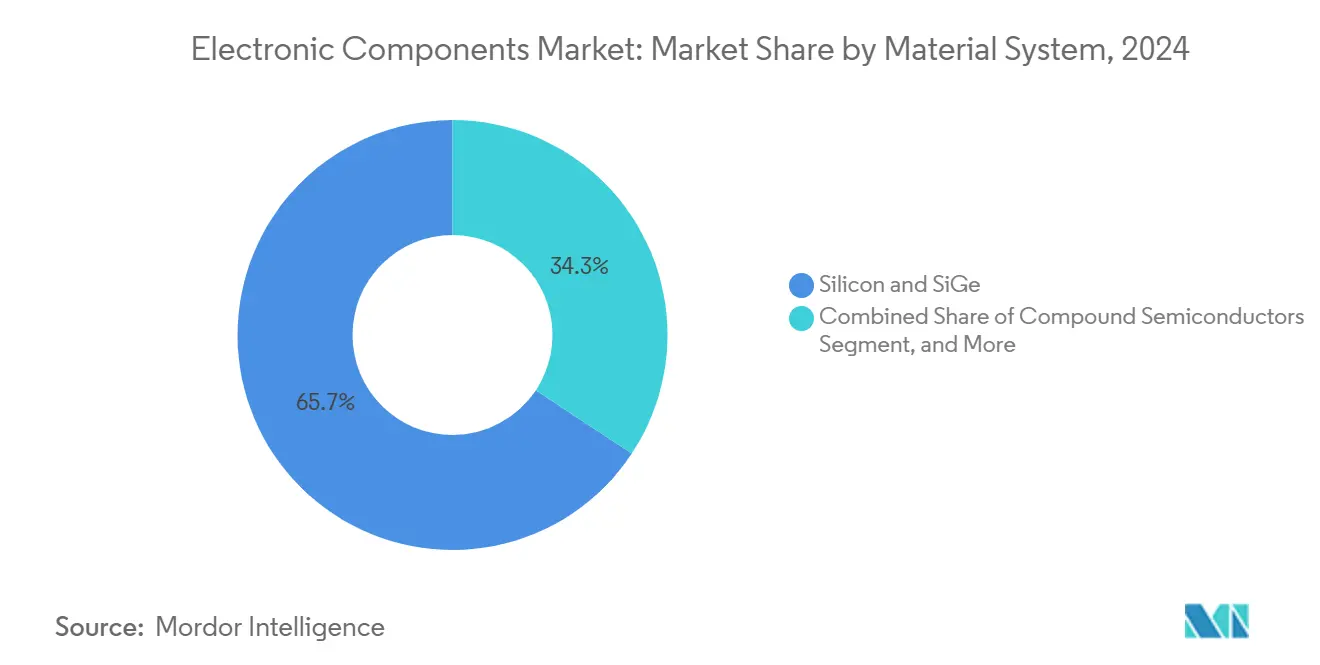
- By material system, silicon & silicon-germanium captured 65.7% of electronic components market share in 2024, whereas compound semiconductors are poised to rise at a 7.9% CAGR.
- By end-user industry, consumer electronics commanded 33.8% of 2024 revenue, while automotive applications are advancing at an 8.1% CAGR to 2030.
- By geography, Asia-Pacific represented 47.5% of 2024 sales; the Middle East & Africa is the fastest-growing region at 7.5% CAGR.
Global Electronic Components Market Trends and Insights
Drivers Impact Analysis*
| Driver | (~) % Impact on CAGR Forecast | Geographic Relevance | Impact Timeline |
|---|---|---|---|
| Surging demand for high-density, miniaturized components in wearables and IoT devices | +1.2% | Asia-Pacific core, spill-over to North America | Medium term (2-4 years) |
| Rapid electrification of drivetrain and ADAS architectures in automobiles | +1.8% | Europe, North America, expanding to Asia-Pacific | Medium term (2-4 years) |
| Government-backed semiconductor self-reliance programs | +1.5% | United States, EU, India, with secondary effects globally | Long term (≥ 4 years) |
| 5G/6G infrastructure roll-outs accelerating RF front-end uptake | +1.1% | North-East Asia, North America, selective European markets | Short term (≤ 2 years) |
| Proliferation of industrial automation requiring high-reliability passives | +0.9% | DACH region, Japan, expanding to Southeast Asia | Medium term (2-4 years) |
| Source: Mordor Intelligence | |||
Surging Demand for High-Density, Miniaturized Components in Wearables and IoT Devices
Edge AI chips now pack nearly 10 billion transistors at sub-10 nm nodes, enabling sophisticated analytics in fitness bands, smart glasses, and industrial beacons without sacrificing battery life. RF modules inside private 5G networks must support multi-band operation in ultra-small footprints, driving uptake of advanced duplexers and filters.[3]Rockwell Automation, “8 Key Industrial Automation Trends in 2025,” rockwellautomation.com In medical wearables, MEMS pressure and biochemical sensors provide early cancer screening and continuous cardiac monitoring while conforming to strict biocompatibility rules. High-density multilayer ceramic capacitors (MLCCs) and micro-inductors underpin these designs, prompting capacity additions among leading passive suppliers. Collectively, these demand vectors lift the electronic components market by enhancing volume and average selling prices across miniature formats.
Rapid Electrification of Drivetrain and ADAS Architectures in Automobiles
Battery-electric vehicles deploy 800 V platforms that rely on silicon-carbide MOSFET inverters switching above 100 kHz, slashing conduction losses versus legacy IGBTs.[4]Electropages, “SiC and GaN Power Semiconductors Extend EV Driving Range,” electropages.com Wolfspeed’s 400 A modules illustrate how wide-bandgap devices shrink thermal footprints by 40% and extend driving range. ADAS stacks combine radar, LiDAR, and camera arrays, multiplying the semiconductor bill of materials and pushing electronic content toward half of vehicle cost by 2030. Gallium-nitride chargers now deliver 11 kW at 95% efficiency, trimming onboard weight by 30% and freeing space for larger battery packs. As electric and software-defined cars scale globally, unit demand and device complexity reinforce electronic components market momentum.
Government-Backed Semiconductor Self-Reliance Programs
The CHIPS and Science Act has prompted USD 166 billion in announced U.S. fab investments, with Intel, TSMC, and Samsung building advanced-node sites expected to supply 28% of global leading-edge capacity by 2032. India’s USD 10 billion Production-Linked Incentive scheme aims to attract assembly and test providers and leverage the nation’s design workforce to claim a 20% share of global IC design talent. Europe targets a 20% global slice by 2030, linking EUR 43 billion in funding to sustainability metrics and circular-economy R&D. These policies expand geographically distributed capacity, lift long-term demand for production tools and materials, and buffer the electronic components market against single-region shocks
5G/6G Infrastructure Roll-Outs Accelerating RF Front-End Uptake
5G-Advanced equipment and embryonic 6G trials require envelope-tracking power amplifiers and beam-steered antenna arrays that integrate compound-semiconductor dies for millimeter-wave operation. The RF GaN device market could nearly double from USD 1.1 billion in 2023 to USD 2.07 billion by 2029, propelled by telecom operators densifying small-cell sites. Although mid-range Android demand softened in early 2025, premium smartphones offset volume dips with higher RF content, sustaining revenue opportunities for filter, switch, and tuner manufacturers. Thermal-management solutions and system-in-package integration become critical as carriers migrate toward 40 GHz spectrum, channeling further spend into the electronic components market.
Restraints Impact Analysis*
| Restraint | (~) % Impact on CAGR Forecast | Geographic Relevance | Impact Timeline |
|---|---|---|---|
| Prolonged silicon wafer and substrate shortages restricting active-device output | -1.4% | Global, acute in Asia-Pacific hubs | Short term (≤ 2 years) |
| Volatile rare-earth pricing inflating MLCC and inductor cost structures | -0.8% | Global, especially Chinese processing | Medium term (2-4 years) |
| Rising power-density generating thermal-management challenges beyond current package limits | -0.6% | Advanced-node regions, data-center builds | Medium term (2-4 years) |
| Visibility gaps in counterfeit component supply chains undermining OEM confidence | -0.5% | Global, high-risk defense and aerospace | Long term (≥ 4 years) |
| Source: Mordor Intelligence | |||
Prolonged Silicon Wafer and Substrate Shortages Restricting Active-Device Output
Global 300 mm capacity additions have not fully eased wafer tightness, keeping utilization rates near all-time highs. The 2024 hurricane that disrupted Spruce Pine quartz mining underscored concentration risk: one Appalachian site supplies up to 90% of high-purity quartz for crucibles used in crystal growth. Many suppliers hesitate to fund 200 mm line upgrades amid economic uncertainty, limiting near-term throughput expansion. Tight substrates constrain delivery schedules for CPU, GPU, and power device makers, moderating the short-term electronic components market trajectory.
Volatile Rare-Earth Pricing Inflating MLCC and Inductor Cost Structures
China refines roughly 90% of global rare earths, exposing price-sensitive MLCC production to geopolitical friction. Barium-titanate availability swings translate directly into capacitor cost spikes, while tantalum supply volatility hits high-density energy-storage parts fundamental to defense electronics. U.S. homeland-security assessments suggest a material shock could erase USD 602 billion of GDP, highlighting strategic vulnerability. Component makers hedge through multi-sourcing and recycled materials, yet persistent churn curbs margin expansion across the electronic components market.
*Our forecasts treat driver/restraint impacts as directional, not additive. The impact forecasts reflect baseline growth, mix effects, and variable interactions.
Segment Analysis
By Component: Active Dominance Meets Passive Innovation
Active devices commanded a 93.1% revenue edge in 2024, reflecting the centrality of CPUs, memory, and power ICs. High-bandwidth memory shipments alone are set to top USD 21 billion in 2025, pushed by AI training clusters that require extreme bandwidth density. Automotive traction inverters and industrial drives pivot to silicon-carbide MOSFETs, underlining the active segment’s technological pivot. Passive parts, though smaller, are sprinting ahead at an 8.3% CAGR as multilayer ceramic capacitors and thin-film inductors answer 5G and EV voltage-regulation needs. This divergence sustains high utilization at both foundries and passive factories, reinforcing demand across the electronic components market.
The proliferation of passive innovation narrows the performance gap with actives. MLCC counts per battery-electric vehicle surpass 15,000 units versus 3,000 in legacy cars, with AEC-Q200-qualified grades fetching premium pricing. Automotive-grade resistors now integrate anti-sulfur technology to mitigate reliability risks in high-temperature zones. Meanwhile, advanced driver assistance systems consume low-ESR polymer capacitors for image-processing boards, widening value pools for passive suppliers. As EV penetration deepens, passive revenues accelerate, elevating the overall electronic components market growth path.


By Mounting Technology: Surface-Mount Supremacy in Miniaturization Era
Surface-mount components held 81.6% of 2024 turnover, mirroring OEM quests for density and automated assembly efficiencies. Smartphone PCBs pack over 1,000 passives in shrinking 01005 and 0201 formats, an evolution made possible by sophisticated pick-and-place equipment. Automotive powertrains adopt surface-mount packages that tolerate thermal swings and vibration, a shift enabling compact in-cabin electronics and under-hood control units. Industrial IoT sensors equally favor reflow-compatible footprints to cut assembly cost and enhance RF performance, keeping the electronic components market firmly on the SMT trajectory.
Through-hole technology retains niche value in avionics, defense, and heavy-machinery power supplies where mechanical robustness and heat dissipation eclipse miniaturization priorities. Hybrid system-in-package designs now meld SMT dice, passives, and even micro-through-hole connectors to balance density with stress tolerance. Although SMT rules volume, such mixed approaches prolong the relevance of legacy assembly lines and help suppliers address diversified specifications. Continuous package evolution thus cements SMT leadership while keeping specialty formats alive within the electronic components market.
By Material System: Silicon Foundation Faces Compound-Semiconductor Challenge
Silicon and silicon-germanium accounted for 65.7% of 2024 revenue, a reflection of their unmatched cost-performance curve in logic, memory, and analog domains. Foundries continue scaling FinFET and gate-all-around nodes, sustaining silicon’s economies of scale. Yet compound semiconductors are pacing faster at a 7.9% CAGR as power, RF, and optoelectronic applications outstrip silicon’s physical limits. STMicroelectronics led with 32.6% electronic components market share in silicon-carbide power devices after capacity expansions in Italy and Singapore.
Gallium-nitride devices penetrate telecom base-stations and data-center PSUs, buoyed by Infineon’s trench-based superjunction rollout targeting AI server racks. Emerging photonic interposers blend silicon photonics with InP gain blocks, raising questions about supply-chain complexity but promising orders-of-magnitude bandwidth gains. Ceramic dielectric research pursues high-k materials to shrink RF capacitors, linking material science to board-level innovation. As adoption widens, compound substrates secure higher ASPs, preserving profitability for specialist foundries and solidifying their niche in the supply chain amidst growing demand for advanced electronic components.

By End-User Industry: Automotive Electrification Accelerates Component Evolution
Consumer electronics and computing delivered 33.8% of 2024 sales thanks to steady smartphone and laptop refresh cycles. However, the automotive vertical is growing the fastest at 8.1% CAGR because EV drivetrains and Level 2+ ADAS stacks raise semiconductor dollar content dramatically. Electric powertrains demand wide-bandgap MOSFETs, isolation transformers, and battery-management ICs, while smart headlights and cockpit infotainment systems add microcontrollers, sensors, and high-speed memory.
Industrial automation follows closely as predictive-maintenance deployments and robotics use cases proliferate on factory floors. Sensors, rugged power modules, and safety-certified MCUs underpin Industry 4.0 upgrades, raising reliability requirements in the electronic components market. Telecom infrastructure investments for 5G densification and nascent 6G trials sustain RF filter and amplifier volumes, while medical devices gain momentum via implantable monitors and remote diagnostics that rely on ultra-low-power ICs. Collectively, these verticals diversify demand and hedge suppliers against sector-specific shocks.
Geography Analysis
Asia-Pacific captured 47.5% of 2024 revenue, anchored by extensive front-end and back-end capacity in China, Taiwan, Japan, and South Korea. Chinese electronics output rebounded 11.3% in 2024 amid post-pandemic stimulus, yet looming tariff headwinds heighten supply-chain uncertainty. Taiwan’s TSMC remains indispensable for gate-all-around and chiplet packaging services, while Japan and South Korea leverage export-control carve-outs to supply EUV tools and photoresists. Southeast Asian sites in Malaysia, Vietnam, and the Philippines add assembly resilience, reflecting OEM near-shoring strategies within the electronic components market.
North America is reviving local fabrication as CHIPS Act subsidies bring USD 166 billion in announced projects, lifting anticipated U.S. wafer-fab share from 10% to 14% by 2032. Intel’s Ohio megafab and TSMC’s Arizona campus anchor this shift. Canada and Mexico enhance competitiveness through back-end services and automotive electronics clusters, strengthening continental ecosystems. Europe mobilizes EUR 43 billion under its Chips Act, focusing on sustainable fabs and automotive-grade wide-bandgap output suited to its strong vehicle manufacturing base. German hubs in Dresden and Munich attract new SiC and GaN lines, reinforcing regional specializations.
The Middle East and Africa represent the fastest-growing territory at 7.5% CAGR as governments invest in digital infrastructure, cloud data centers, and localized electronics assembly. India’s incentive schemes spur wire-bonding, substrate, and eventually wafer-fab plans via partnerships such as Tata–Kinesis. Gulf Cooperation Council members channel oil-windfall funds into diversified tech clusters, aspiring to host compound-semiconductor foundries for defense and satellite communication. Such emerging hubs expand demand nodes, diversify supply, and enlarge the electronic components market footprint globally.

Competitive Landscape
Competition is intensifying as vertically integrated models gain favor. Infineon’s USD 3 billion bet on GaN Systems and trench-SiC targets high-efficiency power conversion in EVs and AI servers. Texas Instruments accelerates internal 300 mm analog expansion to control wafer supply and reduce die cost. Chinese-owned Nexperia pledged USD 200 million to upgrade European lines, seeking customer trust amid geopolitical scrutiny.
Strategic alliances complement capex. ROHM and TSMC co-develop GaN power platforms optimized for electric vehicles, merging device design with wafer-scale manufacturing. STMicroelectronics and Qualcomm integrate AI-enabled wireless chips with STM32 MCUs, tapping cross-portfolio synergies for industrial IoT. The passive arena witnesses consolidation as Vishay acquires Nexperia’s Newport fab for USD 177 million, adding SiC and GaN capability while tightening European secure-supply credentials.
R&D intensity rises as white-space domains emerge. Quantum-computing ICs, neuromorphic architectures, and 2.5D/3D packaging attract venture-backed startups. Established firms co-invest in consortia like the US-JOINT advanced-packaging hub to share risk and accelerate commercialization. Talent scarcity remains a headline risk, with projections of 67,000 unfilled engineering roles by 2030 spurring scholarship and reskilling programs. Together, these forces mold a dynamic yet moderately consolidated electronic components market.
Electronic Components Industry Leaders
Infineon Technologies AG
NXP Semiconductors NV
Panasonic Corporation
Murata Manufacturing Co. Ltd
Eaton Corporation
- *Disclaimer: Major Players sorted in no particular order

Recent Industry Developments
- February 2025: VCI Global and Kinesis Manufacturing will build India’s first semiconductor wire plant in Chennai with USD 3.5 million initial outlay and projected USD 200 million annual sales.
- February 2025: SkyWater Technology acquired Infineon’s Austin 200 mm fab, safeguarding nearly 1,000 U.S. jobs and adding 65 nm capacity for automotive and defense chips
- February 2025: 3M joined the US-JOINT Consortium to develop next-generation advanced-packaging materials at a new Silicon Valley R&D center.
- January 2025: onsemi completed its acquisition of Qorvo’s SiC JFET business for USD 115 million, broadening its EliteSiC portfolio for AI data centers and EV traction inverters.


Global Electronic Components Market Report Scope
Electronic components are the foundational elements of electronic circuits, systems, and devices. Active electronic components, such as integrated circuits, transistors, and diodes, necessitate an external power source to function within a circuit. In contrast, passive electronic components, including capacitors, resistors, and inductors/magnetics, operate independently without the need for an external power source.
The study tracks the revenue accrued through the sale of electronic components by various players across the globe. The study also tracks the key market parameters, underlying growth influencers, and major vendors operating in the industry, which supports the market estimations and growth rates over the forecast period. The study further analyses the overall impact of COVID-19 aftereffects and other macroeconomic factors on the market. The report’s scope encompasses market sizing and forecasts for the various market segments.
The electronic components market is segmented by component( active components [transistors, diode, integrated circuits (ICs), amplifiers, and vacuum tubes], and passive components [capacitors, inductors, and resistors]), end-user industry (automotive, consumer electronics and computing, medical, industrial, communications, and other end-user industries), and geography (North America, Europe, Asia Pacific, Middle East & Africa, Latin America). The market sizes and forecasts regarding value (USD) for all the above segments are provided.
| Active Components | Transistors |
| Diodes | |
| Integrated Circuits (Logic, Memory, Analog, Micro) | |
| Power Electronics | |
| Passive Components | capacitors (MLCC, Tantalum, Aluminum Electrolytic, Film, Others) |
| Inductors (Ferrite Bead, Power, RF, Multilayer) | |
| Resistors (Thick-Film, Thin-Film, Wirewound, Shunt) |
| Surface-Mount Devices (SMD) |
| Through-Hole Devices (THD) |
| Silicon and SiGe |
| Compound Semiconductors (GaN, SiC, GaAs, InP) |
| Ceramic Dielectrics |
| Metallic Thin-Film and Thick-Film |
| Automotive |
| Consumer Electronics and Computing |
| Industrial Automation and Power |
| Communications Infrastructure |
| Medical and Healthcare Devices |
| Aerospace and Defense |
| North America | United States | |
| Canada | ||
| Mexico | ||
| Europe | Germany | |
| United Kingdom | ||
| France | ||
| Nordics | ||
| Rest of Europe | ||
| South America | Brazil | |
| Rest of South America | ||
| Asia-Pacific | China | |
| Japan | ||
| India | ||
| South-East Asia | ||
| Rest of Asia-Pacific | ||
| Middle East and Africa | Middle East | Gulf Cooperation Council Countries |
| Turkey | ||
| Rest of Middle East | ||
| Africa | South Africa | |
| Rest of Africa | ||
| By Component | Active Components | Transistors | |
| Diodes | |||
| Integrated Circuits (Logic, Memory, Analog, Micro) | |||
| Power Electronics | |||
| Passive Components | capacitors (MLCC, Tantalum, Aluminum Electrolytic, Film, Others) | ||
| Inductors (Ferrite Bead, Power, RF, Multilayer) | |||
| Resistors (Thick-Film, Thin-Film, Wirewound, Shunt) | |||
| By Mounting Technology | Surface-Mount Devices (SMD) | ||
| Through-Hole Devices (THD) | |||
| By Material System | Silicon and SiGe | ||
| Compound Semiconductors (GaN, SiC, GaAs, InP) | |||
| Ceramic Dielectrics | |||
| Metallic Thin-Film and Thick-Film | |||
| By End-User Industry | Automotive | ||
| Consumer Electronics and Computing | |||
| Industrial Automation and Power | |||
| Communications Infrastructure | |||
| Medical and Healthcare Devices | |||
| Aerospace and Defense | |||
| By Geography | North America | United States | |
| Canada | |||
| Mexico | |||
| Europe | Germany | ||
| United Kingdom | |||
| France | |||
| Nordics | |||
| Rest of Europe | |||
| South America | Brazil | ||
| Rest of South America | |||
| Asia-Pacific | China | ||
| Japan | |||
| India | |||
| South-East Asia | |||
| Rest of Asia-Pacific | |||
| Middle East and Africa | Middle East | Gulf Cooperation Council Countries | |
| Turkey | |||
| Rest of Middle East | |||
| Africa | South Africa | ||
| Rest of Africa | |||


Key Questions Answered in the Report
What is the current size of the electronic components market?
The market generated USD 701 billion in 2025 and is projected to hit USD 1 trillion by 2030 at a 7.36% CAGR.
Which region holds the largest share of electronic components revenue?
Asia-Pacific leads with 47.5% of 2024 sales, driven by its extensive front-end and back-end manufacturing ecosystem.
Why are passive components growing faster than active components?
Miniaturization in 5G phones and electric vehicles dramatically lifts MLCC and inductor counts, pushing passives at an 8.3% CAGR versus overall growth of 7.36%.
How is automotive electrification affecting component demand?
Battery-electric vehicles and ADAS platforms raise semiconductor content per car, propelling automotive segment revenue at an 8.1% CAGR through 2030.
What are the biggest supply-chain risks for component makers?
Shortages of silicon wafers and rare-earth materials, along with counterfeit parts in opaque channels, can suppress global output and margins.
Which materials are disrupting traditional silicon dominance?
Silicon-carbide and gallium-nitride devices are penetrating power and RF markets thanks to superior efficiency and high-frequency performance, growing at a 7.9% CAGR.
Page last updated on:


