
Structural Electronics Market Size and Share
Market Overview
| Study Period | 2020 - 2031 |
|---|---|
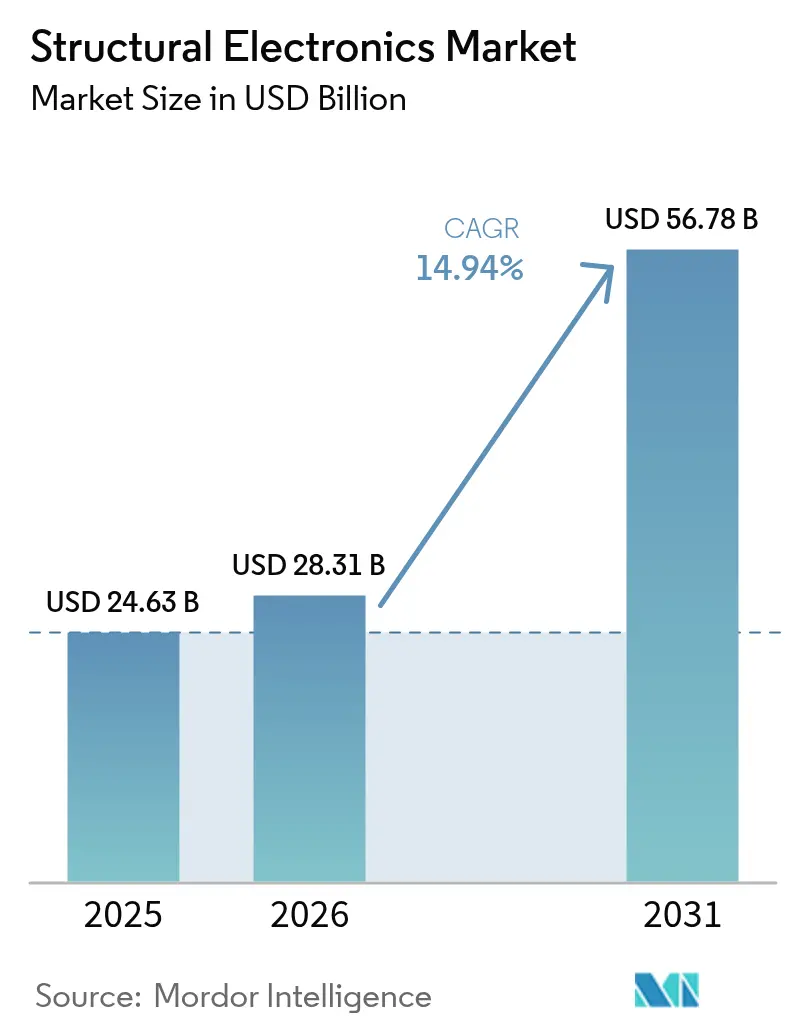
| Market Size (2026) | USD 28.31 Billion |
| Market Size (2031) | USD 56.78 Billion |
| Growth Rate (2026 - 2031) | 14.94 % |
| Fastest Growing Market | Asia Pacific |
| Largest Market | North America |
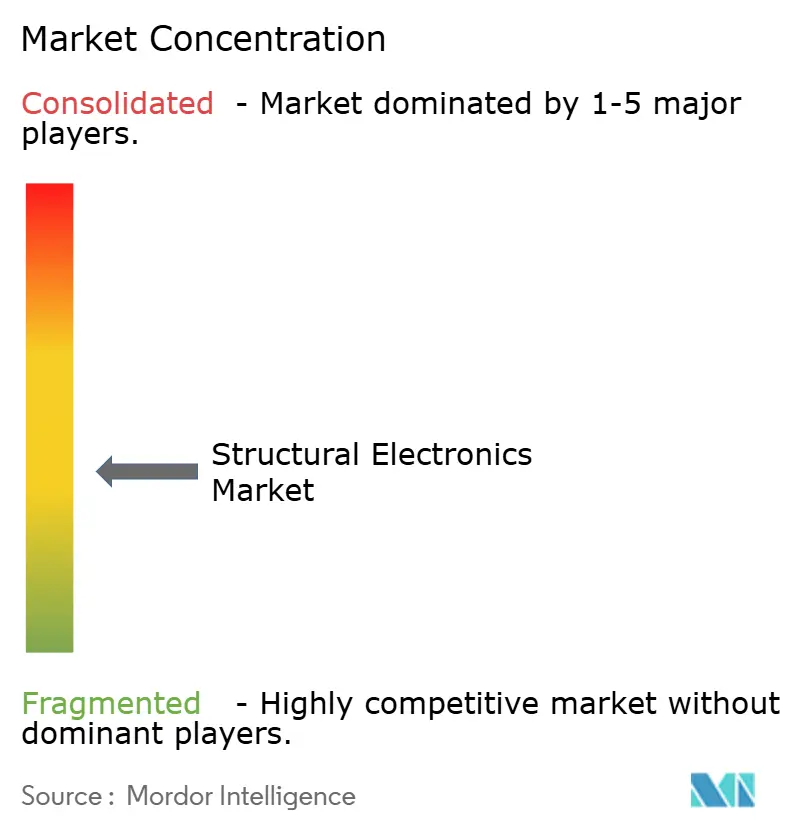
| Market Concentration | Medium |
Major Players *Disclaimer: Major Players sorted in no particular order Image © Mordor Intelligence. Reuse requires attribution under CC BY 4.0. | |
Structural Electronics Market Analysis by Mordor Intelligence
The structural electronics market size was valued at USD 24.63 billion in 2025 and estimated to grow from USD 28.31 billion in 2026 to reach USD 56.78 billion by 2031, at a CAGR of 14.94% during the forecast period (2026-2031). This acceleration reflects fast-moving vehicle lightweighting mandates, semiconductor policy incentives, and fresh breakthroughs in 3-D in-mold electronics that embed circuitry directly into load-bearing parts. Automotive manufacturers now fold sensor skins and structural batteries into cabin panels to trim weight and extend electric-vehicle range, while Asia-Pacific consumer-electronics plants scale volume production of curved, touch-activated housings. Regulations such as the European Chips Act and the U.S. CHIPS and Science Act pump capital into advanced packaging hubs that simplify structural integration. Geographic growth remains anchored in Asia-Pacific manufacturing depth, but defense and smart-infrastructure projects in the Middle East lift future demand.
Key Report Takeaways
- By application, automotive captured 41.65% of the structural electronics market share in 2025, whereas healthcare wearables are projected to post the fastest 16.05% CAGR to 2031.
- By integrant, sensors held 34.25% share of the structural electronics market size in 2025, while photovoltaics are set to grow at a 16.88% CAGR through 2031.
- By manufacturing technology, in-mold electronics led with 50.72% revenue share in 2025; additive manufacturing is advancing at an 17.46% CAGR to 2031.
- By material, conductive inks accounted for 45.68% of revenue in 2025, whereas nanomaterial-based inks are slated to expand at a 18.25% CAGR through 2031.
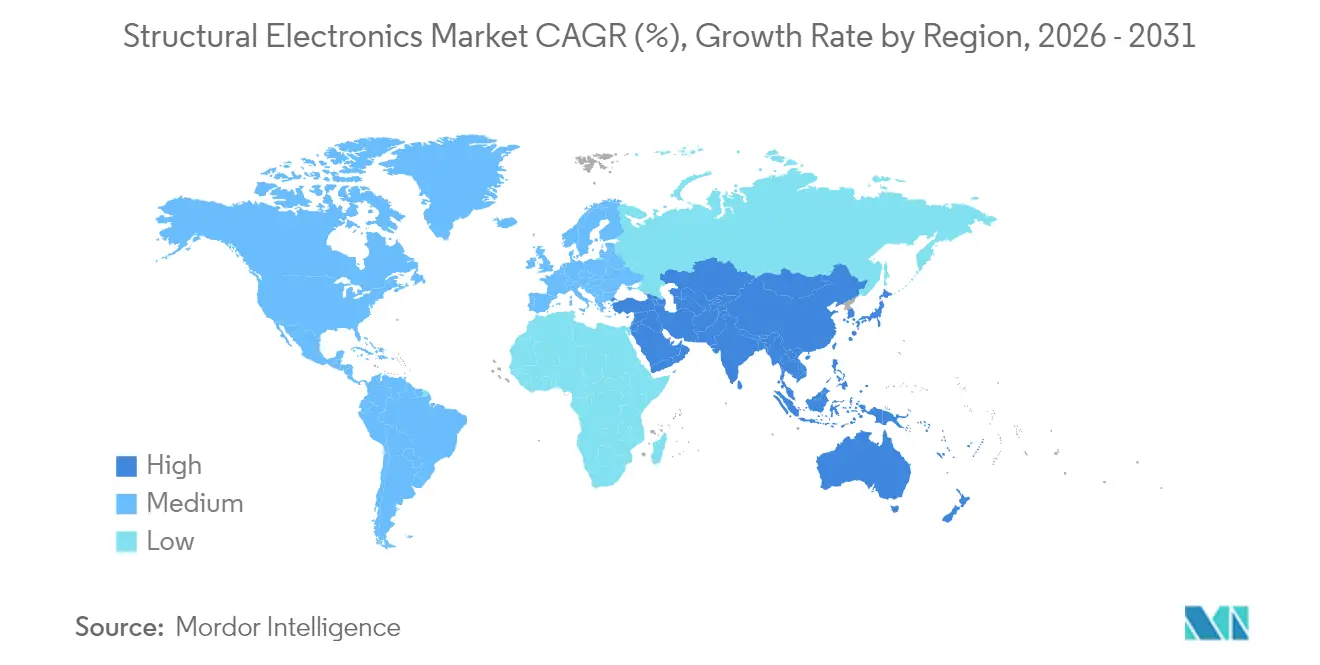
- By geography, Asia-Pacific contributed 37.35% of 2025 revenue, while the Middle East and Africa region is forecast to register a 15.12% CAGR to 2031.
Note: Market size and forecast figures in this report are generated using Mordor Intelligence’s proprietary estimation framework, updated with the latest available data and insights as of 2026.
Market Trends and Insights
Drivers Impact Analysis of Structural Electronics Market*
| Driver | (~) % Impact on CAGR Forecast | Geographic Relevance | Impact Timeline |
|---|---|---|---|
| Automotive lightweighting and EV-centric cabin electronics surge | +2.8% | Europe, North America | Medium term (2-4 years) |
| Mass adoption of 3-D in-mold electronics in Asia-Pacific consumer devices | +2.5% | Asia-Pacific, global | Short term (≤ 2 years) |
| FAA push for integrated sensor skins in composite airframes | +1.9% | North America, Europe | Long term (≥ 4 years) |
| Printed photovoltaics for battery-less IoT nodes in smart buildings | +1.7% | Global | Medium term (2-4 years) |
| Edge-AI wearables driving stretchable structural circuits | +2.1% | Global | Short term (≤ 2 years) |
| Defense demand for conformal antennas and smart surfaces | +1.4% | North America, Middle East | Long term (≥ 4 years) |
| Source: Mordor Intelligence | |||
Automotive light weighting and EV-centric cabin electronics surge
European automakers face firm fleet-emission rules that prioritize lighter vehicles equipped with integrated power electronics. Sinonus AB’s carbon-fiber structural battery shows a 70% range boost coupled with 50% weight reduction, illustrating how a single composite part can both store energy and carry mechanical loads. The design also mitigates thermal-runaway concerns by replacing flammable liquid electrolytes with semi-solid chemistries. Automakers such as Volkswagen link these batteries with silicon-carbide inverters from onsemi to shrink component count and raise drivetrain efficiency. The debate around steel versus aluminum gigacasting further underscores the value of embedding circuitry into any structural material. The result is a rapid uptick in structural electronics market adoption across chassis, doors, and instrument panels.
Mass adoption of 3-D in-mold electronics in Asia-Pacific consumer devices
Consumer-device contract manufacturers in China, South Korea, and Vietnam are standardizing 3-D in-mold electronics that combine conductive inks, films, and resins in a single molding step. TactoTek’s injection-molded structural electronics (IMSE) process has verified a 60% drop in greenhouse-gas emissions and 70% less plastic usage versus traditional assembly. Covestro’s Makrofol polycarbonate films enable touch lighting and haptic feedback inside ultrathin shells. Regional research, such as organic electrochemical transistors from the University of Hong Kong, drives the next wave of wearable, on-sensor computing. Southeast Asia’s PCB sector, already above USD 2 billion in output, supplies multilayer backplanes that mate with these structural housings. Accelerated tooling cycles support product launches in smartphones, hearables, and smart-home hubs, lifting the structural electronics market across personal electronics.
FAA push for integrated sensor skins in composite airframes
New FAA system-safety rules issued in September 2024 make continuous structural-health monitoring a certification baseline for composite transport aircraft. Boeing’s USD 4.7 billion purchase of Spirit AeroSystems centers on embedding fiber-optic and piezoelectric sensors during lay-up to watch strain in real time.[1]Boeing, “Boeing to Acquire Spirit AeroSystems,” investors.boeing.com Earlier FAA approval of comparative-vacuum monitoring proved the viability of such embedded systems on commercial jets. NASA materials programs have validated sensor integration without weight penalties, enabling a shift away from manual inspections. Airlines anticipate lower unscheduled maintenance and higher fleet utilization, which accelerates demand for structural electronics market innovations in aerospace cabins, wings, and nacelles.
Printed photovoltaics for battery-less IoT nodes in smart buildings
Building-automation suppliers increasingly select dye-sensitized and perovskite photovoltaic films that harvest indoor light to power wireless sensors. Recent laboratory cells have reached 38% efficiency under fluorescent illumination. MIT researchers showed that flexible perovskites quintuple the RFID tag range while eliminating batteries. Hybrid harvesters combining PV with thermoelectric generators now deliver 192.5 µW under mixed-lighting, enough for Bluetooth beacons. Analog Devices’ LTC3109 power manager conditions the sub-1V outputs, letting facility managers deploy thousands of nodes without battery swaps. Solar-powered pilot projects in European office towers confirm reduced operating costs and higher occupant comfort, feeding mid-term structural electronics market growth in smart-building envelopes.
Restraints Impact Analysis of Structural Electronics Market*
| Restraint | (~) % Impact on CAGR Forecast | Geographic Relevance | Impact Timeline |
|---|---|---|---|
| Complex qualification cycles for structural electronics in aerospace | -1.8% | Global, chiefly North America and Europe | Long term (≥ 4 years) |
| Limited cycle-time throughput of additive-manufacturing lines | -1.5% | Global | Medium term (2-4 years) |
| Delamination risks in high-heat polymer substrates | -1.2% | Global | Short term (≤ 2 years) |
| Shortage of conductive nanomaterial supply outside Asia | -2.1% | North America, Europe | Medium term (2-4 years) |
| Source: Mordor Intelligence | |||
Shortage of conductive nanomaterial supply outside Asia
Carbon-nanotube inks and pastes are concentrated in a handful of Chinese plants that together command over 40% of global output. Hurricanes that disrupted high-purity quartz in North Carolina exposed parallel weaknesses in raw-material chains essential for semiconductor substrates. Recent CNT scale-up announcements from U.S. and European producers remain short of demand growth projections. Automotive and aerospace buyers consequently face longer lead times and price spikes, constraining structural electronics market expansion until diversified sourcing becomes available.
Complex qualification cycles for structural electronics in aerospace
DO-254 hardware assurance and AC 20-107B material controls push development timelines for next-generation airframe electronics to 24–36 months and require USD 50–100 million in test spending Federal Aviation Administration. Programs must validate parts across –65 °C to 85 °C and 95% humidity, adding cost and risk. Boeing’s drive to insource fuselage production highlights how certification delays ripple through supply chains. Added paperwork for integrated aircraft-health-management data flows under AC 43-218 further complicates entry. These factors cool near-term uptake of structural electronics market solutions within commercial aviation, despite long-term efficiency benefits
*Our forecasts treat driver/restraint impacts as directional, not additive. The impact forecasts reflect baseline growth, mix effects, and variable interactions.
Structural Electronics Market Segment Analysis
By Integrant:
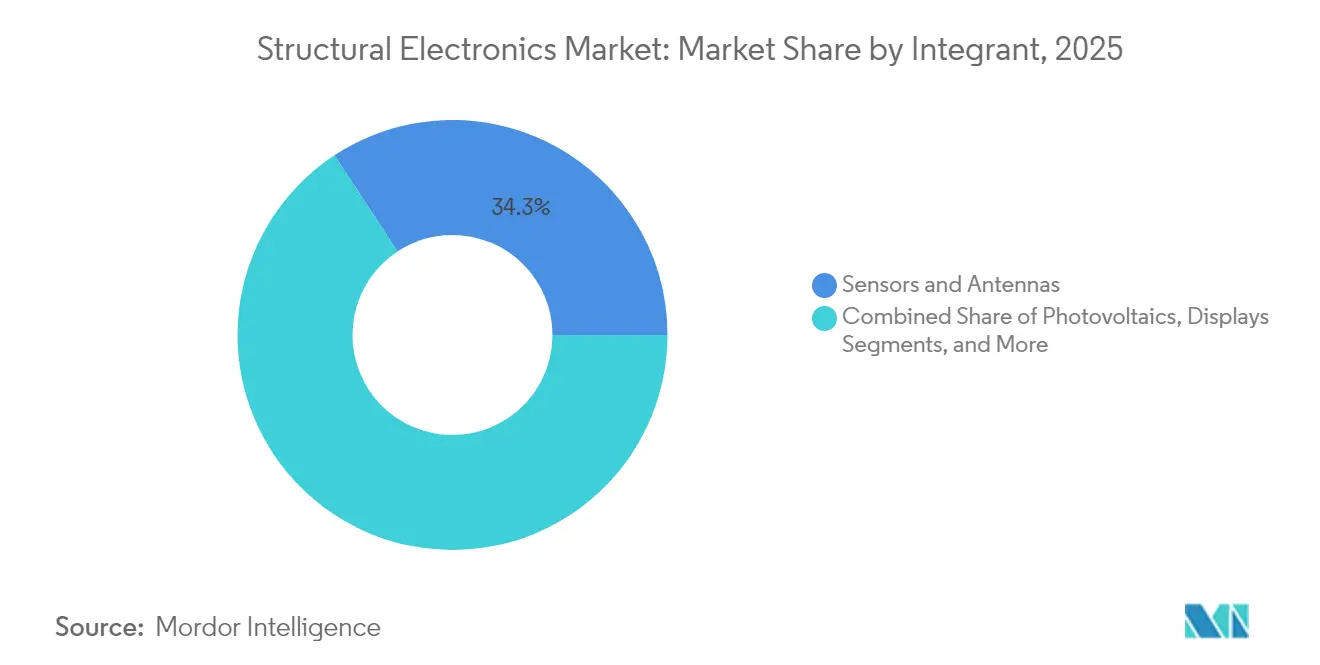
Sensors underpin current demand while photovoltaics unlock the next waveThe sensor and antenna category contributed 34.25% revenue in 2025, buoyed by mandates for advanced driver-assistance systems and aircraft safety monitoring. Flight composite panels now embed fiber-optic arrays, whereas passenger-vehicle dashboards integrate radar and capacitive touch in one molded insert. Photovoltaics post the strongest 16.88% CAGR through 2031, driven by flexible perovskite modules that curve around building interiors and wearable tags. Structural integration allows power generation without separate housing, shrinking assembly cost, and opening new applications in asset tracking and indoor agriculture.
Structural batteries and micro-super-capacitors move beyond prototypes, illustrated by MXene ink devices delivering 611 F cm-3 volumetric capacitance. Displays follow automotive styling trends toward continuous curved surfaces enabled by OLED and micro-LED films. Interconnect materials confront copper volatility yet gain from silver-nanowire and MXene alternatives that sustain conductivity in bendable formats. Together, these shifts expand the structural electronics market as designers combine sensing, energy, and display functions within a single laminate.



By Manufacturing Technology:
In-mold electronics dominate as additive processes accelerateIn-mold electronics captured 50.72% revenue in 2025 by fusing films, inks, and resin into lightweight parts that ship ready-to-install. Automotive door trims now host back-lit controls without separate PCBs, cutting wire harness weight. Consumer wearables adopt the same process for IP68-rated casings. Additive manufacturing records the highest 17.46% CAGR, supported by DARPA’s AMME program that 3-prints complex micro-circuits directly onto three-dimensional substrates. Aerosol-jet printing of MXene inks scales energy-dense capacitors, while multiphoton lithography pioneers printable organic bioelectronics.
Screen and flexographic presses remain cost-effective for large-area heaters and antennas on appliance panels. Inkjet platforms supply fine-feature prototypes before tooling commits to mass molding. This technology spreads, widening entry options, accelerating structural electronics market adoption in both high-volume and bespoke production runs.
By Material:
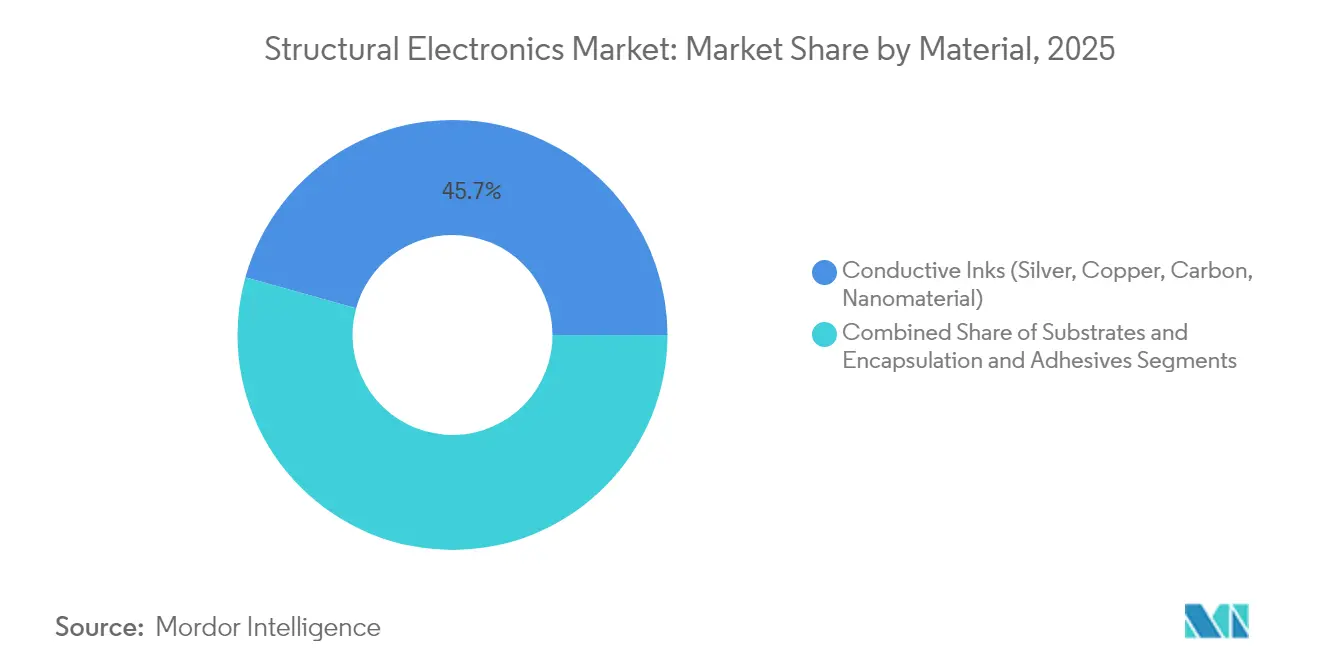
Conductive inks still lead, but nanomaterials dictate innovationConductive inks held 45.68% revenue in 2025 on the back of mature silver-flake and carbon formulations. Automakers rely on these pastes for capacitive sliders embedded into center consoles. Price pressure and resource security spur equipment makers to test carbon-nanotube and graphene blends that lift conductivity 10% while cutting silver usage. Nanomaterial-based inks post a 18.25% CAGR to 2031, led by MXene, CNT, and graphene hybrids that satisfy low-temperature sintering and high-flex cycles.
Substrate innovation keeps pace, with Makrofol films tolerating automotive thermal cycling from -40°C to 125°C and maintaining dimensional stability. Adhesives suppliers develop thermally conductive yet flexible chemistries that dissipate localized heat without delamination. These advances safeguard device reliability and keep the structural electronics market expanding into harsher environments.
By Application:
Automotive remains dominant while healthcare wearables surgeAutomotive retained 41.65% revenue in 2025 as OEMs embed structural batteries and sensor-laden interior trims that shave curb weight and extend driving range. Volkswagen’s silicon-carbide inverter strategy complements this push by reducing mass and boosting power-train efficiency. Regulatory demand for hands-off ADAS functions sustains sensor integration across vehicle pillars and bumpers, firming the structural electronics market base.
Healthcare wearables achieve a 16.05% CAGR, thanks to self-assembling liquid-metal conductors that stay conductive under strain. Stretchable electronic strips sewn into textiles now host full circuits instead of simple interconnects, enabling continuous glucose, temperature, and motion monitoring. Aerospace and defense buyers pursue conformal antennas that streamline airframes and smart surfaces that change radar signatures, while consumer electronics brands exploit seamless touch and lighting on curved products.
Geography Analysis
APAC Structural Electronics Market
Asia-Pacific delivered 37.35% of 2025 revenue by virtue of high-volume semiconductor, PCB, and molding ecosystems. China drives vertical integration, while Thailand and Malaysia add capacity that feeds global supply. Japan supplies over half the world’s multilayer ceramic capacitors, and partnerships such as Murata with QuantumScape diversify into solid-state battery ceramics.
Europe Structural Electronics Market
Europe’s structural electronics market gains from automotive electrification milestones and EUR 80 billion (USD 94.06 billion) in Chips Act funds, targeting a 20% global semiconductor share by 2030. German OEMs refine giga casting with embedded circuits, whereas French construction firms pilot PV-powered sensor skins on retrofit facades.
MEA Structural Electronics Market
The Middle East and Africa record the fastest 15.12% CAGR, propelled by defense modernization and smart-city rollouts. UAE’s EDGE Group explores AI-enabled satellite links that demand conformal antennas and lightweight power sources. Local governments entice suppliers with offset programs that seed domestic assembly lines, yet the region still imports most nanomaterials, a gap that could temper late-decade growth.
North America Structural Electronics Market
North America keeps momentum through aerospace projects and fresh CHIPS Act subsidies for advanced packaging foundries. Boeing’s acquisition of Spirit targets tighter integration of sensor-ready fuselage sections. Federal rules now favor home-grown supply, nudging structural electronics market participants to co-locate material, printing, and molding capabilities.

Value Chain Analysis
The structural electronics value chain starts with specialty inputs (conductive and nanomaterial inks, polymer films such as polycarbonate, composites, adhesives and encapsulants, and functional fillers like carbon nanotubes), then moves through electronic design and product engineering for 3D part integration, followed by manufacturing steps such as printing/deposition of conductors and sensors, lamination and overmolding (IME/IMSE), and downstream assembly, test, and qualification for automotive, consumer electronics, aerospace, and building automation use cases. Advanced semiconductor packaging and substrate ecosystems increasingly intersect with structural electronics, as system designers pair embedded sensing and power functions with compact, high-density modules, creating dependencies on substrate materials and assembly/test capacity.
Bottlenecks concentrate around scalable, automotive-grade industrialization of IMSE/IME lines and around access to critical materials outside Asia, particularly for nanomaterials used in next-generation inks and heaters. Recent supply-side moves illustrate the ecosystem build-out and regional diversification efforts: TactoTek and Symbiose announced a strategic partnership in March 2026 to expand IMSE manufacturing capability for automotive mass production, while packaging-linked materials and capacity programs broaden upstream options, including Samsung Electro-Mechanics and Sumitomo Chemical signing an MOU in November 2025 to form a glass-core substrate joint venture and Amkor and Intel expanding EMIB assembly capacity (announced April 2025) across Korea, Portugal, and the United States. These actions tighten the link between materials, packaging, and molded-part production, and shift more value creation toward qualified process know-how and integrated manufacturing partnerships.
Competitive Landscape
The market remains moderately fragmented. Technology specialists such as TactoTek leverage IMSE patents to provide turnkey design-to-production services that cut parts count and carbon footprint by 60%. Large incumbents pursue vertical integration: Boeing internalized composite fuselage fabrication to align quality and accelerate sensor embedding. Material suppliers forge alliances, for instance, DuPont with Zhen Ding to co-develop high-density interposer laminates for structural use.
Additive-manufacturing entrants backed by DARPA funds accelerate inks and printers that output aerospace-grade circuits in a single build.[4]Military & Aerospace Electronics, “DARPA to Push Bounds of Additive Manufacturing,” militaryaerospace.com Consumer-electronics giants like Meta patent flexible interconnect tapes that fan out cameras along curved housings, hinting at future AR headsets. Start-ups commercialize stretchable sensors for digital health, partnering with garment brands to secure route-to-market. Competition therefore spans materials, manufacturing platforms, and turn-key system providers, keeping pricing pressure moderate and innovation pace high.
Structural Electronics Industry Leaders
TactoTek Oy.
Panasonic Corporation
Canatu Oy
Neotech AMT GmbH
Pulse Electronics (a Yageo Company)
- *Disclaimer: Major Players sorted in no particular order
Structural Electronics Market Companies Covered in this Report
- TactoTek Oy
- Molex LLC
- Panasonic Holdings Corp.
- Canatu Oy
- Neotech AMT GmbH
- Pulse Electronics (Yageo)
- Optomec Inc.
- Odyssian Technology LLC
- Aconity3D GmbH
- T-ink Inc.
- Boeing Co.
- Henkel AG and Co. KGaA
- DuPont de Nemours Inc.
- 3D Systems Corp.
- Teijin Ltd.
- PPG Industries Inc.
- Flex Ltd.
- General Electric Co.
- Samsung Electro-Mechanics
- Continental AG

Market Opportunities and Future Outlook
White space remains in taking structural electronics from component-level demonstrations to repeatable, high-volume, reliability-qualified platforms in automotive interiors/exteriors, smart building envelopes, and healthcare wearables. Industry roadmapping signals where near-term effort concentrates: NextFlex released its 2025-2026 Public Roadmaps in March 2026 across multiple technical working areas for flexible hybrid electronics manufacturing, highlighting gaps in manufacturability, reliability, and supply chain readiness that structural electronics programs also face when embedding circuits into load-bearing parts. For buyers, opportunities center on consolidating functions (sensing, lighting, haptics, and power management) into molded parts to reduce harnessing and assembly steps, and on creating qualification playbooks that shorten adoption cycles for safety-critical environments.
Materials and packaging reliability improvements create practical entry points for new structural form factors, especially where thermomechanical stress and warpage limit integration. In July 2026, ACCM introduced Celeritas SMC, a production-ready silicon-matched core material from its Wisconsin facility, addressing CTE management needs that influence package-to-board interfaces in compact electronic modules often paired with structurally integrated housings. Also in July 2026, packaging research advances such as POSTECHs reported 10+ layer chip stacking approach and published work on highly filled liquid epoxy aimed at reducing wafer warpage underscore active progress on density and reliability constraints, enabling thinner electronics blocks that better fit within molded and laminated structures. In parallel, May 2026 research on solid particle-liquid metal mixtures targeting higher-current, more reliable stretchable interconnects supports opportunities in healthcare wearables and soft, conformal sensor surfaces where interconnect durability under strain governs product lifetime.
Recent Industry Developments in Structural Electronics Market
- June 2026: Panasonic Connect Group launched the FPX107CG/FP mounting system for manufacturing medium-sized OLED panels. The equipment supports tighter handling and mounting steps for OLED production, which helps improve throughput and repeatability for thin display films that can be integrated into curved or molded surfaces.
- May 2026: TactoTek and Motherson signed an IMSE technology license agreement to scale smart surface part production for global automotive markets. The deal expands access to IMSE manufacturing capability within a large automotive supplier footprint, supporting higher-volume adoption of electronics-integrated molded parts in vehicle interiors.
- November 2024: Lightmatter and Amkor Technology announced a partnership to build a large 3D photonics package using Lightmatters Passage platform and Amkors multi-die packaging expertise. The collaboration advances high-density packaging approaches that can reduce electronics volume and improve integration options for structural and conformal electronic assemblies.


Structural Electronics Market Report Scope and Research Methodology
Market Definition and Coverage
This market is defined as revenue generated from structural electronics where electronic functions are built into load-bearing or shape-defining parts, rather than being added as separate boards or modules. We count solutions that combine materials, interconnects, and embedded functions so the structure itself becomes the electronic platform.
Scope exclusions: We exclude conventional rigid printed circuit boards sold as standalone items, along with basic wiring harnesses that do not create structural, functional integration.
Segments Covered in This Report
- By Integrant
- Photovoltaics
- Batteries/Super-capacitors
- Sensors and Antennas
- Displays (OLED/Micro-LED)
- Conductors and Interconnects
- By Manufacturing Technology
- In-Mold Electronics (IME)
- Additive Manufacturing/3-D Printing
- Aerosol Jet and Inkjet Printing
- Screen/Flexographic Printing
- By Material
- Conductive Inks (Silver, Copper, Carbon, Nanomaterial)
- Substrates (Polymer, Glass, Composite, Thermoset)
- Encapsulation and Adhesives
- By Application
- Automotive - Interior and Exterior
- Aerospace and Defense - Airframe, Smart Skins
- Consumer Electronics - Whitegoods and Handhelds
- Healthcare/Medical Devices
- Industrial and Building Automation
- By Geography
- North America
- United States
- Canada
- Mexico
- Europe
- Germany
- United Kingdom
- France
- Italy
- Spain
- Nordics (Denmark, Sweden, Norway, Finland)
- Rest of Europe
- Asia-Pacific
- China
- Japan
- South Korea
- India
- Southeast Asia
- Australia
- Rest of Asia-Pacific
- South America
- Brazil
- Argentina
- Rest of South America
- Middle East
- Gulf Cooperation Council Countries
- Turkey
- Rest of Middle East
- Africa
- South Africa
- Nigeria
- Rest of Africa
- North America
Data Sources, Market Sizing, and Validation
Desk Research
Desk work is used to set the boundaries of what qualifies as structural electronics and to anchor the model with public signals. We rely on sources such as US Census and Bureau of Labor Statistics series for manufacturing output and pricing context, USITC and UN Comtrade trade flows for relevant electronic and materials categories, and OECD indicators for industrial production and broader macro cycles.
To keep the technology view grounded, we also review sources such as USPTO and EPO patent filings for printed and in-mold electronics activity, and peer-reviewed journals for adoption maturity and typical use cases. Company annual reports, investor presentations, product datasheets, and reputable trade press help validate commercialization timelines and application pull. Where needed, paid subscriptions for company financials and patent analytics are used to fill gaps in revenue splits and to cross-check which product lines actually contribute to the structural electronics portion. These examples are not exhaustive, and we consulted many other public sources for collection, validation, and clarification.
Primary Interviews and Surveys
Primary inputs come from interviews and structured surveys with material suppliers, electronics manufacturing service teams, application engineers, and downstream adopters across automotive, aerospace and defense, industrial automation, and healthcare devices. We use these discussions to pressure-test adoption rates, typical pricing movement, and the fraction of electronics value that ends up integrated into a structural part for each use case. When responses show wide variance across regions, we re-check assumptions and adjust the model inputs accordingly.
Distribution of primary research fieldwork respondents
| Company type | Respondent position | Region |
|---|---|---|
| Top tier: 36% | CXOs: 15% | APAC: 43% |
| Mid tier: 46% | Functional/Unit leaders: 32% | EMEA: 35% |
| Smaller Players: 18% | Managers: 53% | Americas: 22% |
Market-Sizing & Forecasting
The core model is built using a top-down approach where demand pools are reconstructed from end-use production and technology penetration, and then converted into revenue using realistic value-add per part. For example, for automotive and industrial uses, we start from unit production volumes and apply penetration of in-mold electronics, printed conductors, and embedded sensing based on what interviews indicate is in series production.
Selective bottom-up checks are used to keep totals consistent, including sampled supplier revenue roll-ups, channel checks on program volumes, and a volume times average selling price cross-check for key integrants like sensors and interconnects. Inputs that commonly move the numbers include the share of in-mold electronics versus additive printing routes, average electronics content per structural component, yield and scrap assumptions for printed traces, the pace of qualification cycles in aerospace and medical, and regional manufacturing shifts that change where integration is likely to occur. When company disclosures do not break out structural electronics cleanly, we apply a gap-handling step using product mix cues and confirmed exposure ranges from primary calls.
For forecasting, scenario analysis is used because adoption remains uneven by application and certification timelines can stretch. The scenarios are tied to variables that experts can sanity-check, including production outlooks in automotive, announced capacity for advanced packaging and electronics manufacturing, and the expected ramp of embedded sensing in industrial equipment.
Data Validation & Update Cycle
Before finalizing, outputs are triangulated against independent signals, and the biggest variances are explained in plain terms before sign-off. We run anomaly checks by region and application so sudden jumps can be traced back to a specific assumption, such as penetration, pricing, or a step-change in production volume.
A multi-step review is followed where one analyst rebuilds key calculations and another checks whether assumptions match what was heard in interviews and what is visible in public data. When large mismatches appear, the primary research loop is reopened to re-contact respondents and confirm what changed. Reports are refreshed annually, with interim updates when material events occur, and a final pre-delivery pass is done so clients receive the latest aligned view.
Mordor Intelligence's Structural Electronics Market Size Compared With Other Published Estimates
Published market sizes for structural electronics can look far apart because the market boundary is still evolving, and because some studies count adjacent electronics categories that are not truly structural. Differences also come from the year chosen as the base, the way currency conversion is handled, and whether the model follows real manufacturing ramps or uses a smooth growth curve.
By tracking qualification-led adoption by application and refreshing conversion and penetration assumptions, Mordor Intelligence sits closer to the value of electronics integrated into structural parts, rather than counting broad flexible electronics or general component sales that may not become load-bearing assemblies.
Benchmark comparison
| Source | Market Size | Gaps in Research Methodology |
|---|---|---|
| Mordor Intelligence | USD 28.31 B (2026) | |
| Global Consultancy A | USD 3.05 B (2026) | Uses factory-gate manufacturer revenue logic with tighter inclusion and explicit exclusion of supply-chain resales, which can undercount downstream integration value captured at the part and assembly level. |
| Industry Publisher B | USD 2.64 B (2025) | Starts from a narrower definition and a slower growth arc that appears to reflect early-stage adoption, which can miss faster ramps in automotive and industrial programs when penetration steps up after qualification. |
Across the three numbers, the spread is mainly explained by what is counted as structural integration versus adjacent electronics, and by where revenue is recognized in the chain. Our approach is designed to be repeatable because it ties sizing to visible production volumes, validated penetration, and practical pricing checks that can be re-tested as the market evolves.


Key Questions Answered in the Report
What is the current size of the structural electronics market?
The structural electronics market size stands at USD 28.31 billion in 2026.
How fast will the market grow to 2031?
Revenue is forecast to rise to USD 56.78 billion, representing a 14.94% CAGR through 2031.
Which technology is expanding the quickest?
Additive manufacturing shows the fastest 17.46% CAGR as 3-D printing begins to fabricate complex circuits directly on structural parts.
What is the main barrier in aerospace adoption?
Lengthy DO-254 and AC 20-107B qualification cycles add up to three years and tens of millions of dollars in testing before new structural electronics can fly.
Page last updated on:


 Your data is secure and never sold or shared.


