
Electrical Test Equipment Market Size and Share
Market Overview
| Study Period | 2020 - 2031 |
|---|---|
| Market Size (2026) | USD 17.31 Billion |
| Market Size (2031) | USD 23.15 Billion |
| Growth Rate (2026 - 2031) | 5.99 % |
| Fastest Growing Market | Asia Pacific |
| Largest Market | North America |
| Market Concentration | Medium |
Major Players *Disclaimer: Major Players sorted in no particular order Image © Mordor Intelligence. Reuse requires attribution under CC BY 4.0. | |
Electrical Test Equipment Market Analysis by Mordor Intelligence
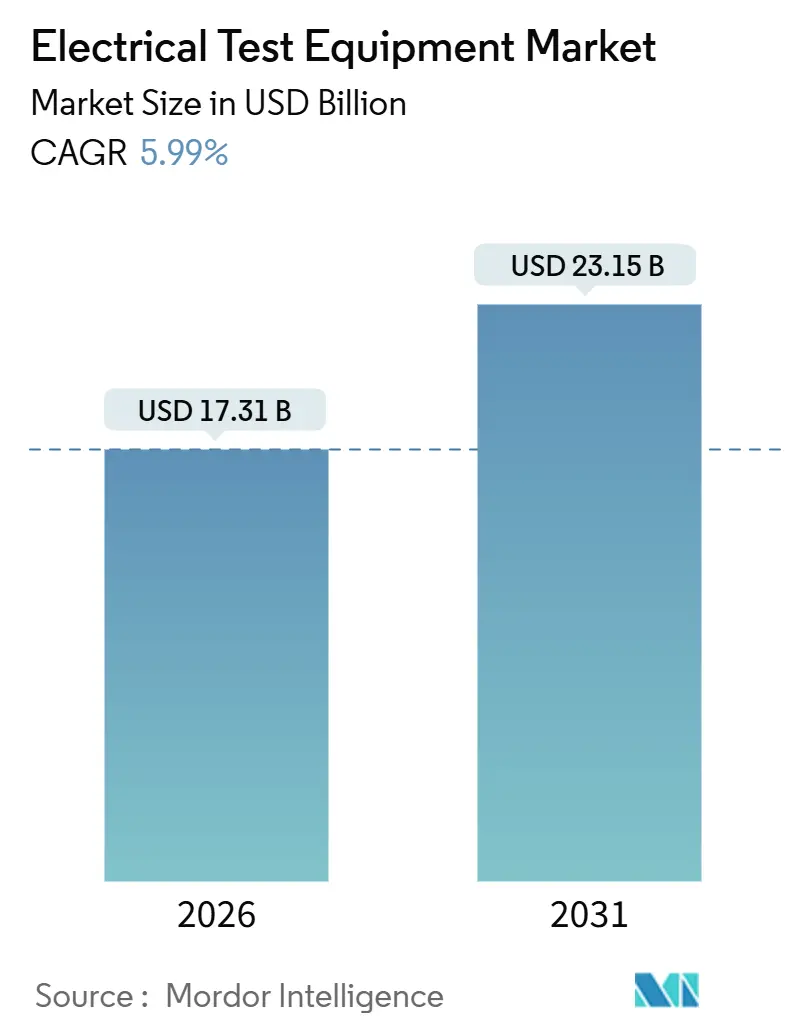
The electrical test equipment market size was USD 17.31 billion in 2026 and is projected to reach USD 23.15 billion by 2031, registering a 5.99% CAGR. Across the electrical test equipment market, portable instruments, regenerative loads, and connected analyzers remain the growth engines as utilities, manufacturers, and service providers modernize field workflows and digitize laboratories. Demand concentrates in battery-energy-storage commissioning, semiconductor fabrication, and 5G network roll-outs, all of which require high-bandwidth, safety-compliant instruments that shorten validation cycles. Vendors capable of combining hardware accuracy with cloud analytics, cybersecurity controls, and energy-recovery features increasingly shape competitive strategy, while regulatory mandates such as IEC 61010-1 Edition 4.0 and IEC 62443 amplify replacement cycles. Pricing pressure persists at the lower end of the electrical test equipment market as Chinese suppliers undercut premium brands, yet mid- and high-performance tiers defend margins by layering software subscriptions and calibration services.
Key Report Takeaways
- By equipment mobility, portable instruments commanded 61.73% of the electrical test equipment market share in 2025, and the category is forecast to expand at a 7.12% CAGR through 2031.
- By product category, multimeters and clamp meters led with 28.74% of the electrical test equipment market size in 2025, while electronic loads post the fastest 6.33% CAGR to 2031.
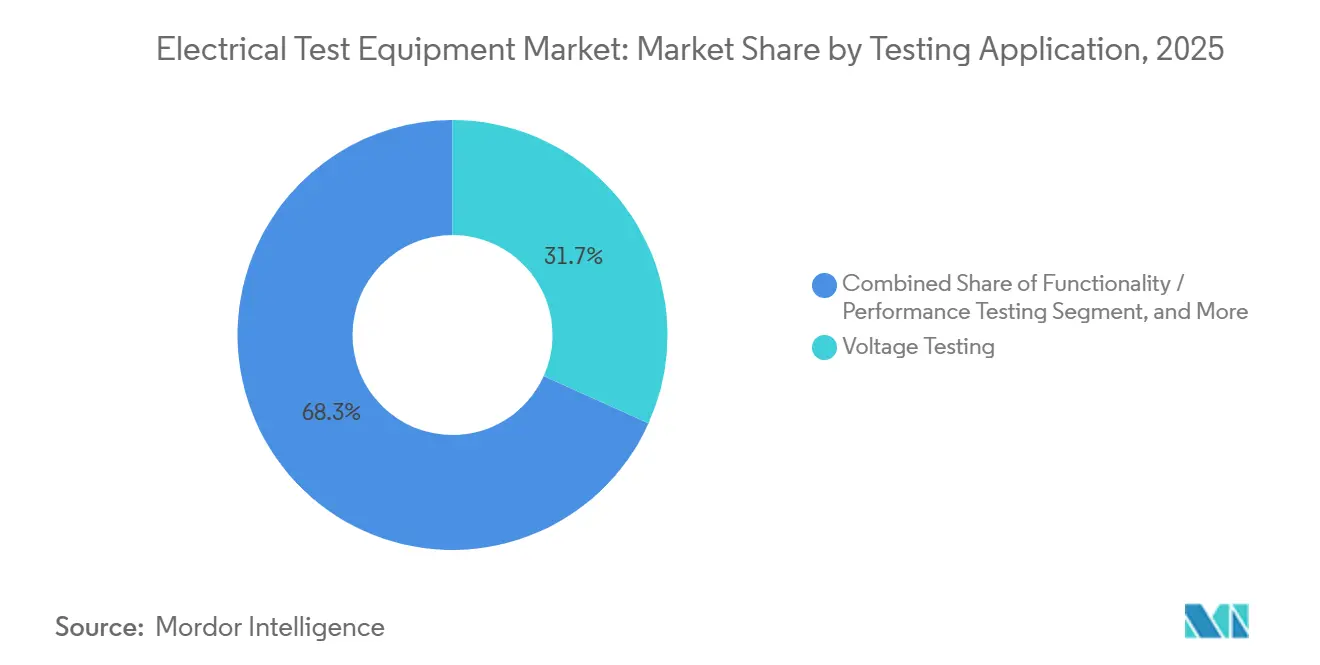
- By testing application, voltage testing held 31.74% share in 2025 of the electrical test equipment market, whereas preventive maintenance and condition monitoring are projected to register a 6.66% CAGR to 2031.
- By industry application, energy and power captured 41.82% revenue share in 2025 of the electrical test equipment market, while automotive and e-mobility is the quickest-growing vertical at a 6.77% CAGR through 2031.
- By geography, North America retained 38.73% share in 2025 of the electrical test equipment market, but Asia-Pacific is poised for the highest 6.65% CAGR to 2031.
Note: Market size and forecast figures in this report are generated using Mordor Intelligence’s proprietary estimation framework, updated with the latest available data and insights as of January 2026.
Market Trends and Insights
Drivers Impact Analysis of Electrical Test Equipment Market*
| Driver | (~) % Impact on CAGR Forecast | Geographic Relevance | Impact Timeline |
|---|---|---|---|
| Stricter global electrical-safety regulations | +1.2% | Global, with early enforcement in EU and North America | Medium term (2-4 years) |
| Expansion of renewable-energy installations | +1.5% | Global, concentrated in APAC, North America, and Europe | Long term (≥ 4 years) |
| Proliferation of 5G and high-speed networks | +1.1% | Global, led by APAC and North America | Medium term (2-4 years) |
| Rising EV adoption and battery-test demand | +1.3% | Global, with highest growth in APAC and Europe | Long term (≥ 4 years) |
| Predictive-maintenance-as-a-service uptake | +0.6% | North America and Europe, expanding to APAC | Medium term (2-4 years) |
| Demand for energy-regenerative loads | +0.4% | Global, early adoption in automotive and energy sectors | Short term (≤ 2 years) |
| Source: Mordor Intelligence | |||
Stricter Global Electrical-Safety Regulations
Regulators worldwide are increasing insulation-coordination thresholds and incorporating cybersecurity checks into electrical safety protocols, compelling both manufacturers and end-users to update their instrument fleets. IEC 61010-1 Edition 4.0, effective January 2024, increased clearance and creepage distances for equipment above 1 000 V, leading vendors to redesign enclosures and customers to recalibrate installed bases.[1]International Electrotechnical Commission, “IEC 61010-1 Edition 4.0 Safety Requirements,” IEC.ch In the United States, UL 9540A now mandates multi-level thermal-runaway validation for battery-energy storage systems, resulting in a threefold increase in tester utilization rates during certification. The European Union amended the Low Voltage Directive to require IEC 62443 component security attestations, tying dielectric tests to cybersecurity audits. Replacement demand is acute in data-center and pharmaceutical facilities where downtime penalties outweigh instrument cost. Consequently, portable safety analyzers with ruggedized housings and secure firmware record double-digit shipment growth.
Expansion of Renewable-Energy Installations
Utility-scale solar, wind, and co-located battery assets multiply grid-edge test points that need harmonic, power-quality, and insulation verification. The U.S. Department of Energy’s Grid Resilience and Innovation Partnerships program earmarked USD 3.46 billion for transmission upgrades that specify analyzers able to capture sub-cycle voltage sags through the 50th harmonic.[2]U.S. Department of Energy, “Grid Resilience and Innovation Partnerships Program,” Energy.gov North Sea offshore wind farms deploy 525 kV HVDC links, requiring insulation testers such as Megger’s IDAX 350 for on-board converter-station cables. China’s GB/T 36547-2024 forces every grid-storage site above 10 MWh to complete standardized performance tests, boosting bids for domestic regenerative loads. These policies drive sustained investment in high-voltage, high-precision portable instruments across the electrical test equipment market.
Proliferation of 5G and High-Speed Networks
3GPP Release 18 pushes test frequencies to 71 GHz, outpacing legacy protocol analyzers. Keysight’s UXM 5G Wireless Test Platform combines over-the-air and conducted modes in one chassis, cutting radio-validation rack space in half.[3]Keysight Technologies, “Company Overview and Product Portfolio,” Keysight.com Open RAN architectures fragment suppliers, prompting operators to acquire interoperability test suites, as evidenced by Viavi’s 31% jump in O-RAN license sales during 2024. Fiber backhaul expansion shifts optical time-domain reflectometers from labs to field kits, and shortages of certified fiber technicians increase demand for simplified, automated instruments. Together, these factors continue to lift the electrical test equipment market in telecom verticals.
Rising EV Adoption and Battery-Test Demand
Fast-charging above 350 kW and the advent of solid-state chemistries intensify validation workloads in automotive labs. ISO/SAE 12906:2024 mandates cycle-life testing across -40 °C to +50 °C ambient conditions, which require combined thermal chambers and high-current cyclers. Chroma’s Model 17040 regenerative tester recovers up to 90% discharge energy, saving large battery lines USD 120 000 annually in electricity costs. China’s revised GB/T 31467-2023 adds fast-charge durability clauses, driving domestic orders for Itech and Rigol systems. These pressures sustain the fastest CAGR contribution within the electrical test equipment market.
Restraints Impact Analysis of Electrical Test Equipment Market*
| Restraint | (~) % Impact on CAGR Forecast | Geographic Relevance | Impact Timeline |
|---|---|---|---|
| High acquisition cost of instruments | -0.8% | Global, acute in emerging markets | Medium term (2-4 years) |
| Rapid technology-driven obsolescence | -0.6% | Global, especially in high-frequency and digital domains | Short term (≤ 2 years) |
| Shortage of skilled metrology technicians | -0.4% | North America and Europe, emerging in APAC | Long term (≥ 4 years) |
| Cyber-security risks in connected devices | -0.3% | Global, critical in regulated industries | Medium term (2-4 years) |
| Source: Mordor Intelligence | |||
High Acquisition Cost of Instruments
Ten-gigahertz oscilloscopes priced above USD 100 000 remain out of reach for many regional labs, slowing modernization in Southeast Asia and South America. Vendors experiment with lower-spec models such as Tektronix’s MSO 2 Series at USD 1 200, yet 200 MHz bandwidth confines usage to consumer-electronics repair. Operating leases now constitute 34% of PXI orders at Emerson Test and Measurement, transferring obsolescence risk from buyers to suppliers. Nevertheless, tariffs like India’s 20% basic customs duty still inflate landed cost on premium analyzers. Budget constraints therefore lengthen mixed-fleet lifecycles, limiting near-term electrical test equipment market upgrades.
Rapid Technology-Driven Obsolescence
Millimeter-wave adoption, software-defined radios, and evolving cybersecurity baselines shorten effective product life. Customers hesitate to purchase when a new protocol or frequency band could arrive within two years, dampening capital-spending cycles. Mid-power signal generators introduced pre-2024 already lack Release 18 capabilities, compelling owner labs to weigh retrofit boards against full replacement. Subscription-based firmware updates mitigate some risk but do not solve inherent analog-front-end limitations. Consequently, obsolescence concerns shave growth potential off the electrical test equipment market, especially in bandwidth-driven categories.
*Our forecasts treat driver/restraint impacts as directional, not additive. The impact forecasts reflect baseline growth, mix effects, and variable interactions.
Electrical Test Equipment Market Segment Analysis
By Equipment Mobility:
Portable Instruments Extend Field ReachPortable assets represented 61.73% of the electrical test equipment market share in 2025. The segment is projected to deliver a 7.12% CAGR through 2031, as utilities, contractors, and renewable-energy installers prefer battery-powered devices that eliminate the need for de-energizing circuits during commissioning. Fluke’s 4.2 kg Norma 6000 power analyzer exemplifies laboratory-grade precision on the job site, while Rohde and Schwarz’s eight-hour handheld oscilloscope gains traction in automotive service bays. Stationary gear maintains relevance in semiconductor fabs where environmental control is paramount, but ruggedized housings and IEC 61010-1 drop-test compliance broaden portable use cases.
The portable wave drives accessory ecosystem includes wireless probes, cloud dashboards, and edge-AISafety features that integrate seamlessly with enterprise asset-management software. As a result, procurement frameworks are increasingly assessing total connectivity and cybersecurity, rather than raw accuracy. With average selling prices falling 8% in 2024 due to Chinese competition, premium brands are bundling calibration vouchers and firmware unlock codes to protect their margins, thereby sustaining differentiation in the electrical test equipment market.



By Product Category:
Electronic Loads Outpace Legacy StaplesMultimeters and clamp meters delivered 28.74% of 2025 revenue but face price erosion from low-cost entrants. Conversely, regenerative electronic loads, though smaller in absolute terms, are projected to register a 6.33% CAGR, the fastest among all categories. EA Elektro-Automatik’s 96% energy-recovery models helped one European battery lab cut annual consumption by 1.2 GWh annually. Oscilloscopes polarize, with sub-USD 2 000 instruments winning education and repair markets and USD 50 000 mixed-signal editions anchoring aerospace programs.
Power analyzers see renewed demand as silicon-carbide drives penetrate HVAC and industrial automation, while safety testers commoditize as users stretch calibration to 18-month intervals. Battery-specific testers surge in demand for EVs and grid storage, and software-defined waveform generators based on PXI or FPGA platforms replace aging analog units. These shifts illustrate how efficiency, modularity, and software extensibility shape purchasing in the electrical test equipment market.
By Testing Application:
Predictive Analytics Gain MomentumVoltage verification remained the baseline at 31.74% share in 2025, yet preventive maintenance and condition monitoring are forecast to expand at 6.66% CAGR as plants seek data-driven uptime. Edge-enabled power-quality recorders that transmit only exception events reduce bandwidth by up to 85%, a decisive factor for oil-and-gas facilities. Automated test equipment in semiconductor lines sustains high volumes, processing more than 10 000 devices per hour.
In renewable-energy commissioning, IEEE 1547.1 certified analyzers speed site acceptance, while compliance testing in automotive and medical devices leans on turnkey service bundles that combine hardware with calibration certificates. Extended warranties and three-year calibration guarantees lower total cost of ownership, furthering adoption. Together, these dynamics reinforce the analytics-first mindset permeating the electrical test equipment market.

By Industry Application:
Mobility Electrification Leads GrowthEnergy and power still captured the largest slice at 41.82% in 2025 due to grid-scale storage and inverter validation. However, automotive and e-mobility are projected to chart a 6.77% CAGR through 2031, reflecting fast-charge, solid-state, and battery-management-system test needs. Regenerative cyclers enable throughput gains, while impedance spectroscopy across micro-hertz bands characterizes lithium-metal interfaces.
Aerospace and defense retain premium margins given MIL-STD qualification, and manufacturing automation uses power analyzers to debug variable-frequency drives. Consumer electronics tests commoditize, and intrinsics-safe instruments dominate oil-and-gas maintenance. Telecommunication tower upgrades demand handheld spectrum and vector analyzers, and academic labs leverage discounted leasing programs. Collectively, these verticals dictate the investment cadence inside the electrical test equipment market.
Geography Analysis
North America Electrical Test Equipment Market
North America held 38.73% of global revenue in 2025, underpinned by USD 3.46 billion in federal transmission upgrades and expanding EV battery labs in Michigan and California. Canada’s 47% surge in grid-scale storage deployments and Mexico’s USD 1 billion EV plant conversion sustain additional momentum.
Europe Electrical Test Equipment Market
Europe’s accelerated energy transition propels investment in power-quality and insulation-diagnostic tools. Germany’s offshore wind expansion, the United Kingdom’s USD 4.3 billion substation upgrades, and France’s nuclear life-extension projects together elevate demand for high-voltage test gear. The European Union’s Battery Regulation reinforces traceable energy-consumption metering, compelling purchase of calibrated analyzers.
APAC, MEA and South America Electrical Test Equipment Market
Asia-Pacific is forecast to post the strongest 6.65% CAGR to 2031, driven by Taiwan’s USD 65 billion semiconductor capex, South Korea’s memory-chip fab, and China’s storage-testing mandate favoring local suppliers. India’s INR 29.8 billion incentive payouts attract additional electronics factories that procure multimeters and power analyzers, while Japan’s solid-state battery pilots and ASEAN manufacturing relocations amplify regional purchasing. Emerging markets in South America, the Middle East and Africa lag in absolute volumes but register robust project pipelines that require portable safety testers and grid-code analyzers, broadening the electrical test equipment market footprint.


Regulatory Landscape
Electrical test equipment suppliers operate under a layered compliance stack covering electrical safety, EMC, and, increasingly, cybersecurity for connected instruments. IEC 61010-1 Edition 4.0 became effective in January 2024 and tightened safety requirements for test and measurement equipment, which has driven redesigns and recertification for higher-voltage and portable instruments. In the European Union, the Low Voltage Directive 2014/35/EU remains the core legal framework for electrical safety (50-1,000 V AC and 75-1,500 V DC), with conformity commonly demonstrated through harmonized standards referenced in the Official Journal.
Market access and time-to-market are also shaped by telecom and device-authorization regimes for instruments with RF capabilities. In the United States, the FCC equipment authorization system governs RF devices via Supplier's Declaration of Conformity or Certification, and it requires compliant test reporting and accredited laboratory practices. The FCC adopted rules effective June 1, 2026 that establish a fast-track priority review process for equipment subject to Pre-Approval Guidance when tested in Trusted Test Labs, which increases the value of accredited lab networks and compliant documentation flows for connected analyzers and wireless test platforms.
Value Chain Analysis
The value chain begins with specialized components, including high-accuracy ADC/DACs, RF front ends, power semiconductors, precision passives, connectors, batteries, and ruggedized enclosures. It then extends into firmware, analytics software, and calibration traceability that shape instrument performance and compliance readiness.
Midstream, OEMs and platform vendors design and assemble portable and stationary instruments, validate them against safety and EMC requirements, and build software stacks for automation, reporting, and cybersecurity hardening in regulated environments. Downstream sales are split between direct enterprise channels to large utilities, fabs, and telecom operators, and channel partners that support contractors and smaller labs. Third-party calibration and certification services, along with accredited test labs, recur across replacement cycles and lifecycle cost decisions. Portfolio updates across optical, semiconductor, and data acquisition categories also show a shift toward software-enabled workflows and application-specific test ecosystems, rather than standalone instruments, with examples including Yokogawa Test and Measurement product releases across OTDR, power meter modules, and high-speed data acquisition in 2025, and Advantest platform introductions in power semiconductor and AI-oriented testing during 2025.
Competitive Landscape
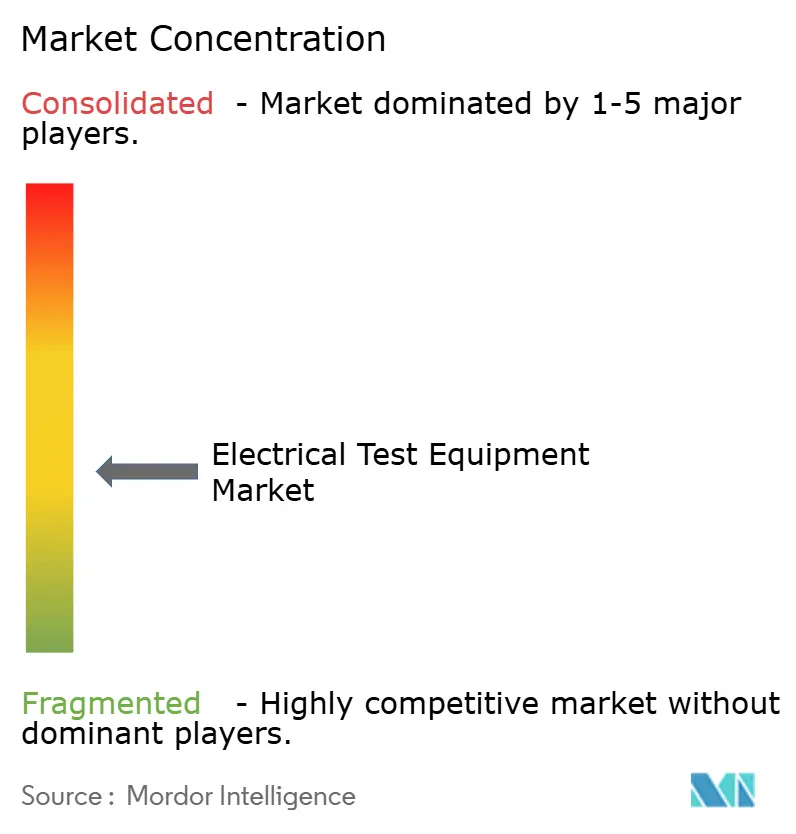
The top five vendors, Keysight Technologies, Rohde and Schwarz, Tektronix, Fluke Corporation, and Emerson Test and Measurement, collectively accounted for about half of 2024 revenue, signaling moderate concentration. Keysight’s USD 1.5 billion acquisition of Spirent’s network-test arm consolidated 5G protocol validation and deepened its software moat. Rohde and Schwarz safeguards gross margins through vertical integration, while Fluke’s high-volume multimeters face price compression from Rigol, Mastech, and UNI-T entrants.
White-space opportunities surface in regenerative electronic loads where EA Elektro-Automatik and NH Research innovate but lack global service coverage, and in cybersecurity-hardened instruments compliant with IEC 62443 where few products exist. Keysight’s PathWave cloud suite exemplifies the pivot toward subscription ecosystems that lock in customers and generate recurring revenue streams.
Chinese challengers such as Itech captured 12% of domestic battery-tester sales by undercutting incumbents by up to 40%, though reliability concerns persist for Tier-1 automotive programs. Partnerships, localized manufacturing, and turnkey calibration packages remain decisive levers as the electrical test equipment market evolves toward software-defined, service-centric models.
Electrical Test Equipment Industry Leaders
Keysight Technologies, Inc.
Rohde and Schwarz GmbH and Co. KG
Tektronix, Inc.
Fluke Corporation
National Instruments Corporation
- *Disclaimer: Major Players sorted in no particular order
Electrical Test Equipment Market Companies Covered in this Report
- Keysight Technologies, Inc.
- Rohde and Schwarz GmbH and Co. KG
- Tektronix, Inc.
- Fluke Corporation
- National Instruments Corporation
- Yokogawa Test and Measurement Corporation
- Anritsu Corporation
- Chroma ATE Inc.
- Hioki E.E. Corporation
- Megger Group Limited
- Chauvin Arnoux SA
- BandK Precision Corporation
- Viavi Solutions Inc.
- Advantest Corporation
- Teledyne LeCroy Inc.
- Good Will Instrument Co., Ltd.
- Rigol Technologies Co., Ltd.
- Mastech Group Limited
- Ideal Industries, Inc.
- Kikusui Electronics Corporation
- EA Elektro-Automatik GmbH and Co. KG
- NH Research, Inc.
- Itech Electronic Co., Ltd.

Market Opportunities and Future Outlook
White-space clusters where end users need higher throughput and faster compliance closure while reducing operating cost, particularly in semiconductor and advanced packaging test, grid and battery commissioning, and high-frequency wireless validation. Capacity actions during 2026 provide near-term signals on where procurement is being enabled: Keysight began manufacturing operations at its Chennai, India facility as an export hub for semiconductor, aerospace, defense, and wireless test solutions, and Advantest initiated a capacity expansion plan to raise test unit production from 3,000 to 5,000 units in 2026 to address AI-related demand. These moves support opportunities for suppliers that can localize build, shorten lead times, and bundle instruments with automation software and calibrated documentation.
Service and compliance infrastructure also creates room for growth as standards and authorization pathways add documentation and verification workload. More third-party labs can expand addressable demand for over-the-air and compliance test work, and Setsco QAV opening a new electrical and electronics testing facility in Bayan Lepas, Penang, Malaysia in July 2026 illustrates that dynamic. On the hardware side, more complex interfaces for HBM-class memory, glass substrates, and co-packaged optics shift spending toward specialized test interface components, connectors, and fixtures. This is supported by Yokowo's 7.6 billion yen investment, approved June 2026, to expand semiconductor testing connector capacity across Japan, Malaysia, and Vietnam through March 2031. Suppliers that combine high-power regenerative capability, secure connected operation, and application-specific accessories are positioned to capture incremental demand tied to new manufacturing footprints and higher compliance intensity.
Recent Industry Developments in Electrical Test Equipment Market
- June 2026: Keysight Technologies completed the acquisition of VPIphotonics, adding system-level photonic and optical communication simulation capabilities to its portfolio. The addition strengthens end-to-end workflows that connect design, simulation, and validation for optical interconnects and silicon photonics, areas that are increasingly linked to high-speed network and data center test requirements.
- December 2025: Keysight Technologies joined forces with Singapores quantum ecosystem to advance capabilities in qubit design and control. The collaboration broadens Keysights position in ultra-low noise measurement and advanced instrumentation, extending addressable demand in research labs that buy high-precision electrical test and measurement platforms.
- March 2024: Keysight Technologies announced plans to acquire Synopsys Optical Solutions Group to expand its software-centric solutions strategy in optical and photonics design flows. This move signaled a deeper push into design-to-test continuity, tightening integration between electronic test equipment and software used to validate next-generation optical links.


Electrical Test Equipment Market Report Scope and Research Methodology
Market Definition and Coverage
This market covers revenue earned from electrical test instruments used to measure, verify, and troubleshoot electrical performance and safety in labs and field settings, across industrial, utility, telecom, automotive, aerospace, healthcare, and electronics environments.
Scope exclusions: We exclude electrical testing services and purely software-only tools that do not involve a dedicated test instrument sale.
Segments Covered in This Report
- By Equipment Mobility
- Stationary
- Portable
- By Product Category
- Oscilloscopes
- Multimeters and Clamp Meters
- Power Analyzers
- Electrical Safety Testers
- Battery Testing Equipment
- High-Voltage Testers
- Electronic Loads
- Signal and Function Generators
- Network and Protocol Analyzers
- Data Acquisition Systems
- By Testing Application
- Voltage Testing
- Functionality / Performance Testing
- Installation and Commissioning Testing
- Preventive Maintenance and Condition Monitoring
- Compliance and Certification Testing
- Quality Assurance and Lab Calibration
- By Industry Application
- Energy and Power
- Aerospace and Defense
- Manufacturing and Industrial Automation
- Consumer Electronics
- Oil and Gas
- Automotive and E-Mobility
- Telecommunications and IT Infrastructure
- Healthcare and Medical Devices
- Research and Academics
- By Geography
- North America
- United States
- Canada
- Mexico
- South America
- Brazil
- Argentina
- Rest of South America
- Europe
- Germany
- United Kingdom
- France
- Italy
- Spain
- Rest of Europe
- Asia-Pacific
- China
- Japan
- India
- South Korea
- ASEAN
- Rest of Asia-Pacific
- Middle East and Africa
- Middle East
- Saudi Arabia
- United Arab Emirates
- Rest of Middle East
- Africa
- South Africa
- Nigeria
- Rest of Africa
- Middle East
- North America
Data Sources, Market Sizing, and Validation
Desk Research
Desk research started with sources that explain how electrical test equipment demand builds up in the real world, then we converted those signals into sizing inputs. We reviewed public standards and safety references such as IEC publications (for example IEC 61010-1), along with technical and adoption signals from sources such as NIST, IEEE journals, and IEA energy-transition updates that influence testing needs in grids and electrified assets.
To anchor industry activity, we also used materials such as customs and trade statistics (for example UN Comtrade), government manufacturing and industrial production releases (such as U.S. Census Bureau series), and association updates that point to investment cycles in electronics, utilities, and factories. Company filings, investor decks, product catalogs, and reputable press were used to cross-check product mix shifts like portable instruments, battery test sets, and electronic loads. For financial and shipment-level checks, we used a paid subscription database selectively to confirm company metrics, patent activity, and trade reads. The desk research sources listed here are not exhaustive, and many other public references were also used for validation and clarification.
Primary Interviews and Surveys
Primary work focused on validating what actually gets bought, by whom, and at what typical price bands, since catalog pricing and discounting can vary by channel and account size. We spoke with a mix of manufacturers, distributors, calibration and lab stakeholders, and end users in power, electronics production, telecom, and e-mobility. The interviews were then used to tighten assumptions on replacement cycles, use intensity, and adoption of newer test needs, such as battery commissioning and connected analyzers.
Distribution of primary research fieldwork respondents
| Company type | Respondent position | Region |
|---|---|---|
| Top tier: 27% | CXOs: 12% | APAC: 41% |
| Mid tier: 53% | Functional/Unit leaders: 34% | EMEA: 34% |
| Smaller Players: 20% | Managers: 54% | Americas: 25% |
Market-Sizing & Forecasting
For market sizing, we used a top-down build that reconstructs demand from end-use activity and installed base behavior, and then checked totals using selective bottom-up approximations from supplier revenue signals and sampled ASP times volume logic. In practice, the model starts with demand pools where testing is non-optional, such as grid build and maintenance work, electronics manufacturing and labs, telecom network rollout, and electrified vehicle and battery production. The market value is then derived through equipment penetration and typical renewal or upgrade frequency.
A few inputs that mattered in this market model were the mix shift between portable and stationary gear, typical replacement cycles for multimeters and oscilloscopes, uptake of electronic loads and battery test systems in e-mobility, compliance-driven testing linked to safety standards, and regional investment cycles in utilities and manufacturing. Where direct volume proxies were weak, we used channel checks and interview ranges to set realistic utilization and refresh assumptions, and we kept a clear note trail for each override. Forecasting relied mainly on scenario analysis, translating macro and sector indicators into equipment demand, then validating the scenario weights using what practitioners described as achievable within their planning cycles.
Data Validation & Update Cycle
Outputs were validated through triangulation across independent checks, including whether the implied spend per end-use activity looked realistic and whether product mix shares aligned with what distributors and users described. If an estimate created abnormal jumps by region or application, we reviewed the assumptions behind ASP progression, replacement timing, and adoption rates again, then completed a second pass by another analyst before sign-off.
The report is refreshed annually, and interim updates are triggered when material events show up, such as regulatory shifts, major capacity additions in electronics, or sudden changes in trade flows that can affect supply and pricing. Before delivery, we do a final refresh pass so clients receive the latest updated view based on the newest public releases and recent interview feedback.
Mordor Intelligence's Electrical Test Equipment Market Size Versus Other Published Estimates
Published market sizes for electrical test equipment can look far apart because the underlying boundaries are not always the same, even when the titles sound similar. Differences usually come from what product families are counted, whether adjacent electronic test categories are included, how pricing and discounting are treated, and how often the data is refreshed.
The benchmark table shows a wide spread, and in Mordor Intelligence's model the value is limited to electrical test instruments sold as equipment revenue, with testing services, calibration-only fees, and broader electronic test benches kept outside the count. That scope choice changes the total compared with studies that blend those items together.
Benchmark comparison
| Source | Market Size | Gaps in Research Methodology |
|---|---|---|
| Mordor Intelligence | USD 17.31 B (2026) | |
| Trade Journal A | USD 13.05 B (2025) | This figure appears to use a broader electrical and electronic test equipment grouping and an earlier base year, which can understate newer demand pockets like battery commissioning and connected analyzers when the refresh cadence is slower. |
| Industry Publisher B | USD 5.96 B (2024) | This estimate likely reflects a narrower instrument subset and may exclude higher value systems such as electronic loads, battery test equipment, and network analyzers, while also using older currency timing and conservative ASP steps. |
What the comparison mostly signals is that scope choices and pricing logic drive the majority of the gap, not just the growth rate. By keeping each input tied back to clear demand triggers like replacement cycles, electrification build-out, and compliance-driven testing, the final number stays traceable and repeatable when assumptions are revisited.


Key Questions Answered in the Report
What is the electrical test equipment market size today and its forecast value in 2031?
The market stood at USD 17.31 billion in 2026 and is projected to reach USD 23.15 billion by 2031 on a 5.99% CAGR trajectory.
Which product category is growing the fastest among test instruments?
Regenerative electronic loads lead growth, posting a 6.33% CAGR as battery-validation labs recapture up to 90% of discharge energy and cut utility costs.
Why are portable instruments prioritized in new procurement plans?
They already hold 61.73% share and will grow at 7.12% CAGR because field crews can complete commissioning without de-energizing assets or hauling units to a lab.
How do recent safety regulations affect capital budgets for test gear?
IEC 61010-1 Edition 4.0 and UL 9540A mandate redesigned housings and longer battery-storage fire tests, triggering accelerated replacement cycles and higher compliance spending.
Which geography is expected to deliver the highest growth through 2031?
Asia-Pacific is forecast to expand at a 6.65% CAGR due to semiconductor fab builds, EV battery plants, and government incentive schemes.
Page last updated on:


 Your data is secure and never sold or shared.


