
Market Overview
| Study Period | 2020 - 2031 |
|---|---|
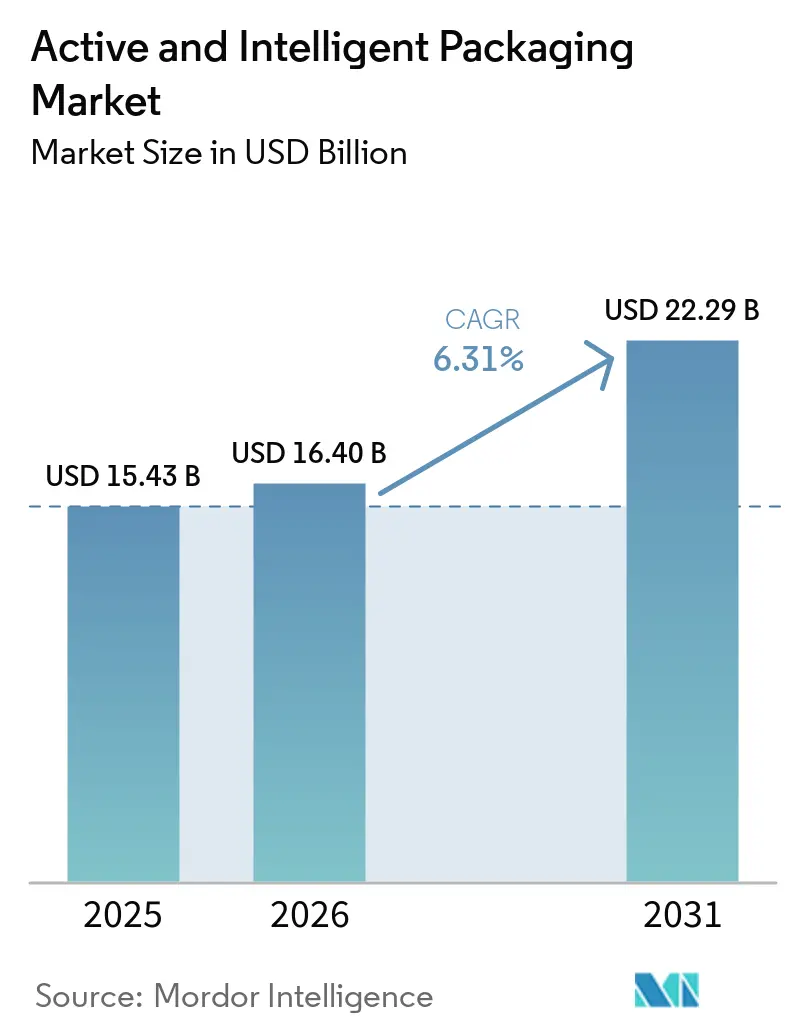
| Market Size (2026) | USD 16.40 Billion |
| Market Size (2031) | USD 22.29 Billion |
| Growth Rate (2026 - 2031) | 6.31 % |
| Fastest Growing Market | Asia Pacific |
| Largest Market | North America |
| Market Concentration | Medium |
Major Players *Disclaimer: Major Players sorted in no particular order Image © Mordor Intelligence. Reuse requires attribution under CC BY 4.0. | |
Active and Intelligent Packaging Market Analysis by Mordor Intelligence
The active and intelligent packaging market size in 2026 is estimated at USD 16.4 billion, growing from 2025 value of USD 15.43 billion with 2031 projections showing USD 22.29 billion, growing at 6.31% CAGR over 2026-2031. Sustained adoption across food, pharmaceutical, and industrial supply chains underpins this momentum as manufacturers shift from passive barrier structures to solutions that sense or respond to their environment. Supermarket chains are rolling out oxygen-scavenging film to curb spoilage, pharmaceutical firms are embedding RFID inlays to comply with serialization 2.0, and e-commerce grocery platforms are specifying smart labels that flag temperature abuse in real time. Brand owners view these functions as insurance against reputational damage and recall costs, so demand continues even when resin prices fluctuate. The pivot also dovetails with legislation phasing down single-use plastics, motivating companies to pursue thinner smart laminates that deliver equivalent or better product protection.
Key Report Takeaways
- By packaging function, product freshness captured 45.90% of the active and intelligent packaging market share in 2025, whereas the brand protection segment is projected to grow at an 8.42% CAGR between 2026-2031.
- By packaging technology, the active packaging segment captured 62.70% of the active and intelligent packaging market share in 2025, whereas the intelligent packaging segment is projected to grow at a 7.56% CAGR between 2026-2031.
- By active packaging type, gas scavengers captured 37.65% of the active packaging market size in 2025. The moisture scavengers segment is projected to grow at a 7.98% CAGR between 2026-2031.
- By intelligent packaging type, coding and markings captured 41.20% of the intelligent packaging market size in 2025. The antenna (RFID and NFC) segment is projected to grow at a 9.02% CAGR between 2026-2031.
- By end-user industry, the food segment captured 35.20% of the intelligent packaging market size in 2025, whereas the pharmaceuticals segment is projected to grow at a 7.23% CAGR between 2026-2031.
- By geography, North America captured 34.00% of the intelligent packaging market size in 2025, and Asia-Pacific is projected to grow at a 9.45% CAGR between 2026-2031.
Note: Market size and forecast figures in this report are generated using Mordor Intelligence’s proprietary estimation framework, updated with the latest available data and insights as of 2026.
Market Trends and Insights
Drivers Impact Analysis of Active and Intelligent Packaging Market*
| Driver | (~) % Impact on CAGR Forecast | Geographic Relevance | Impact Timeline |
|---|---|---|---|
| Supermarket Demand for Longer Shelf-Life Fresh Produce | +1.8% | Global, with early gains in North America, Europe | Medium term (2-4 years) |
| Brand-Owner Push for Real-Time Cold-Chain Visibility | +1.5% | Global, spill-over to emerging markets | Short term (≤ 2 years) |
| Regulatory Shift Toward Single-Use Plastic Reduction | +1.2% | Europe, North America, APAC core markets | Long term (≥ 4 years) |
| E-Commerce Boom Creating Last-Mile Freshness Challenges | +1.0% | Global, concentrated in urban centers | Short term (≤ 2 years) |
| Integration of Printed Electronics in Flexible Films | +0.7% | APAC core, spill-over to North America | Medium term (2-4 years) |
| Pharmaceutical Serialization 2.0 Mandates | +0.6% | Global, regulatory compliance-driven | Short term (≤ 2 years) |
| Source: Mordor Intelligence | |||
Supermarket Demand for Longer Shelf-Life Fresh Produce
Large grocery chains reported 15-25% spoilage reduction after adopting oxygen and moisture scavengers, translating into better margins and fewer out-of-stocks.[1] Enzymatic scavengers activate only in the presence of oxygen, so the package headspace remains balanced throughout distribution. Multiple retailers are now integrating smart indicators that change color once scavenger capacity is exhausted, giving store associates a visual cue for stock rotation. FDA and EFSA approvals of newer iron-polymer composites accelerated commercial launch schedules, while in-line sachet placement equipment lowered changeover time on high-speed lines. The benefit is most pronounced in regions with long distribution distances, such as North America, yet adoption is expanding in Europe and urban Asia as retailers target waste reduction mandates.
Brand-Owner Push for Real-Time Cold-Chain Visibility
RFID-enabled temperature loggers capable of ±0.5 °C accuracy record data every five minutes, providing granular thermal histories for vaccines and biologics.[2] Pharmaceutical companies integrate these logs with cloud platforms that send automatic alerts when cumulative thermal exposure reaches warning thresholds. Food brands are following suit in frozen desserts and seafood, leveraging predictive analytics to reroute at-risk pallets before quality deteriorates. Capital outlays are declining as tag costs fall below USD 0.05, making item-level deployment feasible for high-value SKUs. The business case hinges on recall avoidance rather than pure logistics optimization, so ROI remains compelling even under conservative spoilage assumptions.
Regulatory Shift Toward Single-Use Plastic Reduction
California’s SB 54 targets a 65% cut in single-use packaging by 2032, prompting brands to substitute conventional rigid tubs with thinner smart films outfitted with freshness indicators. The European Union’s directive spurred commercial trials of compostable NFC tags produced on cellulose substrates that disintegrate in industrial composters within 180 days. Certification under ISO 17088 is emerging as a procurement prerequisite for multinational grocery chains. Concurrently, Asia-Pacific nations such as Japan are testing laser-etched smart codes that eliminate adhesive labels, trimming overall material intensity. These policy signals are shifting R&D budgets toward high-function, low-mass laminates.
E-Commerce Boom Creating Last-Mile Freshness Challenges
Meal-kit providers now ship proteins across multiple temperature zones, so phase-change liners paired with time-temperature integrators mitigate spoilage in extended delivery windows. IoT gateways embedded in parcel lockers relay condition data to customer smartphones, allowing refusal of compromised shipments. Urban micro-fulfillment centers analyze aggregated excursion data to fine-tune route planning, thereby cutting dry-ice consumption. Smaller local brands piggyback on third-party logistics platforms that offer smart-label options as a value-added service. As same-day grocery delivery expands to second-tier cities, demand for affordable freshness monitoring is scaling quickly.
Restraints Impact Analysis of Active and Intelligent Packaging Market*
| Restraint | (~) % Impact on CAGR Forecast | Geographic Relevance | Impact Timeline |
|---|---|---|---|
| High Initial Equipment and Retrofit Costs | -1.4% | Global, particularly emerging markets | Medium term (2-4 years) |
| Human Toxicology Concerns around Scavenger Chemistries | -0.9% | Global, regulatory oversight intensive | Long term (≥ 4 years) |
| Fragmented Recycling Infrastructure for Smart Labels | -0.7% | Europe, North America, spill-over to APAC | Long term (≥ 4 years) |
| Semiconductor Supply Bottlenecks for RFID Inlays | -0.5% | Global, concentrated in Asia-Pacific manufacturing hubs | Short term (≤ 2 years) |
| Source: Mordor Intelligence | |||
High Initial Equipment and Retrofit Costs
A mid-sized converter spends USD 2-8 million to add multilane oxygen-scavenger insertion systems, vision inspection, and RFID encoding stations.[3] Payback stretches past four years if output volumes stay modest, so small firms often postpone investment. Financing options remain limited in emerging markets, where commercial lenders perceive smart-pack assets as niche collateral. Training expenses further inflate capital outlays because technicians must master both packaging mechanics and electronics troubleshooting. OEMs are responding with modular retrofits that clip onto existing form-fill-seal machines, lowering entry thresholds but still leaving a sizable cash hurdle.
Human Toxicology Concerns around Scavenger Chemistries
EFSA and FDA require exhaustive migration studies before new scavenger formulations reach the market, a process that can span 18-24 months and cost over USD 1 million. Consumer watchdogs scrutinize iron-based systems for possible metal leaching, prompting retailers to favor enzymatic alternatives despite higher unit costs. As analytical instruments become more sensitive, permissible exposure limits may tighten further, prolonging dossier preparation. Start-ups sometimes pivot away from direct-food contact applications toward secondary packaging to sidestep these hurdles. The perception of chemical risk slows speed-to-market for innovative actives, particularly in baby food and nutraceutical categories.
*Our forecasts treat driver/restraint impacts as directional, not additive. The impact forecasts reflect baseline growth, mix effects, and variable interactions.
Active and Intelligent Packaging Market Segment Analysis
By Packaging Function:
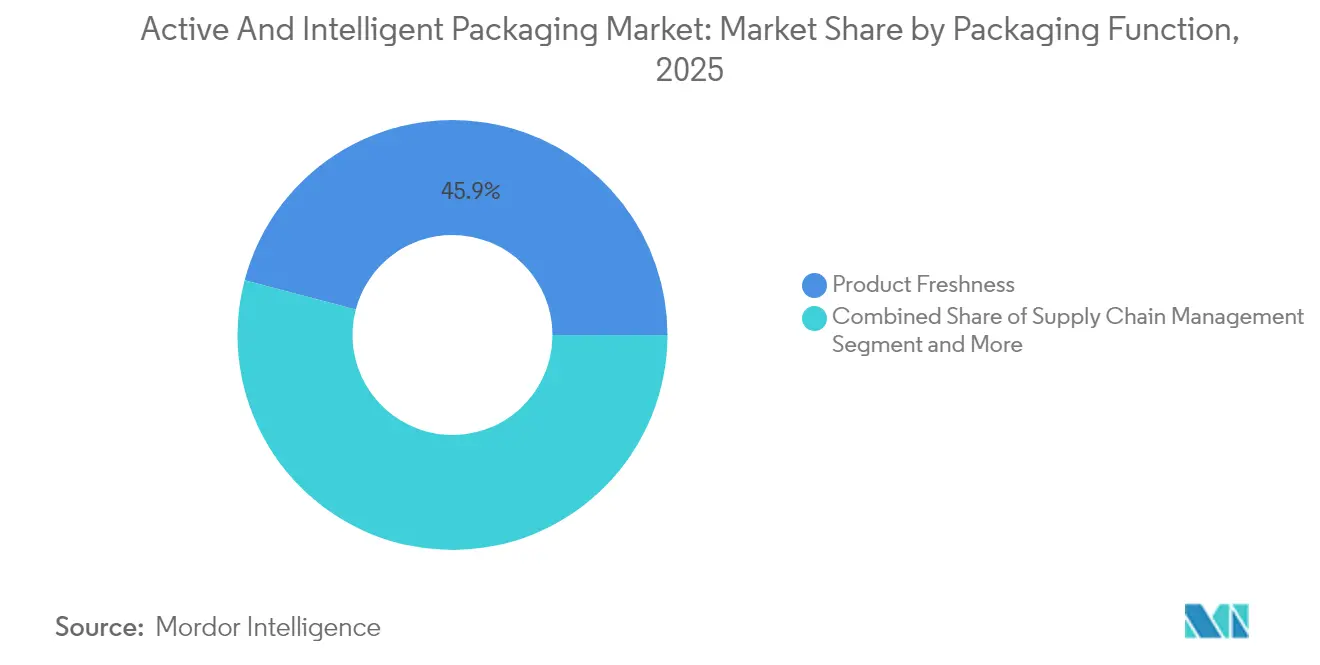
Product Freshness Drives InnovationProduct freshness applications captured 45.90% share of the active and intelligent packaging market in 2025, underscoring the premium retailers' place on extending perishable shelf life. This dominance reflects the broad utility of oxygen scavengers, moisture absorbers, and ethylene inhibitors that operate without power and integrate easily into existing lines. The active and intelligent packaging market size for freshness solutions is forecast to grow toward USD 10.23 billion by 2031, propelled by stricter waste-reduction targets in North America and Europe. Retailers' benchmarking shrink rates are assigning cost savings directly to active formats, drawing follow-on investment from produce packers seeking preferred-supplier status. Consumer behavior aligns with this priority as surveys indicate freshness is the top driver of repeat purchase across refrigerated categories.
The fastest-growing functional segment is brand protection at an 8.42% CAGR, buoyed by counterfeit risks in pharmaceuticals and luxury cosmetics. NFC tags embedded under tamper-evident seals enable one-tap authentication, while UV-responsive inks add covert security layers. Global authorities confiscated fake drugs, intensifying pressure on legitimate manufacturers to safeguard supply chains. By integrating serialized identifiers with cloud dashboards, companies gain real-time diversion alerts and market intelligence on gray-market flows. These combined dynamics position freshness and security as dual pillars of functional demand, ensuring diversified revenue streams for solution providers.

By Packaging Technology:
Active Solutions Lead MarketActive technologies held a 62.70% share in 2025 as its passive mode of action suits high-volume commodities. They require no batteries and minimal supply-chain modification, reducing implementation friction. Iron-based scavengers remain cost leaders at less than USD 0.02 per sachet, sustaining uptake in value-driven segments such as bakery and snack foods. The active and intelligent packaging market is witnessing hybridization, with active films now incorporating printed temperature strips that darken after cumulative exposure thresholds. Intelligent technologies, although on a smaller base, are advancing at a 7.56% CAGR as unit economics improve and 5G connectivity lowers data-transmission costs.
Emerging printed-electronics platforms blur the lines between the two camps. Roll-to-roll gravure presses can deposit conductive traces alongside gas-absorbing chemistries in a single pass, creating self-regulating packs that vent CO₂ when fermentation begins. Standards bodies like ISO 15378 are updating guidance to cover such multifunctional constructs, giving early movers regulatory clarity. This convergence widens the moat for converters with both chemistry and electronics expertise, reinforcing the competitive advantage of integrated players in the active and intelligent packaging market.
By Active Packaging Type:
Gas Scavengers Dominate ApplicationsGas scavengers represented 37.65% of segment revenue in 2025, largely due to their versatility across meats, snacks, and pharmaceuticals. Oxygen scavengers, the flagship subset, prevent lipid oxidation and microbial growth, extending ambient shelf life by up to 12 months in some dry snack formats. The active and intelligent packaging market share for scavengers remains resilient because performance is quantifiable through headspace analysis, simplifying ROI calculations. Moisture scavengers follow closely, riding a wave of demand in electronics and powdered nutraceuticals where humidity compromises efficacy.
Microwave susceptors continue serving ready-meal niches but face substitution from ovenable barrier trays that eliminate ancillary films. Innovation in polymer-integrated scavengers is cutting out sachets altogether, pleasing brand managers keen on uncluttered pack aesthetics. Patent filings surged 18% in 2024, emphasizing polymer-matrix solutions that generate no loose components, thereby reducing FOD (foreign-object debris) risk on high-speed lines.
By Intelligent Packaging Type:
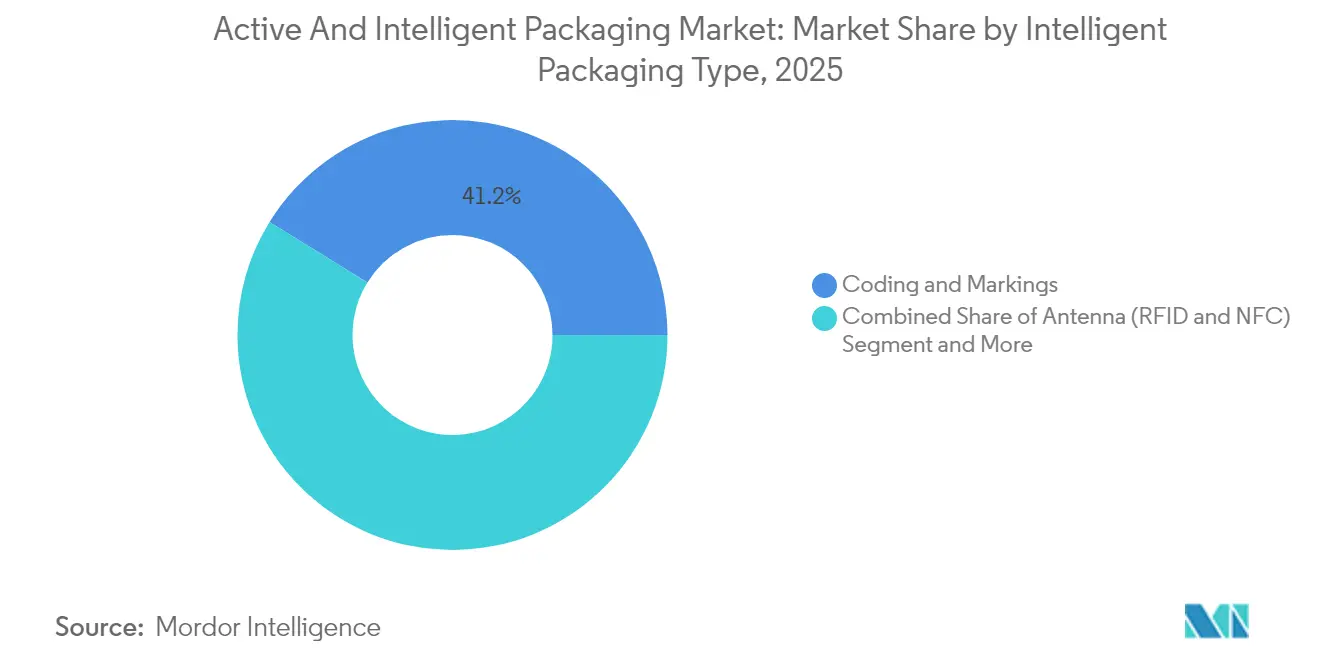
Digital Integration AcceleratesCoding and markings commanded a 41.20% share because infrastructure exists worldwide to read barcodes and QR codes. Brands employ dynamic QR links that update provenance or promotional content without reprinting, maximizing post-launch agility. The active and intelligent packaging industry leverages these low-cost gateways to transition consumers toward richer NFC-based interactions. Antenna technologies, chiefly RFID and NFC, exhibit a robust 9.02% CAGR, underpinned by pharmaceutical serialization deadlines and omnichannel retail models that demand omnipresent inventory visibility.
Printed sensor arrays detecting temperature, gas, and microbial spoilage are now roll-to-roll manufactured at up to 500 m/min, slashing unit costs. Some dairy brands trial colorimetric freshness labels that change from blue to white when cumulative chill exposure exceeds safe thresholds, opening a visible feedback loop for consumers. Blockchain-anchored authentication services integrate with these sensors, producing immutable records that regulators can audit instantly.
By End-user Industry:
Food Applications Lead AdoptionFood applications accounted for a 35.20% share of the active and intelligent packaging market in 2025, a reflection of high perishability and consumer sensitivity to freshness. Grocery retailers insist suppliers adopt active oxygen absorbers to extend chilled meat shelf life from 12 to 18 days, easing replenishment scheduling. Dairy processors layer antimicrobial peptides into inner films to delay mold growth, while produce growers add ethylene absorbers inside clamshells to slow ripening.
Pharmaceuticals register the highest 7.23% CAGR as biologics, vaccines, and personalized therapies demand item-level monitoring at sub-zero temperatures. Serialization 2.0 forces every saleable unit to carry a digital identity, making intelligent features non-negotiable. Beverage and industrial users deploy smart packaging mainly for anti-counterfeit and condition monitoring in extended ocean freight, whereas logistics firms harness RFID for pallet-level visibility to optimize hub routing. The diverse uptake across sectors insulates solution providers from demand swings in any single vertical.
Geography Analysis
North America Active and Intelligent Packaging Market
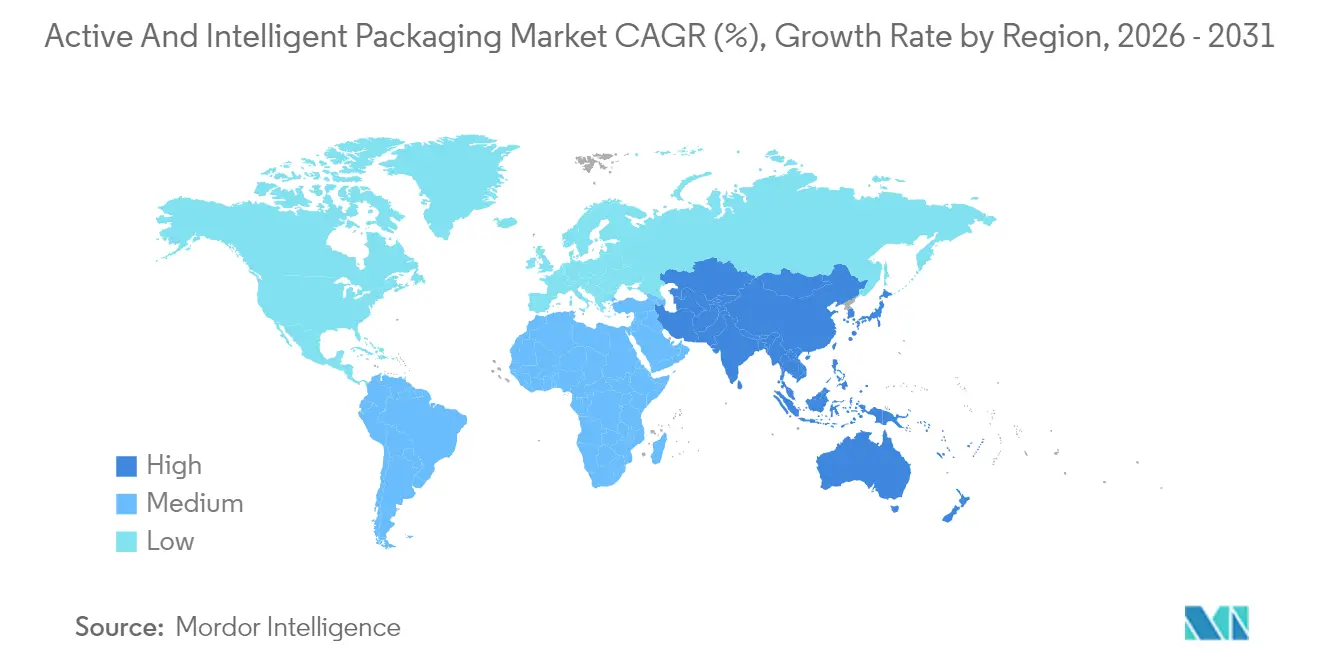
North America led the active and intelligent packaging market with 34.00% share in 2025 as FDA serialization and mature cold chains gave early impetus. Retailers employ embedded freshness indicators to verify supplier performance, and venture capital continues funding start-ups that merge IoT with flexible packaging. Smart-label penetration surpassed 18% of chilled meat packs in the United States by late 2025, cementing user familiarity.
Europe Active and Intelligent Packaging Market
Europe remains a technology crucible where sustainability legislation drives rapid iteration. The Single-Use Plastics Directive stimulated R&D into compostable NFC tags and solvent-free laminations. Germany piloted digital watermarks for automatic pack sorting, achieving 95% detection accuracy during municipal trials. France’s extended producer responsibility fees, tiered by recyclability and recycled content, indirectly nudge converters toward mono-material smart films.
APAC Active and Intelligent Packaging Market
Asia-Pacific is the fastest grower at a 9.45% CAGR, powered by China’s upgraded food labeling law and India’s “Make in India” push that now hosts regional RFID chip production. The active and intelligent packaging market size in Asia-Pacific could overtake Europe by 2028 if current capital expenditure plans materialize. Japan’s convenience-store channel is piloting time-temperature integrators on premium bento boxes, while South Korea mandates serialization for select biologics, pushing intelligent adoption deeper into healthcare.
Regulatory Landscape
Active and intelligent packaging for food-contact applications is shaped by premarket substance authorization and documentation requirements, which influence material selection and time-to-market. In the European Union, Regulation (EC) No 450/2009 sets rules for active and intelligent materials and requires a written Declaration of Compliance throughout the marketing chain (in line with the broader food-contact framework), while EFSA evaluations support authorizations for substances used in active components.
In the United States, the FDA regulates packaging substances that may become food additives, typically requiring authorization via the Food Contact Substance (FCS) Notification pathway or other relevant routes under 21 CFR Part 170. Packaging identification and marking practices also continue to standardize globally, including ISO 6608-1:2024 (active packaging functional requirements and evaluation criteria), and newer ISO labeling/marking standards published in May 2026 (ISO 22742:2026 and ISO 28219:2026), which support interoperability for coding, traceability, and compliance workflows in intelligent packaging deployments.
Value Chain Analysis
The active and intelligent packaging value chain covers (1) material and component inputs (polymers, paper/fiber substrates, adhesives, inks, scavenger chemistries, antimicrobial agents, RFID/NFC inlays and ICs, and sensor elements), (2) packaging producers and converters integrating actives or printed/digital features into films, labels, and rigid formats, (3) machinery and line-integration providers enabling insertion, encoding, inspection, and data capture, (4) packers/co-packers and brand owners specifying performance and compliance requirements (freshness extension, authentication, and cold-chain visibility), (5) retailers and logistics providers using data for inventory integrity and shrink reduction, and (6) end-of-life actors, including collection, sorting, and recyclers managing the added complexity of multilayer structures and smart labels.
The main bottlenecks come from cross-stakeholder coordination and technical integration at scale, especially when chemistry-driven actives are paired with electronics-driven identification and sensing. Standards and compliance requirements govern handoffs across the chain, for example ISO 6608-1:2024 providing common active-packaging performance language, and EU requirements under Regulation (EC) No 450/2009 mandating declarations of compliance for active and intelligent materials during marketing. Industry bodies such as AIPIA also support pilots-to-scale transitions, reinforcing the role of collaboration among converters, technology suppliers, and brand owners.
Competitive Landscape
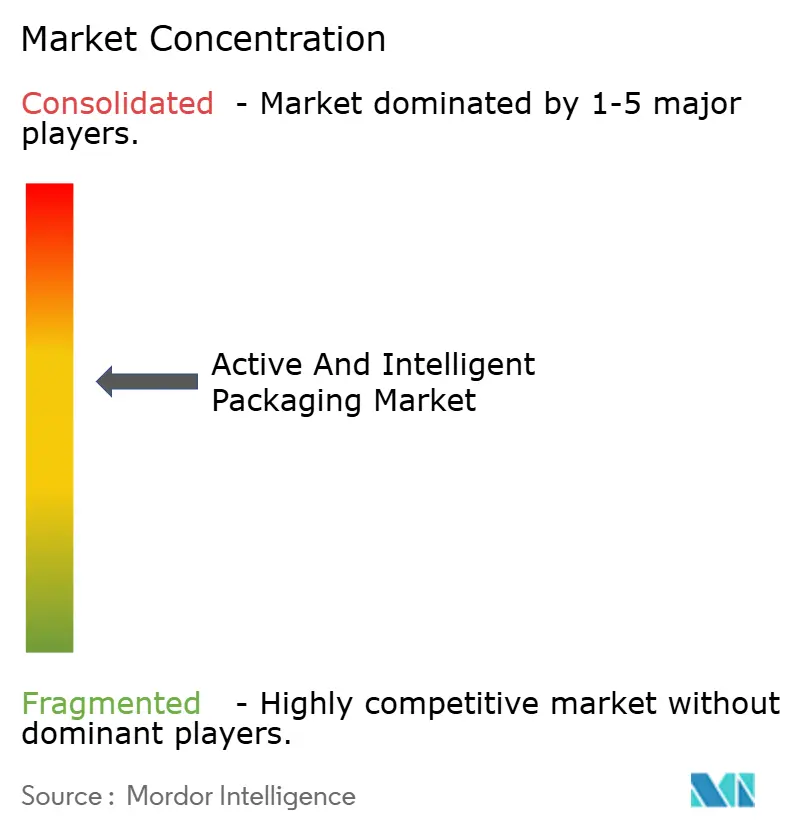
Moderate concentration defines the active and intelligent packaging market, with the top players collectively holding significant market revenue share. Amcor plc, Sealed Air Corporation, and Avery Dennison Corporation allocate millions annually to smart-pack R&D, often partnering with semiconductor fabricators to secure RFID chip access.
Avery Dennison opened its first ARC-certified RFID inlay plant in India in April 2025, cementing supply resilience and tapping regional demand. Mid-tier firms target niches such as antimicrobial films or compostable smart labels, gaining traction with agility and specialized expertise. Patent races intensify around energy-harvesting inks that draw power from ambient RF signals, a breakthrough that could eliminate thin-film batteries altogether. Competitive pressure now hinges on software ecosystems as much as material innovation, steering strategic alliances between packaging converters and cloud-service providers.
Emerging disruptors experiment with SaaS-bundled packaging, selling freshness data subscriptions rather than physical labels alone. Investors back companies integrating AI-driven demand forecasting with smart-pack signals, promising inventory reductions across downstream nodes. As a result, incumbents are re-skilling workforces toward data science and mechatronics, signaling a long-term pivot toward tech-centric business models.
Active and Intelligent Packaging Industry Leaders
-
Avery Dennison Corporation
-
Multisorb Technologies Inc.
-
Amcor plc
-
Sealed Air Corporation
-
Coveris Holding SA
- *Disclaimer: Major Players sorted in no particular order
Active and Intelligent Packaging Market Companies Covered in this Report
- Amcor plc
- Sealed Air Corporation
- Avery Dennison Corporation
- Crown Holdings Inc.
- Ball Corporation
- Coveris Holding SA
- Smurfit WestRock plc
- Honeywell International Inc.
- Graphic Packaging International LLC
- Desiccare Inc.
- Timestrip UK Ltd.
- Multisorb Technologies Inc.
- Tetra Pak International SA
- Thinfilm Electronics ASA
- PakSense Inc.
- Insignia Technologies Ltd.
- Printpack Inc.
Market Opportunities and Future Outlook
Regulatory-driven digitalization and harmonized labeling requirements create whitespace for intelligent packaging formats that carry compliance data while supporting operational use cases. The EU Packaging and Packaging Waste Regulation (Regulation (EU) 2025/40) applies from 12 August 2026, adding producer identification and conformity obligations for packaging, and it increases the value of machine-readable labeling strategies that can hold structured information without expanding on-pack real estate. This setting supports broader deployment of QR-based systems such as GS1 Digital Link as a practical bridge between physical packs and emerging digital product information needs across multiple EU markets.
On the technology side, opportunities center on smart architectures that can align with recycling constraints and lower-burden electronics. Development efforts around biodegradable, printable, and chipless RFID sensors connect to recycling requirements and extended producer responsibility pressures, while active solutions such as oxygen scavengers and antimicrobial films continue to target food-waste reduction in retail and e-commerce distribution. With North America already deepening smart-label penetration in chilled foods and Asia-Pacific building RFID production capacity under industrial policy programs, suppliers that package active functionality with interoperable identification (RFID/NFC/QR) and deployable data workflows have clearer paths to multi-region rollouts without relying on a single end-use category.
Recent Industry Developments in Active and Intelligent Packaging Market
- May 2026: Amcor advanced fiber-based food packaging development with Metsa Group and G. Mondini, positioning molded-fiber and paper-based formats as viable alternatives for applications that still need performance features such as barrier and pack integrity. The collaboration highlights the shift toward recycle-ready structures that can coexist with active functions like modified-atmosphere packaging in retail meat and prepared foods.
- February 2026: Avery Dennison launched the AD IdentiFresh RFID inlay series targeted at fresh-food categories including bakery, meat, deli, and produce, supporting item-level visibility and freshness-led inventory management. The release strengthens infrastructure for intelligent packaging adoption where retailers and brands need faster sell-through, shrink control, and tighter cold-chain oversight.
- November 2024: VarieT Technology unveiled its Smart Heat Battery, a self-heating insert designed for on-demand warming of canned foods and beverages. This type of add-on active component expands the scope of consumer-convenience use cases and creates new integration work for converters and brand owners around safety, pack compatibility, and user activation.
Active and Intelligent Packaging Market Report Scope and Research Methodology
Market Definition and Coverage
For this study, the active and intelligent packaging market is defined as packaging formats and components that either extend shelf life through active functions or provide condition, identity, or traceability information through intelligent features, measured in revenue terms.
Scope exclusions: The sizing excludes conventional packaging without an active or intelligent function, and it also excludes standalone tracking devices sold outside packaging formats.
Segments Covered in This Report
- By Packaging Function
- Supply Chain Management
- Product Freshness
- Consumer Convenience
- Brand Protection
- Product Information
- By Packaging Technology
- Active Packaging
- Intelligent Packaging
- By Active Packaging Type
- Gas Scavengers/Emitters
- Moisture Scavengers
- Microwave Susceptors
- Other Active Packaging Technologies
- By Intelligent Packaging Type
- Coding and Markings
- Antenna (RFID and NFC)
- Sensors and Output Devices
- Other Intelligent Packaging Technologies
- By End-user Industry
- Food
- Beverages
- Pharmaceuticals
- Industrial
- Logistics
- Other End-user Industries
- By Geography
- North America
- United States
- Canada
- Mexico
- South America
- Brazil
- Argentina
- Rest of South America
- Europe
- United Kingdom
- Germany
- France
- Italy
- Spain
- Rest of Europe
- Asia-Pacific
- China
- India
- Japan
- South Korea
- Australia
- Rest of Asia-Pacific
- Middle East and Africa
- Middle East
- Saudi Arabia
- United Arab Emirates
- Turkey
- Rest of Middle East
- Africa
- South Africa
- Nigeria
- Rest of Africa
- Middle East
- North America
Data Sources, Market Sizing, and Validation
Desk Research
Desk research was used to set market boundaries, identify the most common active and intelligent packaging functions, and establish initial ranges for pricing and adoption by end use. We referenced public and official materials, including the US FDA, the European Commission, and other national food safety regulators, focusing on packaging contact rules and labeling requirements that tend to shape adoption timelines.
To quantify demand signals, we reviewed statistics and publications from sources such as UN Comtrade, the World Bank, and national statistics offices for packaged food production, trade flows, and consumption indicators. We then linked these indicators to packaging throughput in the model. We also used corporate annual reports, investor presentations, association websites, and reputed business press for capacity additions and technology launches, and we validated the direction of these developments through company financials and news and financials databases, along with a patent database.
These desk sources are not exhaustive. Additional public references were used to collect, cross-check, and clarify data points as the market definition and pricing ranges were refined.
Primary Interviews and Surveys
Primary work was run to validate adoption rates, typical bill-of-material uplift for active layers or smart labels, and realistic pricing movements by region and end use. We spoke with packaging converters, material and component suppliers, brand owners, and logistics or cold-chain stakeholders in the main demand regions to close gaps left by public data and to pressure-test assumptions used in the pricing ladder and penetration steps.
Distribution of primary research fieldwork respondents
| Company type | Respondent position | Region |
|---|---|---|
| Top tier: 27% | CXOs: 20% | APAC: 45% |
| Mid tier: 52% | Functional/Unit leaders: 38% | EMEA: 37% |
| Smaller Players: 21% | Managers: 42% | Americas: 18% |
Market-Sizing & Forecasting
Sizing was built using a top-down and bottom-up structure, where packaged food, beverage, and pharma output indicators were used to reconstruct an addressable packaging throughput, which was then filtered by active and intelligent feature penetration. Once the demand pool was defined, revenue was derived using price ladders for common functions (such as oxygen and moisture management, antimicrobial activity, RFID or NFC enablement, and sensing or coding features) and then normalized by region and end-use mix.
To keep the totals realistic, we corroborated the model with selective bottom-up approximations, including sampled average selling price ranges multiplied by estimated volumes for high-penetration formats, plus channel checks with converters and component suppliers. Inputs that mattered most included packaged food trade volumes, cold-chain expansion signals, regulation-driven labeling and traceability requirements, typical shelf-life extension use cases, and cost deltas versus conventional packs. Where company-level data was not available, we handled gaps by using proxy capacity signals and interview-led adoption ranges, then tightened them through iterative cross-checks.
Forecasting relied mainly on scenario analysis, since adoption depends on compliance timelines, cost-down curves for tags and sensors, and brand-level sustainability and waste-reduction priorities. The scenarios were anchored to expert consensus on penetration changes by end use, then converted into yearly revenue using updated price assumptions and region weights.
Data Validation & Update Cycle
Model outputs were checked through triangulation across independent signals, including trade and production trends, reported packaging activity, and interview feedback on adoption and pricing. When we saw variances, we reviewed them in multiple steps, first by checking units, currency conversions, and timing alignment, and then by re-testing the key assumptions that drive the largest share of value.
If a large mismatch appeared, for example a sharp price swing in smart labels or a regulatory change that affected food contact materials, the team re-contacted sources and re-ran the sensitivity cases before sign-off. Reports are refreshed annually, and interim updates are made when material events occur. Before delivery, a final update pass is completed so the view reflects the latest available developments.
Mordor Intelligence's Active and Intelligent Packaging Market Market Size Versus Other Published Estimates
Published market sizes for active and intelligent packaging can look far apart because scope is not always consistent, the base year is not the same, and the price and penetration assumptions are refreshed at different times. Some sources also include adjacent concepts within broader smart packaging categories, which can inflate totals if the boundary is not clearly controlled.
Key gaps usually come from what gets counted as intelligent packaging revenue, how fast RFID or sensor pricing is assumed to decline, and whether food and pharma adoption is modeled from packaging throughput signals or from broad spending ratios. By checking packaged goods throughput indicators and refreshing penetration and ASP assumptions through expert calls, Mordor Intelligence keeps the estimate tied to active functions and intelligent components embedded in packaging formats.
Benchmark comparison
| Source | Market Size | Gaps in Research Methodology |
|---|---|---|
| Mordor Intelligence | USD 16.4 B (2026) | |
| Industry Publisher A | USD 15.69 B (2024) | Uses a different base year and a longer horizon, and the value can shift based on how fast tag and sensor cost-down is applied and how penetration is stepped up from 2024 levels. |
| Industry Publisher B | USD 15.50 B (2024) | Anchors the model to a 2024 base and may apply broader average pricing across formats, which can understate high-value applications if active layers and smart labels are not priced separately by end use. |
Across the three estimates, most of the spread is explained by year alignment and how strictly the revenue boundary is tied to embedded active and intelligent functions. Using explicit throughput, penetration, and pricing steps makes the market total easier to audit, and it also makes updates simpler when assumptions change.
Key Questions Answered in the Report
How large is the active and intelligent packaging market in 2026?
It is valued at USD 16.4 billion, with a projected rise to USD 22.29 billion by 2031 at a 6.31% CAGR.
Which application currently drives the highest revenue?
Product freshness commands a 45.90% share thanks to the wide adoption of oxygen and moisture scavengers at retail and processor levels.
What region leads the adoption of intelligent packaging?
North America holds a 34.00% share due to FDA serialization rules and mature cold-chain networks.
Which technology segment is growing fastest?
Antenna-based intelligent packaging, such as RFID and NFC inlays, is forecast to grow at a 9.02% CAGR through 2031.
What is the key restraint for small converters?
Up-front equipment and retrofit costs of USD 2-8 million per facility extend payback periods beyond four years.