
Vacuum Packaging Market Size and Share
Market Overview
| Study Period | 2020 - 2031 |
|---|---|
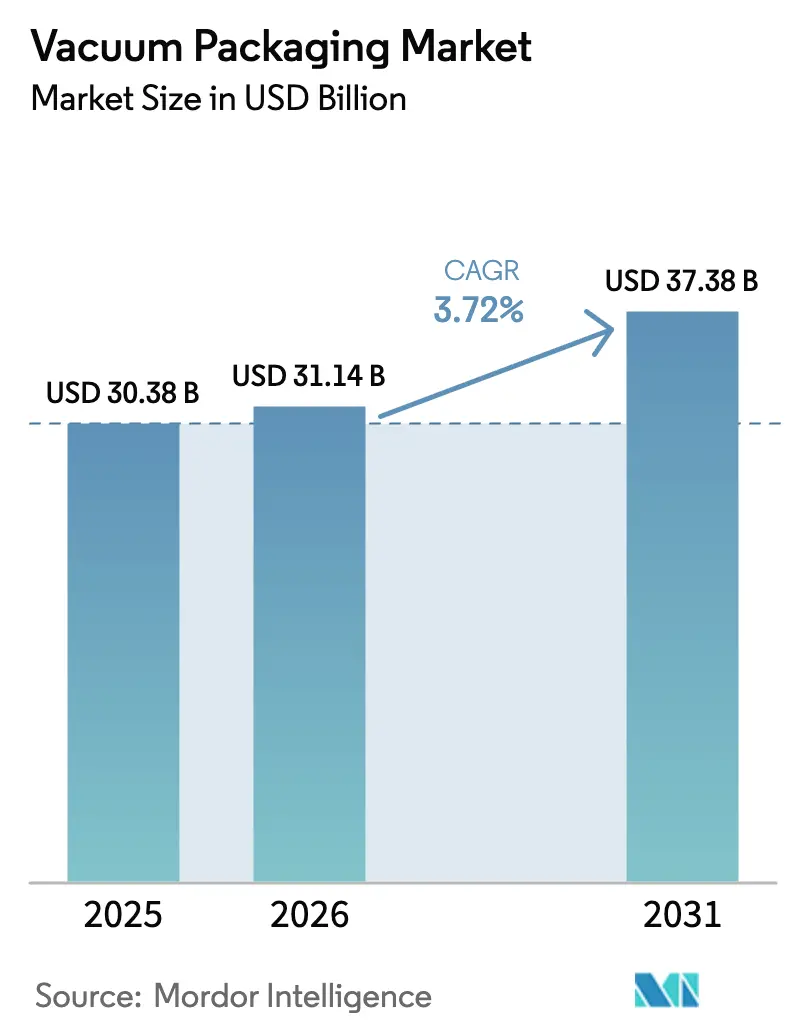
| Market Size (2026) | USD 31.14 Billion |
| Market Size (2031) | USD 37.38 Billion |
| Growth Rate (2026 - 2031) | 3.72% CAGR |
| Fastest Growing Market | Middle East and Africa |
| Largest Market | Asia Pacific |
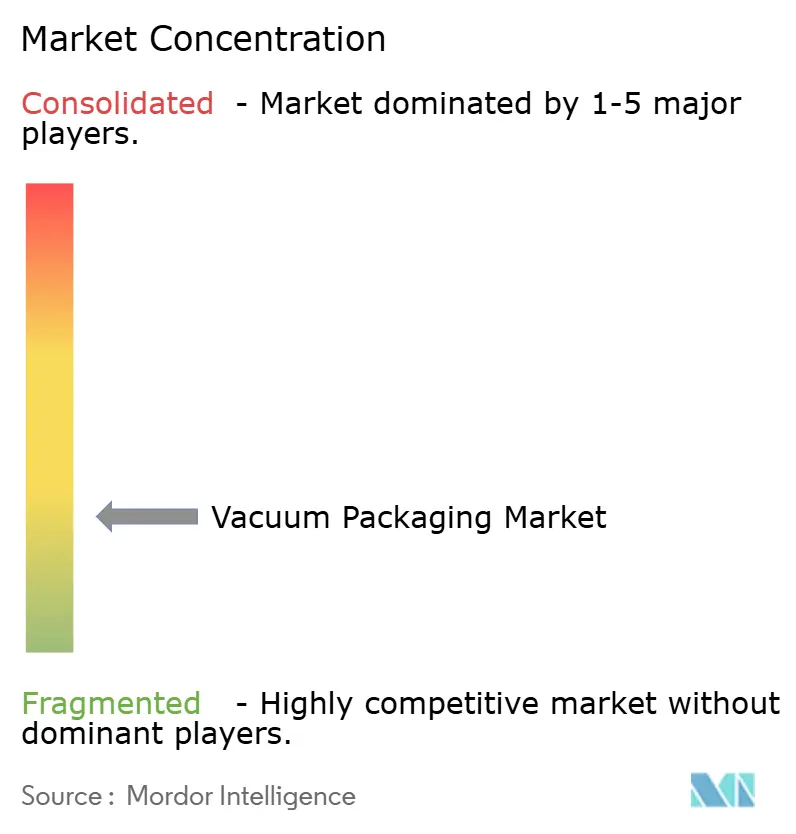
| Market Concentration | Low |
Major Players *Disclaimer: Major Players sorted in no particular order Image © Mordor Intelligence. Reuse requires attribution under CC BY 4.0. | |
Vacuum Packaging Market Analysis by Mordor Intelligence
The vacuum packaging market size is projected to expand from USD 30.38 billion in 2025 and USD 31.14 billion in 2026 to USD 37.38 billion by 2031, registering a CAGR of 3.72% between 2026 to 2031. Rising adoption of shelf-life-extending formats across online grocery, protein exports, and sterile medical supplies continues to outweigh the capital hurdles of automated thermoform lines and tightening rules on halogenated barriers. Flexible pouches and bags remain the dominant format because they reduce freight weight, reduce resin use, and meet high-speed form-fill-seal throughput targets of 200 cycles per minute or more. Polyethylene keeps cost leadership, but polyamide is taking share wherever oxygen sensitivity matters, especially in chilled meats and high-value biologics. Food accounts for roughly two-thirds of demand, yet healthcare has emerged as the fastest climber as ISO 11607 enforcement accelerates. Thermoformers are the machinery of choice thanks to inline leak detection and adaptive sealing that have pushed reject rates below 0.5% on premium lines. Regionally, Asia-Pacific generates the largest revenue, while the Middle East and Africa post the highest CAGR on the back of food security mandates and logistics upgrades. Competitive rivalry is intensive because no player controls more than 12% of revenue, which is encouraging patent races around mono-material barriers and inorganic moves aimed at consolidating sub-scale converters.
Key Report Takeaways
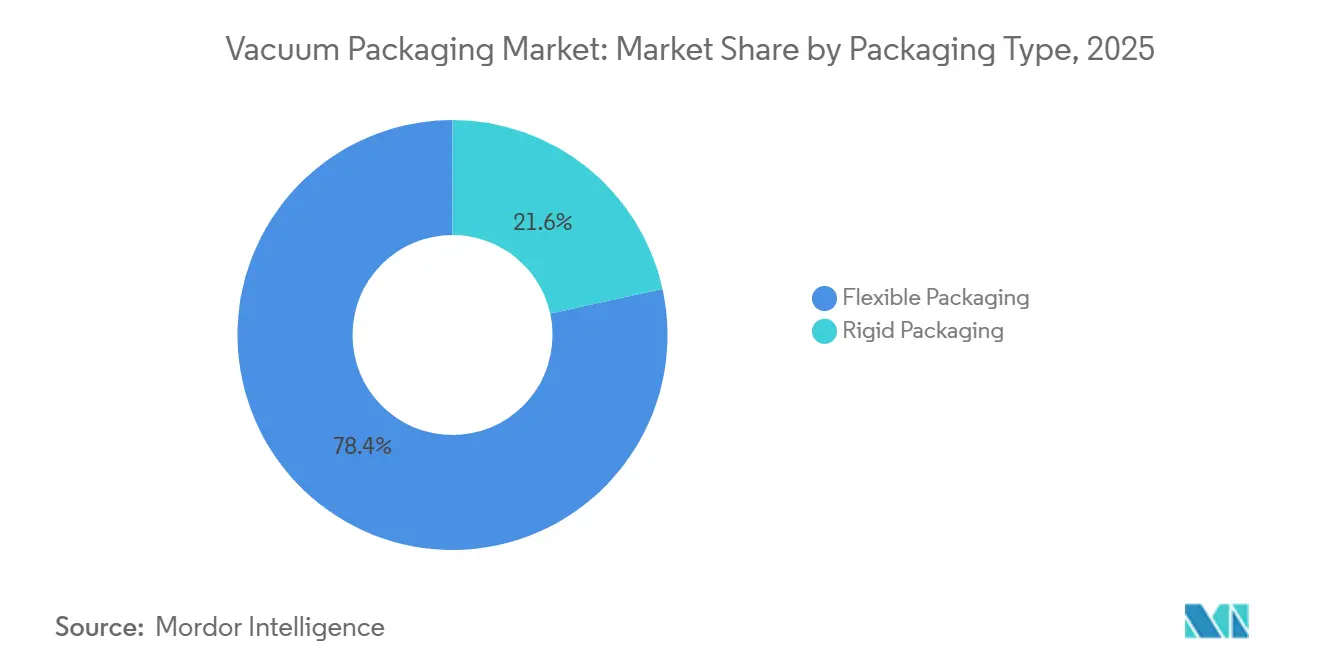
- By packaging type, flexible formats commanded 78.43% of 2025 revenue and are set to advance at the highest 4.23% CAGR through 2031.
- By material, polyethylene led with 38.53% share in 2025, while polyamide is forecast to register the top 4.54% CAGR to 2031.
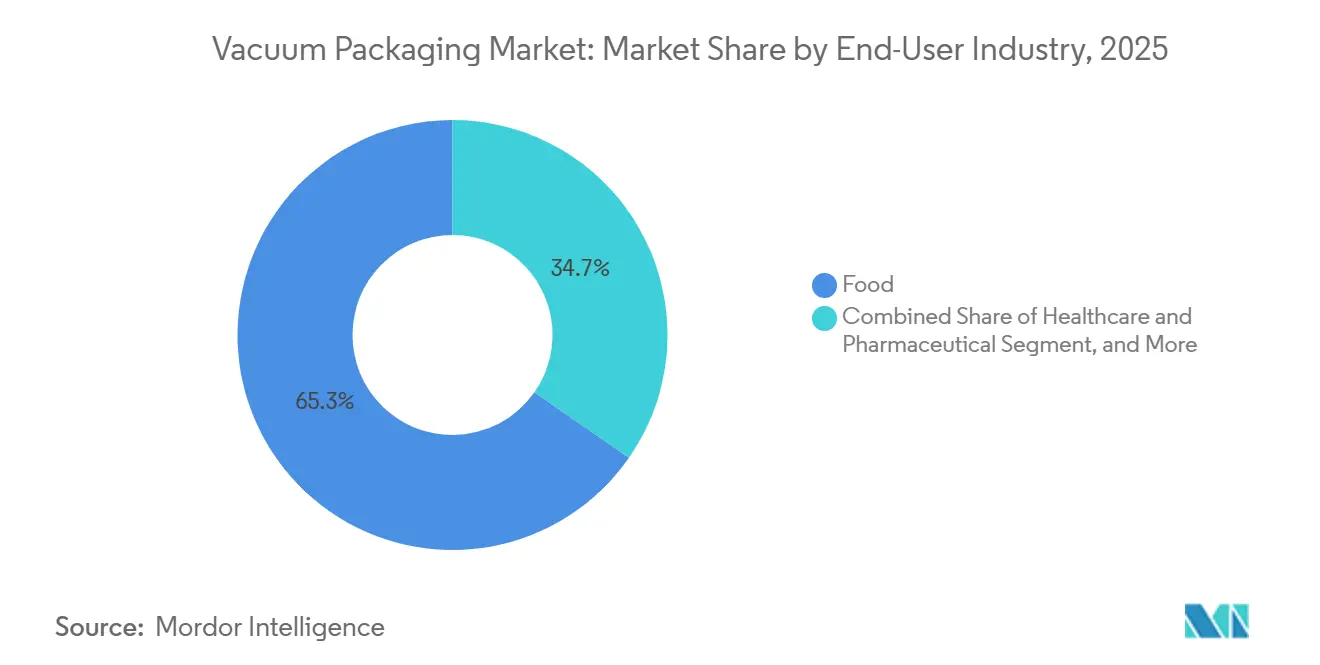
- By end-user industry, food applications held 65.32% of 2025 revenue, whereas healthcare and pharmaceuticals are projected to expand at a 5.12% CAGR through 2031.
- By machinery type, thermoformers accounted for 42.32% of the vacuum packaging market size in 2025 and are also the fastest-growing class with a 4.89% CAGR to 2031.
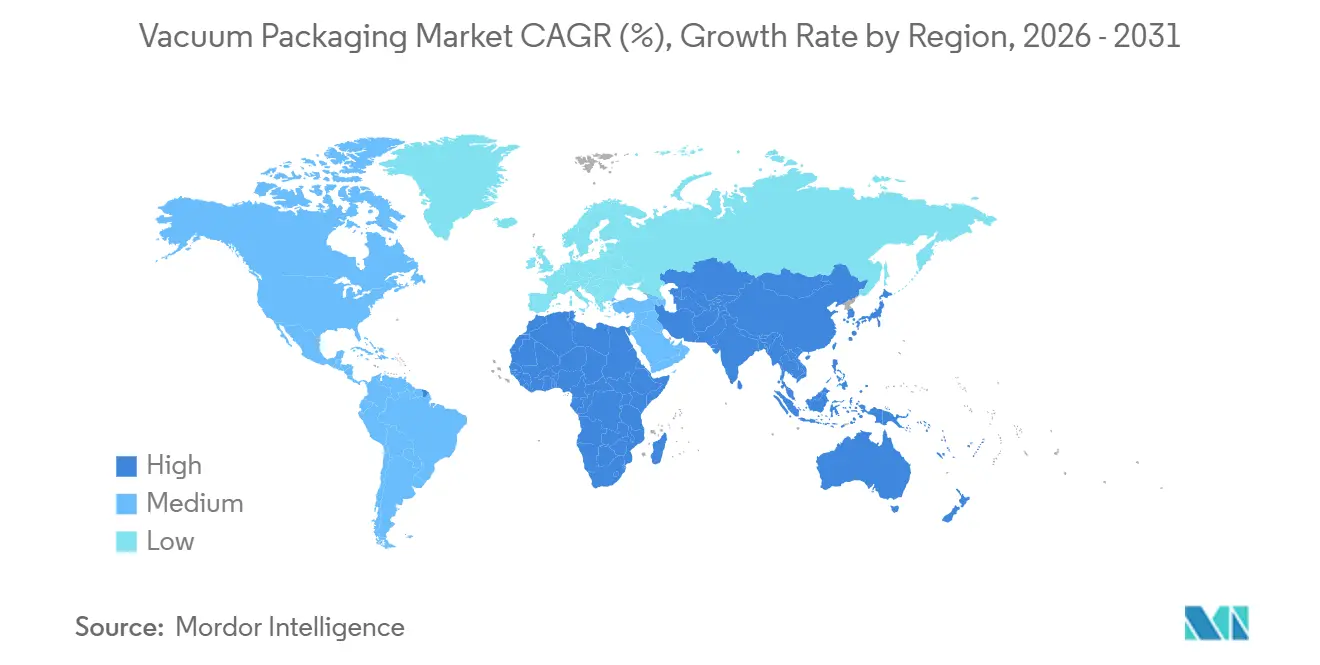
- By geography, Asia-Pacific generated 40.77% of 2025 revenue, while the Middle East and Africa region is poised for the quickest 5.22% CAGR through 2031.
Note: Market size and forecast figures in this report are generated using Mordor Intelligence’s proprietary estimation framework, updated with the latest available data and insights as of January 2026.
Global Vacuum Packaging Market Trends and Insights
Drivers Impact Analysis*
| Driver | (~) % Impact on CAGR Forecast | Geographic Relevance | Impact Timeline |
|---|---|---|---|
| Growing Demand for Packaged and Convenience Foods | +1.2% | Global, with peak intensity in North America and Asia-Pacific urban corridors | Medium term (2-4 years) |
| Increasing Focus on Food-Safety Compliance by Retailers | +0.9% | North America and Europe, cascading to South America and Middle East | Short term (≤ 2 years) |
| Rapid Expansion of E-Commerce Grocery Channels | +1.1% | Asia-Pacific core, accelerating in Middle East and Africa | Medium term (2-4 years) |
| Automation of High-Speed Thermoform Lines | +0.7% | Europe and North America manufacturing hubs, spreading to Mexico and Southeast Asia | Long term (≥ 4 years) |
| Integration of Smart Sensors for Real-Time Quality Checks | +0.5% | Europe and Japan early adopters, pilot projects in China and India | Long term (≥ 4 years) |
| Source: Mordor Intelligence | |||
Growing Demand for Packaged and Convenience Foods
Ready-to-eat meal volumes increased 18% year-over-year in 2025, as vacuum-sealed protein bowls and sous-vide entrées secured a broader presence on grocery shelves. Meal-kit firms doubled the order frequency over the same period, relying on portion-controlled pouches that maintain sensory quality for up to 10 days without freezing. Fulfillment centers now favor larger, consolidated shipments, trimming logistics cost per unit by roughly 13% yet exposing packs to more handling cycles that vacuum formats withstand. Nestlé has earmarked BRL 500 million (USD 95 million) to expand chilled-meal capacity in Brazil, targeting dual-income households, which were expected to surpass 60% penetration by 2025. Consumers are willing to accept a 20-25% price premium for grab-and-go convenience, supporting double-digit expansion in vacuum-packed offerings, even as food inflation moderated last year.
Increasing Focus on Food-Safety Compliance by Retailers
Regulators have zeroed in on Clostridium botulinum risk in low-acid, reduced-oxygen items. The UK Food Standards Agency now requires chilled vacuum packs marketed beyond 10 days to show a 6-log spore reduction or add hurdles such as pH below 5.0. [1]UK Food Standards Agency, “Vacuum Packing and Modified Atmosphere Packing,” food.gov.uk In the United States, USDA FSIS enforces hermetic standards under 9 CFR 318.300, while 21 CFR 113 covers thermal validation. [2]U.S. Department of Agriculture FSIS, “9 CFR 318.300,” ecfr.gov Retailers audit suppliers quarterly and delist non-conformers within 30 days, a move that favors converters owning microbiology labs and shelf-life chambers. As a result, tier-1 suppliers lengthen their lead over small regionals that lack capital for validation infrastructure.
Rapid Expansion of E-Commerce Grocery Channels
Online grocery captured 12% of food and beverage sales in developed economies in 2025, and vacuum formats dominate because they shed 15-20% of their weight versus rigid trays. The UAE market alone is projected to reach USD 43.98 billion by 2029, with e-commerce accounting for an 18% share by 2028. Al Ain Farms is constructing a 260,000-square-foot hub that integrates vacuum lines with 24-hour DTC delivery capability. Lightweight pouches increase order density in refrigerated vans, although reverse logistics hurdles persist because contaminated films bypass curbside recycling streams, prompting deposit pilots in Germany and the Netherlands.
Automation of High-Speed Thermoform Lines
Servo-driven tooling and adaptive sealing push throughput past 120 cycles per minute while holding reject rates below 0.5%. [3]MULTIVAC, “R 085 Thermoformer Press Release,” multivac.com Omron’s AI vision suite, launched in 2024, spots micro-leaks under 10 microns and logs process data for predictive analytics. Mexico’s Tetra Pak is investing MXN 1 billion (USD 58 million) to enlarge its Mexicali site by 60%, chasing nearshoring food processors that demand such automation. Although premium lines cost up to USD 3.5 million, lease-to-own and pay-per-pack models are emerging to spread payments over seven years.
Restraints Impact Analysis*
| Restraint | (~) % Impact on CAGR Forecast | Geographic Relevance | Impact Timeline |
|---|---|---|---|
| High Capital Cost of Industrial Vacuum Machinery | -0.8% | Global, acute in South America, Africa, and South Asia where financing access is constrained | Short term (≤ 2 years) |
| Environmental Concerns Over Multi-Layer Plastic Films | -0.6% | Europe and North America regulatory pressure, spreading to Asia-Pacific coastal cities | Medium term (2-4 years) |
| Regulatory Pressure on PVDC and Other Halogenated Barriers | -0.4% | Europe, California, Washington State; pilot restrictions in Canada and Australia | Medium term (2-4 years) |
| Limited Recycling Streams for Contaminated Flexible Films | -0.5% | Global, with infrastructure gaps most severe in Middle East, Africa, and Southeast Asia | Long term (≥ 4 years) |
| Source: Mordor Intelligence | |||
High Capital Cost of Industrial Vacuum Machinery
Entry-level chamber sealers start at around USD 15,000, while full thermoform-fill-seal lines exceed USD 3.5 million, a gap that small co-packers in South America and South Asia struggle to bridge. Financing in those regions carries premiums of 300-500 bps above developed-market rates, pushing payback beyond seven years. Development lenders, such as the IFC, injected EUR 65 million (USD 73 million) into a Brazilian converter in 2025; however, such programs reach less than 5% of eligible firms. Vendors are piloting pay-per-pack fees in India and Indonesia, yet uptake stays below 2% because processors fear long-term cost uncertainty.
Environmental Concerns over Multi-Layer Plastic Films
European Union rules require 65% of plastic packs to be recyclable by design by 2030. California bans per- and polyfluoroalkyl substances in food packs starting January 2028. Multi-layer films that blend polyethylene, polyamide, and EVOH achieve sub-1 cc/m²/day oxygen rates, yet cannot be recycled mechanically. Amcor’s 2025 patents on polyethylene-only nano-clay structures recover about 70% of EVOH performance but cost 18-25% more. Municipal facilities capable of washing food-soiled films remain scarce, meaning that most vacuum pouches still end up in landfills or incinerators.
*Our forecasts treat driver/restraint impacts as directional, not additive. The impact forecasts reflect baseline growth, mix effects, and variable interactions.
Segment Analysis
By Packaging Type: Flexible Formats Dominate Through Cost and Speed Advantages
Flexible variants accounted for 78.43% of the vacuum packaging market share in 2025 and are projected to grow at a 4.23% CAGR through 2031. They use up to 50% less resin than trays, resulting in freight savings of nearly USD 0.10 per kilogram on export routes and enabling better cube utilization in e-commerce totes. Schur Flexibles launched a recyclable polyethylene mono-material pouch in 2025 that preserves sliced deli meats for 21 days while complying with Extended Producer Responsibility rules. Rigid trays kept a 21.57% share but grew only 2.8% as higher tooling costs hindered SKU proliferation. Klöckner Pentaplast’s PET tray with built-in scavengers now extends the color life of red meat to 18 days; however, adoption is concentrated in premium private labels willing to pass a 15% price increase to shoppers.
E-commerce accentuates the benefits of flexible packs, which stack 30% more units per refrigerated tote than trays, resulting in lower last-mile costs and fewer breakages. Coveris reported 22% growth in flexible solutions for meal kits in 2025, whereas rigid equivalents slipped 3%, underscoring channel preference. ISO 18601 assigns higher recyclability scores to mono-material flexible films than to multi-substrate trays, encouraging brand owners to opt for pouches. Foodservice remains the last stronghold for rigid trays because they endure high-heat reheating, a niche representing under 10% of vacuum packaging market size.


By Material: Polyethylene Leads, but Polyamide Gains on Barrier Performance
Polyethylene represented 38.53% of the market share in 2025, driven by its low cost, broad sealing window, and installed extrusion base. Polypropylene is suitable for hot-fill and retort duty, while niche oxygen-barrier jobs rely on EVOH and polyamide. Polyamide logs the quickest 4.54% CAGR through 2031, as its oxygen barrier is up to seven times tighter than polyethylene, making it essential for cured meats and lyophilized drugs.
Dow’s 2025 INNATE TF resin family aims to dethrone polyamide by achieving 15 cc/m²/day oxygen rates without lamination; however, uptake currently sits at around 5% due to 12-15% price premiums. Borealis’ Borstar line enhances puncture resistance, enabling converters to reduce film gauge by approximately 12%, resulting in a savings of USD 0.02 per pack. Healthcare customers underpin polyamide’s rise because ISO 11607 validation counts on its toughness during 134 °C sterilization.
By End-User Industry: Food Dominates, Healthcare Accelerates
Food applications accounted for 65.32% of the 2025 demand, encompassing fresh proteins, dairy, bakery, and ready meals. The vacuum packaging market size for food products continues to expand as retailers pursue shrink reduction targets and consumers prioritize freshness. Nevertheless, healthcare is projected to post the steepest 5.12% CAGR to 2031. Sterile-device packs now incorporate inline leak monitoring, and Wipak’s pharmaceutical laminates experienced 16% annual growth in 2025, as gene therapies require near-zero moisture ingress.
Industrial goods hold about a 12% share, protecting electronics and metal parts from corrosion during transit, whereas consumer compression bags for textiles control roughly 8% but face margin squeeze from platform fee pressure. Regulatory mandates such as FDA 21 CFR 120 for juice and Argentina’s Resolution 84/2018 for chilled beef keep food firmly in the lead. Yet an aging population boosts surgical procedure volumes 2-3% annually, ensuring healthcare’s sustained expansion.

By Machinery Type: Thermoformers Lead Automation Wave
Thermoformers accounted for 42.32% of the vacuum packaging market size in 2025, outpacing other equipment classes at a 4.89% CAGR, as they combine forming, filling, sealing, trimming, and labeling in one pass. MULTIVAC’s R 085 model reduces changeover to under 20 minutes and cuts rejects below 0.5%.
Chamber sealers, prized by artisans, hold a 28% share, while nozzle sealers and rotary systems split the remainder. Ulma’s TFS 700 achieves 180 packs per minute and extends deli-meat shelf life from 28 days to 42 days, reducing retailer spoilage by an estimated 20%. Safety directives, such as the EU Machinery Directive 2006/42/EC, raise baseline equipment prices but also open up opportunities for retrofitting. Increasing demand for sustainable packaging solutions is further driving innovation in sealing technologies.
Geography Analysis
Asia-Pacific generated 40.77% of global revenue in 2025, fueled by China’s 4.8 million-ton vacuum-packed meat exports and India’s cold-chain build-out. Japan mandates real-time GMP monitoring in pharma packs, driving adoption of data-logging thermoformers. South Korea’s convenience stores enlarged vacuum-meal offerings by 18% as single-person households topped 30% of dwellings. Australia’s processors invested AUD 120 million (USD 78 million) in barrier lines to serve premium exports to the Middle East and North America.
The Middle East and Africa are the fastest risers, with a 5.22% CAGR through 2031. The UAE’s Food Security Strategy 2050 requires a ten-day protein reserve, prompting supermarkets to vacuum-pack chilled produce, which now occupies 22% of their fridge space. Saudi Arabia allocated SAR 8 billion (USD 2.1 billion) to food-processing infrastructure between 2024 and 2026. South Africa’s top three grocers, which control 68% of the trade, have mandated vacuum packs for private-label meats to reduce shrinkage.
North America and Europe together accounted for 45% of 2025 sales, but grew modestly at 3.2% and 2.9%, respectively. FDA 21 CFR 113 compliance adds up to USD 80,000 per SKU, while Germany’s 2024 packaging law imposes EUR 0.52 per kilogram EPR fees on non-recyclable laminates. Canada’s pending single-use plastics rules cloud investment timing. South America advances at 4.1% as nearshoring and IFC-backed capital inject capacity. Tetra Pak’s Mexicali upgrade expands thermoform output 60% for North American nearshoring programs.

Competitive Landscape
Amcor, Sealed Air, Mondi, Winpak, and Coveris lead as the top five suppliers, trailed by numerous regional specialists. Amcor filed 12 mono-material patents in 2025 and is investing USD 180 million in a Belgian expansion that increases capacity by 40% for fresh-protein packs. Sealed Air bought Liquibox for USD 1.15 billion to add aseptic pouches that complement its Cryovac line.
Mondi and Borealis co-invested EUR 12 million (USD 13.4 million) to debut a 30% PCR content polyethylene barrier film. Winpak’s USD 95 million Georgia plant produces 120 million vacuum trays annually, incorporating oxygen scavengers for extended red-meat displays. Regional converters gain market share through faster turnarounds and co-packing services for meal-kit start-ups, which doubled their volumes from 2024 to 2025.
Technology differentiators include ProAmpac’s machine-learning seal-bar monitoring, which cut downtime 19% at eight U.S. sites. The interplay of sustainability compliance costs and price pressure is triggering consolidation, with three notable mergers in 2025 and more expected as private equity targets sub-scale thermoformers.
Vacuum Packaging Industry Leaders
Sealed Air Corporation
Coveris Holdings S.A.
Amcor plc
Winpak Ltd.
Coveris Holdings SA
- *Disclaimer: Major Players sorted in no particular order

Recent Industry Developments
- December 2025: Amcor announced a USD 180 million expansion of its Ghent, Belgium flexible-packaging site, adding three high-speed thermoform lines scheduled for Q3 2027 completion.
- October 2025: Sealed Air completed the USD 1.15 billion acquisition of Liquibox, broadening aseptic pouch capability.
- September 2025: Mondi partnered with Borealis on a EUR 12 million (USD 13.4 million) pilot to commercialize a 30% PCR polyethylene barrier film.
- July 2025: Winpak opened a USD 95 million thermoform-extrusion complex in Senoia, Georgia, capable of 120 million vacuum trays annually.


Global Vacuum Packaging Market Report Scope
Vacuum packaging involves removing air from a package before sealing. The primary goal is to eliminate oxygen, ensuring the packaging material closely hugs the product. Additionally, vacuum packaging reduces volume and enhances the rigidity of flexible packages.
The Vacuum Packaging Market Report is Segmented by Packaging Type (Flexible Packaging, and Rigid Packaging), Material (Polyethylene, Polyamide, Polypropylene, and Other Materials), End-User Industry (Food, Healthcare and Pharmaceutical, Industrial Goods, and Other End -user Industries), Machinery Type (Thermoformers, Chamber Vacuum Sealers, External/ Edge Vacuum Sealers, and Other Machinery Types), and Geography (North America, South America, Europe, Asia-Pacific, AND Middle East and Africa). The Market Forecasts are Provided in Terms of Value (USD).
| Flexible Packaging |
| Rigid Packaging |
| Polyethylene (PE) |
| Polyamide (PA) |
| Polypropylene (PP) |
| Other Materials |
| Food |
| Healthcare and Pharmaceutical |
| Industrial Goods |
| Other End -user Industries |
| Thermoformers |
| Chamber Vacuum Sealers |
| External / Edge Vacuum Sealers |
| Other Machinery Types |
| North America | United States | |
| Canada | ||
| Mexico | ||
| South America | Brazil | |
| Argentina | ||
| Rest of South America | ||
| Europe | Germany | |
| United Kingdom | ||
| France | ||
| Italy | ||
| Spain | ||
| Rest of Europe | ||
| Asia-Pacific | China | |
| Japan | ||
| India | ||
| South Korea | ||
| Australia | ||
| Rest of Asia-Pacific | ||
| Middle East and Africa | Middle East | Saudi Arabia |
| United Arab Emirates | ||
| Turkey | ||
| Rest of Middle East | ||
| Africa | South Africa | |
| Egypt | ||
| Nigeria | ||
| Rest of Africa | ||
| By Packaging Type | Flexible Packaging | ||
| Rigid Packaging | |||
| By Material | Polyethylene (PE) | ||
| Polyamide (PA) | |||
| Polypropylene (PP) | |||
| Other Materials | |||
| By End-User Industry | Food | ||
| Healthcare and Pharmaceutical | |||
| Industrial Goods | |||
| Other End -user Industries | |||
| By Machinery Type | Thermoformers | ||
| Chamber Vacuum Sealers | |||
| External / Edge Vacuum Sealers | |||
| Other Machinery Types | |||
| By Geography | North America | United States | |
| Canada | |||
| Mexico | |||
| South America | Brazil | ||
| Argentina | |||
| Rest of South America | |||
| Europe | Germany | ||
| United Kingdom | |||
| France | |||
| Italy | |||
| Spain | |||
| Rest of Europe | |||
| Asia-Pacific | China | ||
| Japan | |||
| India | |||
| South Korea | |||
| Australia | |||
| Rest of Asia-Pacific | |||
| Middle East and Africa | Middle East | Saudi Arabia | |
| United Arab Emirates | |||
| Turkey | |||
| Rest of Middle East | |||
| Africa | South Africa | ||
| Egypt | |||
| Nigeria | |||
| Rest of Africa | |||


Key Questions Answered in the Report
How large is the vacuum packaging market in 2026?
The vacuum packaging market size reached USD 31.14 billion in 2026 and is forecast to grow steadily at a 3.72% CAGR to 2031.
Which packaging format leads in global revenue?
Flexible pouches and bags command 78.43% of 2025 revenue due to lower material use and faster line speeds.
What material is gaining share fastest?
Polyamide posts the highest material CAGR at 4.54% through 2031 owing to superior oxygen-barrier performance.
Which region is expanding quickest?
The Middle East and Africa shows the fastest regional CAGR at 5.22%, driven by food-security programs and retail modernization.
What is the outlook for healthcare applications?
Healthcare and pharmaceutical demand is advancing at a 5.12% CAGR as ISO 11607 enforcement strengthens sterile-barrier requirements.
Page last updated on:






