Digital Watermarks And Advanced Sorting-ID For Packaging Market Size and Share
Market Overview
| Study Period | 2019 - 2030 |
|---|---|
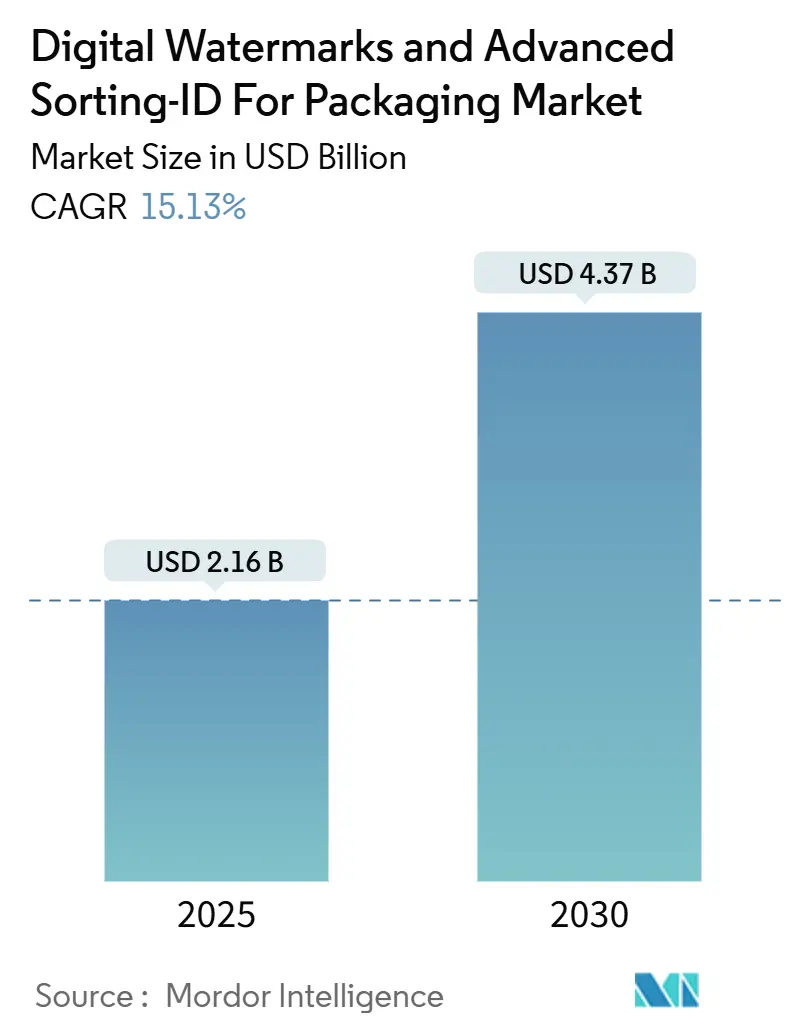
| Market Size (2025) | USD 2.16 Billion |
| Market Size (2030) | USD 4.37 Billion |
| Growth Rate (2025 - 2030) | 15.13% CAGR |
| Fastest Growing Market | Asia Pacific |
| Largest Market | Europe |
| Market Concentration | Medium |
Major Players *Disclaimer: Major Players sorted in no particular order Image © Mordor Intelligence. Reuse requires attribution under CC BY 4.0. | |
Digital Watermarks And Advanced Sorting-ID For Packaging Market Analysis by Mordor Intelligence
The digital watermarks and advanced sorting-ID for the packaging market size stand at USD 2.16 billion in 2025 and are forecast to reach USD 4.37 billion by 2030, reflecting a 15.13% CAGR across the period. Momentum is building as the European Union’s Packaging and Packaging Waste Regulation moves toward the 2027 deadline for digital product passports, while HolyGrail 2.0 industrial trials have achieved 95% sorting accuracy, reassuring converters about payback timelines. North American recycled-content incentives and falling hyperspectral camera prices further expand the addressable base, and brands reap new consumer-engagement benefits from GS1 Digital Link that complement compliance use cases. Competitive dynamics remain moderately fragmented: equipment majors such as TOMRA Systems and Pellenc ST offer turnkey retrofit packages, while Digimarc and other identification specialists drive software innovation. Capital spending needs of USD 2-5 million per material recovery facility amplify consolidation among well-funded players, yet successful pilots show payback in under two years.
Key Report Takeaways
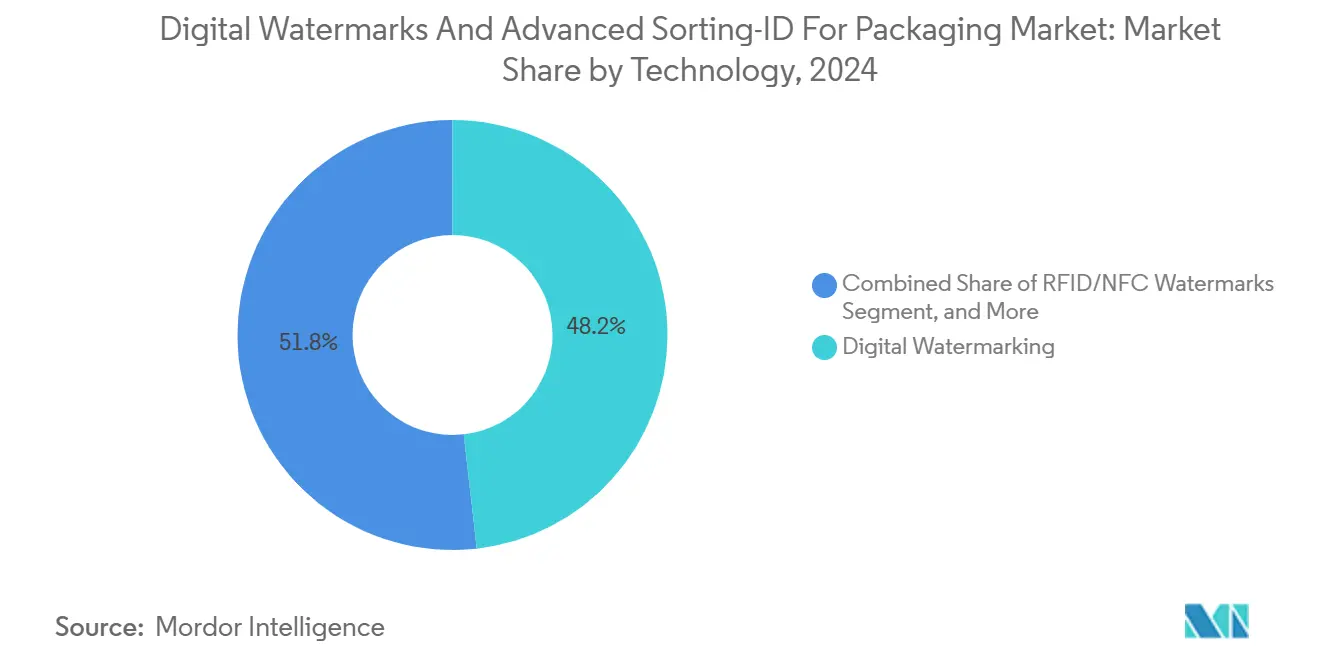
- By technology, digital watermarking captured 48.21% of the digital watermarks and advanced sorting-ID for packaging market share in 2024.
- By material, digital watermarks and advanced sorting-ID for packaging market size for plastic is projected to grow at 15.78% CAGR between 2025–2030.
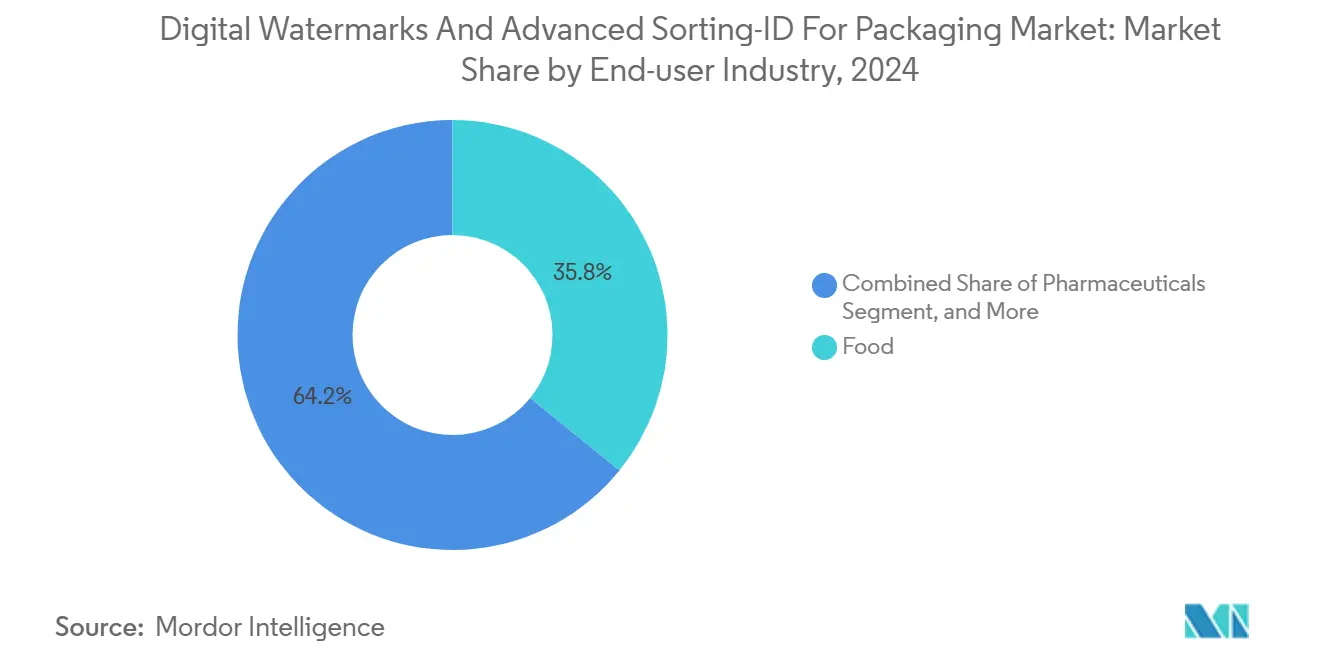
- By end-user, food packaging captured 35.83% of the digital watermarks and advanced sorting-ID for packaging market share in 2024.
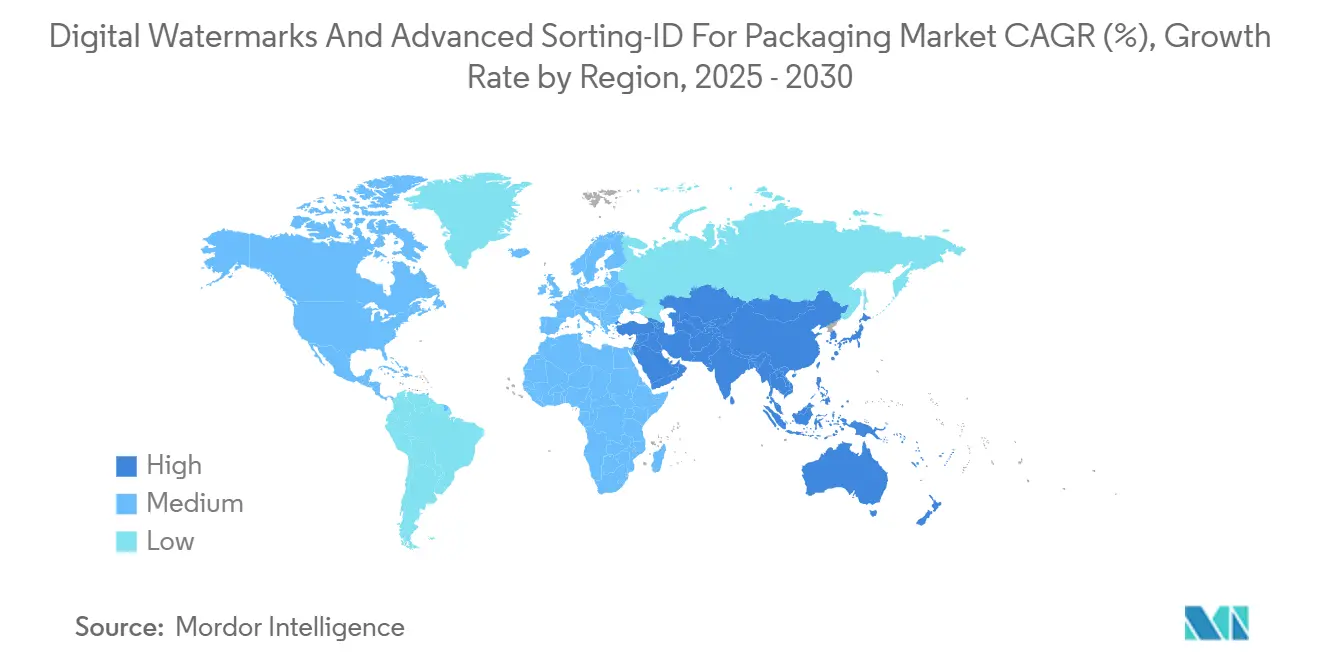
- By geography, digital watermarks and advanced sorting-ID for packaging market size for Asia-Pacific is projected to grow at 16.25% CAGR between 2025–2030.
Global Digital Watermarks And Advanced Sorting-ID For Packaging Market Trends and Insights
Drivers Impact Analysis*
| Driver | (~) % Impact on CAGR Forecast | Geographic Relevance | Impact Timeline |
|---|---|---|---|
| EU Packaging Waste Regulation Compliance | +3.2% | Europe, with spillover to the UK and North America | Medium term (2-4 years) |
| Holygrail 2.0 Validation Momentum | +2.8% | Global, with early adoption in Europe and North America | Short term (≤ 2 years) |
| U.S. Recycled-Content Tax Incentives | +2.1% | North America, with an influence on multinational operations | Medium term (2-4 years) |
| GS1 Digital Link-Enabled Engagement | +1.9% | Global, with faster adoption in developed markets | Long term (≥ 4 years) |
| Falling Cost of Hyperspectral Cameras | +1.7% | Global, with particular impact in APAC and emerging markets | Short term (≤ 2 years) |
| Counterfeit Surge in APAC Cosmetics and Pharma | +2.4% | APAC core, with spillover to MEA and Latin America | Medium term (2-4 years) |
| Source: Mordor Intelligence | |||
EU Packaging Waste Regulation Compliance
The European Union’s revised Packaging and Packaging Waste Regulation obliges every package sold in the bloc to carry a digital product passport by 2027, and the rule specifically references ISO/IEC 15459 unique identifiers that align with GS1 watermarking protocols. Multinationals are therefore standardizing global packaging lines around the strictest requirement to avoid line-side complexity, which brings earlier-than-expected volume commitments for technology vendors. Extended producer responsibility targets across 27 member states translate the regulation into direct fees, so producers now link compliance cost savings with investment in digital identification. Line retrofit activity is most visible in Germany and France, where municipal deposit and recycling systems already integrate digital triggers that speed throughput. As the 2027 deadline approaches, procurement cycles have accelerated, and converters that delayed pilots in 2023 are now issuing full-scale tenders to safeguard supply contracts.
Holygrail 2.0 Validation Momentum
Phase 3 trials under HolyGrail 2.0 proved that watermark detection remains accurate at conveyor speeds exceeding 3 m/s across fifteen European facilities, erasing skepticism about contamination and material scuffing.[1]HolyGrail 2.0, “Digital Watermarks for Enhanced Recycling,” holygrail2.org Consumer-goods leaders such as Unilever, Nestlé, and PepsiCo participated, so proof translates directly into annual operating plans and vendor frameworks. Sorting-equipment OEMs have baked HolyGrail specifications into their 2025 product roadmaps, lowering the integration risk that previously slowed purchase orders. Equity research now models watermark-ready lines as the industry baseline, a shift reflected in containerboard converters adding invisible codes to private-label designs. The European success has triggered sister pilots in the United States and Japan, which compresses the learning curve and ensures parameter alignment that will feed global standardization efforts.
U.S. Recycled-Content Tax Incentives
The Accelerating a Circular Economy for Plastics and Recycling Innovation Act (H.R. 9676) proposes a federal tax credit for packaging that proves recycled content through EPA-endorsed chain-of-custody documentation. Digital watermarking provides an immutable identity at the unit level, making it one of the few viable tools for mass balance compliance. Because the bill sets a 30% recycled-content target by 2030, resin suppliers and converters are lobbying for early certification, which would push volume commitments into the current capital budgeting cycle. California and New York precedents demonstrate that once one coastal state adopts a policy, national retailers are likely to follow suit, requiring universal labeling, which can be recouped through speed-to-shelf advantages. Technology vendors already see upticks in trial orders from South American copackers that export into the United States markets and wish to avoid future non-compliance penalties.
Counterfeit Surge in APAC Cosmetics and Pharma
OECD data indicate that counterfeit goods account for 2.5% of world trade, and the Asia-Pacific region bears a disproportionate share in the beauty and pharmaceutical categories, thereby raising direct patient-safety and brand-equity risks. Digital watermarking embeds covert markers that are invisible to handheld cameras, yet easy to read by calibrated scanners on distribution docks, allowing brand owners to verify lineage without altering pack aesthetics. Since most counterfeit trade flows through e-commerce, brands appreciate a verification layer that can run at parcel sorting centers before the last-mile handoff. Regional regulators, from Singapore’s Health Sciences Authority to India’s CDSCO, are drafting mutual-recognition rules that mention digital triggers, which will ease cross-border enforcement. Beauty conglomerates now pair watermarks with QR codes to merge authentication and marketing, resulting in a 60% reduction in manual inspection costs during 2024 pilots.
Restraints Impact Analysis*
| Restraint | (~) % Impact on CAGR Forecast | Geographic Relevance | Impact Timeline |
|---|---|---|---|
| High Retrofit CAPEX for MRFs | -2.8% | Global, with impact in emerging markets | Short term (≤ 2 years) |
| Fragmented Global Standards | -1.9% | Global, with varying impact by region | Long term (≥ 4 years) |
| Consumer-Data-Privacy Concerns | -1.4% | Europe and North America primarily | Medium term (2-4 years) |
| Ink-Substrate Compatibility Issues | -1.2% | Global, with emphasis on flexible packaging applications | Short term (≤ 2 years) |
| Source: Mordor Intelligence | |||
High Retrofit CAPEX for Material Recovery Facilities (MRFs)
Material recovery facilities (MRFs) often need USD 2-5 million to integrate watermark readers, robotics, and hyperspectral cameras, amounts that many midsize operators cannot finance without loan guarantees. Institutional lenders still treat waste-sorting assets as volatile cash-flow businesses, which inflates interest rates and stretches breakeven horizons. Emerging-market operators face currency-convertibility constraints that elevate the costs of imported equipment, so deployments tend to cluster around capital-city regions with higher gate fees. Engineering complexity incurs additional costs: redesigning conveyor layouts, upgrading electrical systems, and retraining staff can extend downtime by six weeks, a margin that many plants cannot afford. Although payback periods have fallen below two years in high-throughput plants, the up-front burden keeps retrofit pipelines lumpy and could slow market volume in price-sensitive regions until leasing models gain traction.
Fragmented Global Standards
While GS1 offers a common structure, regional regulators customize technical parameters, which forces global brands to juggle divergent code densities, color tolerances, and data constructs. Asia-Pacific pilots sometimes favor ISO/IEC 20248 digital signatures, whereas European protocols default to ISO/IEC 15459 identifiers, which can add line-change costs for exporters. Equipment OEMs must write region-specific firmware, which curbs economies of scale and elongates release cycles. Standard-setting bodies promise convergence, but timelines hinge on national stakeholder consensus, a process that regularly extends beyond initial roadmaps. Small brands without dedicated regulatory affairs teams struggle to stay current, and the resulting uncertainty forces some to postpone capital commitments despite evident cost-saving opportunities.
*Our forecasts treat driver/restraint impacts as directional, not additive. The impact forecasts reflect baseline growth, mix effects, and variable interactions.
Segment Analysis
By Technology: Digital Watermarking Leads Innovation
Digital watermarking contributed 48.21% to the digital watermarks and advanced sorting-ID for packaging market share in 2024 and remains the backbone of industrial deployments thanks to invisible coding that survives washing, scuffing, and color shifts. Systems integrators now embed readers that pick up both near-infrared and visible-spectrum signals in a single pass, streamlining retrofits. Hybrid modes combining watermarks and GS1 Digital Link QR codes deliver dual functionality: covert machine readability for recovery facilities plus open consumer engagement at the point of sale. Equipment upgrades align with HolyGrail settings, so OEMs ship pre-calibrated optics that detect multiple dots per second without operator input, which cuts commissioning time by half. Code density optimization means minimal ink load, so brand identity graphics stay clear, helping marketing teams green-light the switch.
RFID/NFC-integrated watermark lines are growing at a 17.84% CAGR as converters bundle passive chips into molded markers that remain invisible but unlock item-level traceability and deter theft. Early adopters include luxury cosmetics in South Korea, where store POS stations already contain NFC-enabled consumer apps. QR codes still surface where brands prioritize mobile-marketing cost efficiency, although their overt nature limits high-value authentication. Spectral markers serve niche hazardous materials where global transport rules prefer non-internet-connected verification. Over the period, the convergence of multi-modal systems will dominate technology roadmaps, ensuring interoperability while supplying fallback layers that futureproof against potential standard revisions.


By Material Type: Plastic Dominance Drives Growth
Plastic substrates accounted for 38.57% of 2024 revenue and drove the digital watermarks and advanced sorting-ID for the packaging market size at a 15.78% CAGR, as converters pursue chemically recycled resin credits. PET leads because bottle-grade facilities already operate deposit loops and require granular purity data, while HDPE and PP applications are expanding in food-grade crates and pouches that must document recycled content. Watermark ink chemistry now withstands caustic bath temperatures, preserving detection fidelity during label removal. For multilayer flexible pouches, vendors supply primer layers that seal markers away from aggressive solvents, an advance that unlocked a swath of snack and personal-care segments in 2024.
Paper and board usage is limited by pulping processes that dilute optical contrast. However, specialty beverage cups and folding cartons utilize early digital watermarking for fiber-grade separation. Glass containers primarily rely on color sorting for this purpose. Still, premium spirits employ covert markers to deter refill fraud. Metal cans utilize watermarks on colored lacquers to mitigate the extended producer responsibility fee, although the scale remains limited. Each substrate category now follows a modular ink-formulation guide that harmonizes pigment load with recycling chemistry, a template developed under the HolyGrail ink taskforce, which should shorten approval cycles in 2026 and beyond.
By End-user Industry: Pharmaceuticals Accelerate Authentication
The pharmaceutical channel is projected to post the fastest 17.54% CAGR as serialization laws converge on unit-dose verification. Digital watermarking provides a covert layer that doctors and customs officers can use to authenticate without exposing proprietary coding schemes, augmenting existing GTIN and serial number barcodes. Traceability from filler to pharmacy improves recall accuracy and supports emerging drug take-back programs that rely on code-triggered reverse logistics. Over-the-counter drugs and nutraceuticals, which are high-risk targets for e-commerce fraud, are now being piloted for watermarking to achieve real-time supply-chain visibility ahead of rumored regional mandates.
Food packaging continues to account for 35.83% of the market revenue, owing to high consumption volumes and established FSMA-aligned traceability systems. Retailers leverage watermarks to automate date-code compliance and amplify shopper-facing sustainability messages through smartphone scans. Beverage brands value the production-line throughput benefits because high-speed fillers can embed marks without slowing down. Personal-care labels utilize invisible codes to engage consumers in skincare routines and collect zero-party data. Electronics and industrial chemicals represent niche but rising adopters where hazardous-material compliance and warranty validation complement brand protection
Geography Analysis
Europe retained a 35.27% revenue share in 2024, driven by early legislative clarity, well-funded deposit-return systems, and cross-border retailer coalitions that pre-specify watermark compliance in private-label procurement. Germany’s Duales System rebuild has already installed near-infrared readers at twenty material recovery facilities, while France’s Citeo grants offset initial retrofit loans. Scandinavian councils mandate digital identification on municipal collection trials that inform national packaging taxes.[2]OECD, “Trends in Trade in Counterfeit and Pirated Goods,” oecd-ilibrary.org The United Kingdom, despite post-Brexit divergence, largely mirrors most EU rules to ease continental supply, and its WRAP circularity roadmap funds pilot grants that cover up to 30% of the reader's costs.
The Asia-Pacific region is expected to deliver the fastest growth, with a 16.25% CAGR, driven by concerns over counterfeiting and a national push for a circular economy. China’s 2025 plastic-waste ban spurs domestic resin producers to co-invest in watermark-ready chemical recycling plants, while Japan’s Plastic Resource Circulation Act cross-references digital identification as an acceptable disclosure pathway. South Korean e-commerce majors integrate Digimarc SDKs into fulfillment center scanners to detect counterfeit cosmetics, and Australia’s packaging covenant update recommends incorporating QR or watermark layers for recyclability logos, facilitating a smoother transition away from static print labels. Southeast Asian exporters adopt watermarks to comply with European importers’ stringent audit trails, making ASEAN the next frontier for vendor expansion.
North America benefits from robust consumer-goods supply chains and a surge in state-level recycled-content laws. California’s SB 343 officially recognized digital evidence for recyclability claims in 2024, thus prompting brand owners to field-test watermark lines in Illinois and Texas hubs before nationwide rollout. Canadian beverage deposit networks launch watermark pilot schemes in British Columbia to tame PET contamination, and Mexico’s maquiladora corridor retrofits lines to secure U.S. import contracts post-USMCA environmental addendum.

Competitive Landscape
The marketplace stays moderately fragmented, with no single firm topping 15% revenue. Digimarc maintains a leadership position through its patent depth and retail partnerships, which embed its digital watermarks throughout private-label portfolios. Meanwhile, TOMRA Systems and Pellenc ST dominate the hardware market by coupling optical sorters with service contracts that guarantee uptime. Midsize OEMs differentiate by offering open-API firmware that customers plug into existing MES systems, an approach that resonates with cost-conscious recyclers. Software startups provide cloud dashboards that map code scans to life-cycle analytics, a value-added feature as ESG reporting becomes more stringent.
Partnerships surged in 2024: TOMRA signed an alliance with a leading European flexo-plate maker to preload watermark screens into print workflows, and Digimarc expanded its retailer network to include more than 30,000 store formats worldwide.[3]Digimarc Corporation, “Digital Watermarking Solutions,” digimarc.com Equipment integrators court chemical-recycler consortia to guarantee bale off-take, assuring MRFs of demand and smoothing return-on-investment math. Technology roadmaps now feature AI-driven signal processing that boosts detection accuracy above 99.5% on noisy belts, reducing manual quality-control labor hours by half.
Competitive factors hinge on standards compliance and total-solution capability. Vendors with GS1 accreditation and ISO/IEC alignment win multinational RFPs, while regional specialists chase localized counterfeit-prevention sub-segments. Barriers to entry include patent fortification on watermark embedding algorithms and the installed base of proprietary reader optics. Customer-switching costs remain moderate, yet data-platform lock-in may rise as brands analyze decades of scan events for consumer insights. The market could witness targeted M&A as equipment makers absorb software outfits to sharpen recurring-revenue profiles.
Digital Watermarks And Advanced Sorting-ID For Packaging Industry Leaders
Digimarc Corporation
TOMRA Systems ASA
Pellenc ST
Steinert GmbH
Bühler AG
- *Disclaimer: Major Players sorted in no particular order


Recent Industry Developments
- August 2025: HolyGrail 2.0 announced plans for an open, intelligent sorting ecosystem, leveraging GS1 standards and cloud-based architecture to enable the deployment of digital watermark-enabled recycling systems across Europe.
- April 2025: HolyGrail 2.0 Initiative achieved a major milestone by validating digital watermark technology for accurate sorting of rigid household packaging waste at industrial scale in Germany, with detection rates exceeding 90% across PET, PP, and PE fractions.
- January 2025: Digimarc Corporation launched Digimarc Validate mobile app, enabling field agents and brand owners to authenticate products quickly and combat counterfeiting using digital watermark technology.
- December 2024: GS1 UK published guidance on digital product passports for construction and metals industries, extending unique identifiers beyond consumer packaging.


Global Digital Watermarks And Advanced Sorting-ID For Packaging Market Report Scope
| Digital Watermarking |
| QR Code |
| RFID/NFC-integrated Watermarks |
| Spectral (UV/IR) Markers |
| Plastic | PET |
| HDPE | |
| LDPE / PP | |
| Paper and Paperboard | |
| Glass | |
| Metal | |
| Other Material Types |
| Food |
| Beverages |
| Pharmaceuticals |
| Consumer Electronics |
| Personal Care and Cosmetics |
| Industrial and Chemical |
| Other End-user Industries |
| North America | United States | |
| Canada | ||
| Mexico | ||
| South America | Brazil | |
| Argentina | ||
| Chile | ||
| Rest of South America | ||
| Europe | United Kingdom | |
| Germany | ||
| France | ||
| Italy | ||
| Spain | ||
| Russia | ||
| Rest of Europe | ||
| Asia-Pacific | China | |
| India | ||
| Japan | ||
| South Korea | ||
| Australia | ||
| Rest of Asia-Pacific | ||
| Middle East and Africa | Middle East | Saudi Arabia |
| United Arab Emirates | ||
| Turkey | ||
| Rest of Middle East | ||
| Africa | South Africa | |
| Nigeria | ||
| Rest of Africa | ||
| By Technology | Digital Watermarking | ||
| QR Code | |||
| RFID/NFC-integrated Watermarks | |||
| Spectral (UV/IR) Markers | |||
| By Material Type | Plastic | PET | |
| HDPE | |||
| LDPE / PP | |||
| Paper and Paperboard | |||
| Glass | |||
| Metal | |||
| Other Material Types | |||
| By End-user Industry | Food | ||
| Beverages | |||
| Pharmaceuticals | |||
| Consumer Electronics | |||
| Personal Care and Cosmetics | |||
| Industrial and Chemical | |||
| Other End-user Industries | |||
| By Geography | North America | United States | |
| Canada | |||
| Mexico | |||
| South America | Brazil | ||
| Argentina | |||
| Chile | |||
| Rest of South America | |||
| Europe | United Kingdom | ||
| Germany | |||
| France | |||
| Italy | |||
| Spain | |||
| Russia | |||
| Rest of Europe | |||
| Asia-Pacific | China | ||
| India | |||
| Japan | |||
| South Korea | |||
| Australia | |||
| Rest of Asia-Pacific | |||
| Middle East and Africa | Middle East | Saudi Arabia | |
| United Arab Emirates | |||
| Turkey | |||
| Rest of Middle East | |||
| Africa | South Africa | ||
| Nigeria | |||
| Rest of Africa | |||


Key Questions Answered in the Report
What growth rate forecast for digital watermark solutions through 2030?
The digital watermarks and advanced sorting-ID for the packaging market are projected to expand at a 15.13% CAGR between 2025 and 2030.
Which region leads the current adoption of watermark-enabled packaging?
Europe holds 35.27% of 2024 revenue regulatory clarity and extended producer responsibility incentives.
Why is pharmaceutical packaging seeing rapid uptake?
Serialization mandates and anti-counterfeiting pressures push the pharmaceutical segment to a 17.54% CAGR, the fastest among end-user groups.
How do hyperspectral cameras influence project economics?
A 40% drop in camera prices since 2022 shortens payback to under 18 months at high-throughput recovery facilities, easing adoption barriers.
What is the main barrier for smaller material recovery facilities?
Retrofit costs of USD 2-5 million per plant make financing difficult for operators without access to low-interest capital or government grants.
How many identification standards must global brands juggle today?
Companies often manage at least two region-specific protocols, ISO/IEC 15459 in Europe and ISO/IEC 20248 variants in parts of Asia-Pacific, until harmonization is achieved.
Page last updated on:


