
Walnut Market Size and Share
Walnut Market Analysis by Mordor Intelligence
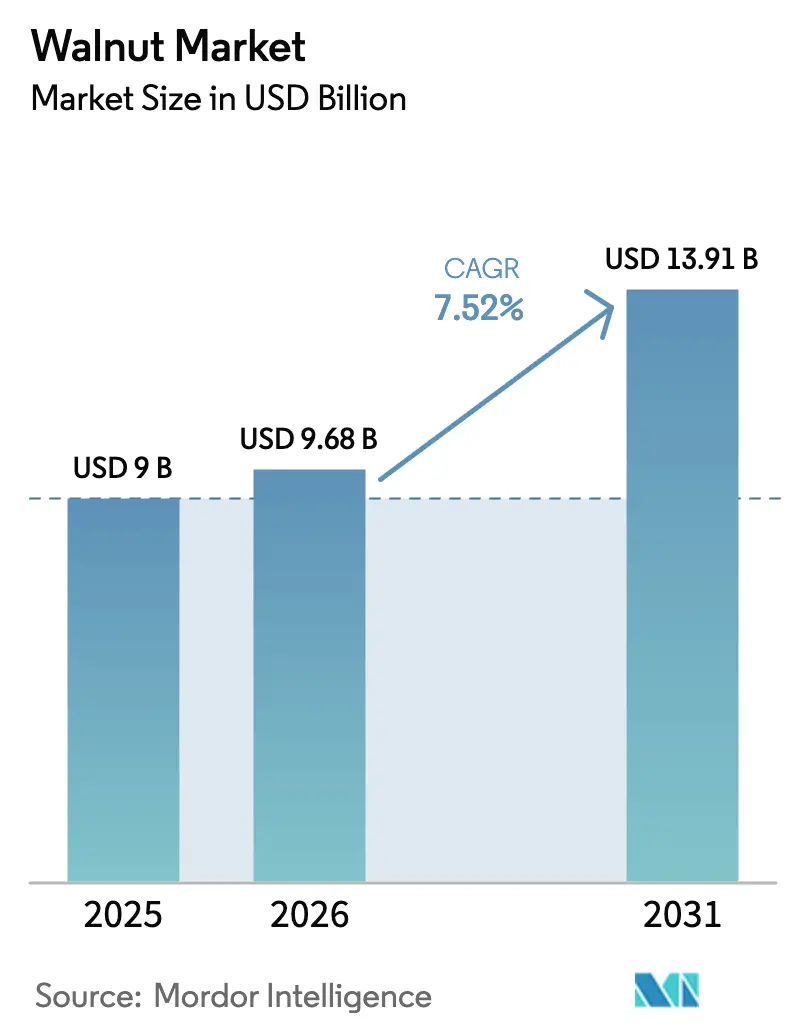
The walnut market size was valued at USD 9.0 billion in 2025 and is estimated to reach USD 9.68 billion in 2026, further projected to grow to USD 13.91 billion by 2031, expanding at a CAGR of 7.52% during the forecast period (2026–2031). The rising demand for plant-based protein snacks, premiumization in emerging economies, and the expanding use of walnuts in dairy alternatives continue to propel revenue growth. Shelled, premium-grade kernels are growing at a 9.8% annual pace as manufacturers favor ingredient-ready formats that shorten processing times and improve convenience. Asia commands a significant portion of the production value in 2025 and also records the fastest regional advance from 2026 to 2031, fueled by acreage expansion in China and India. Government climate-smart subsidies and blockchain-enabled traceability premiums help offset water and labor constraints, sustaining long-run profitability for orchard owners.
Key Report Takeaways
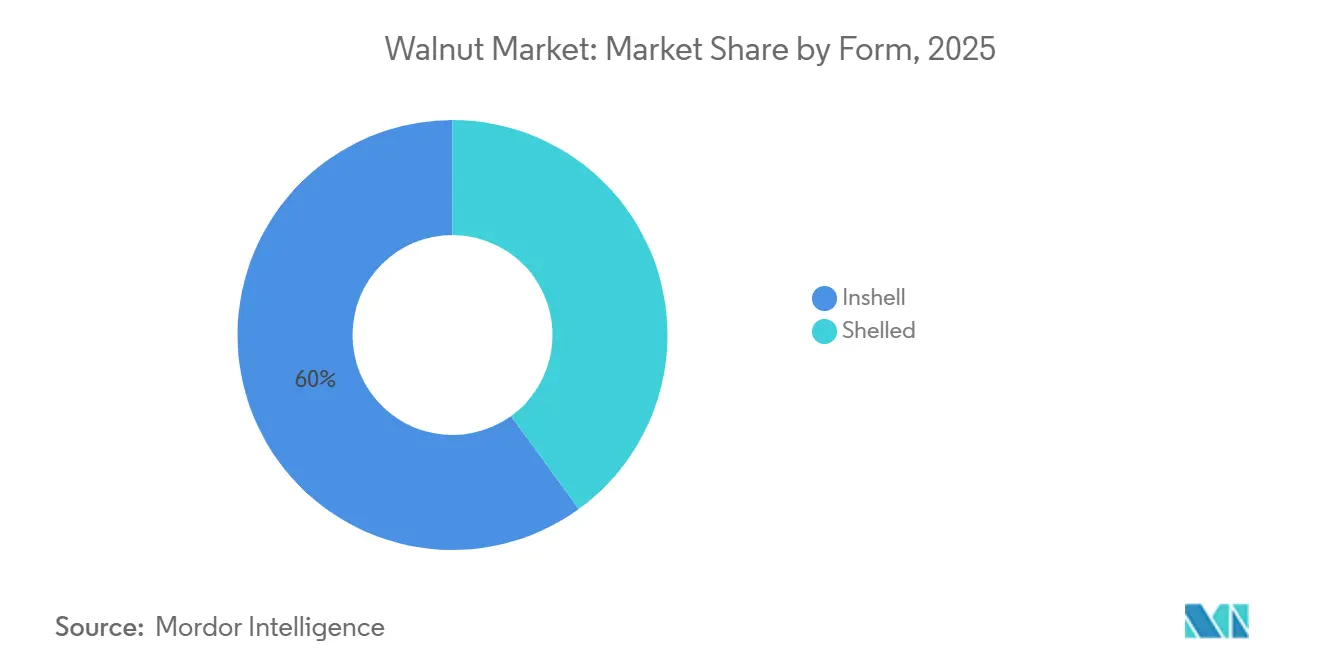
By form, in-shell walnuts led with a 60% of the walnut market share in 2025, while shelled premium kernels are expanding at a 9.8% CAGR through 2031.
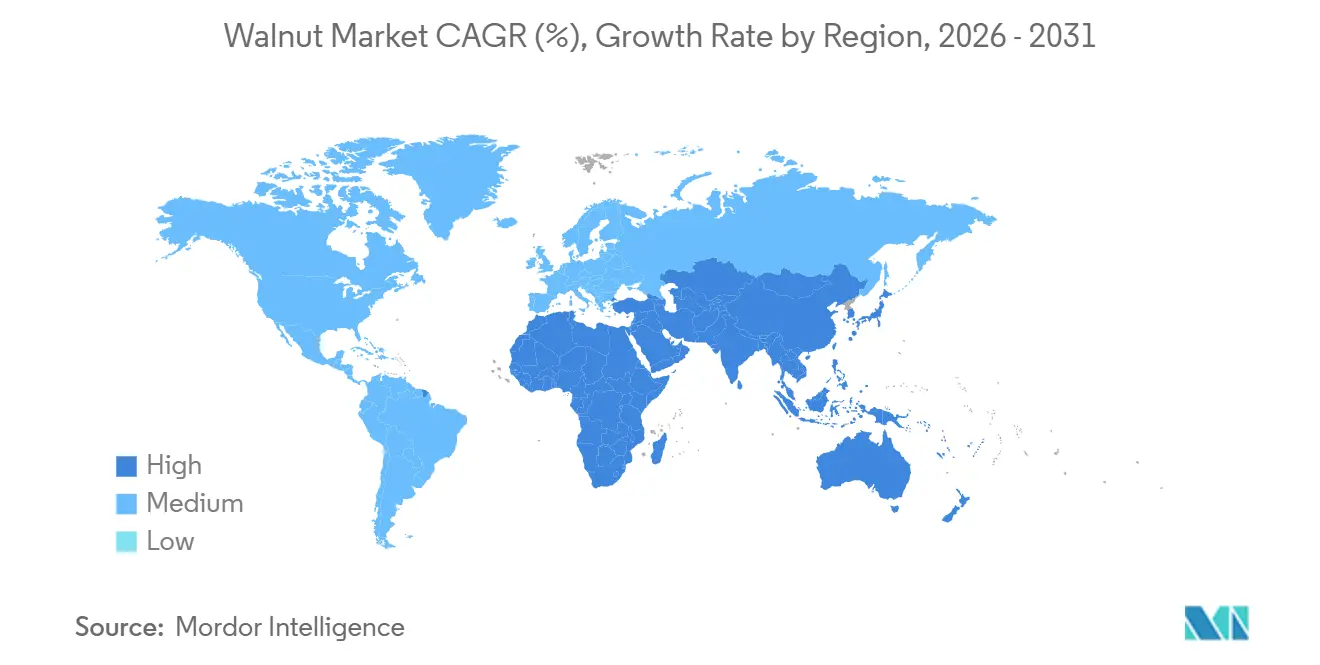
By geography, the Asia-Pacific region dominated the walnut market size with 65% value share in 2025 and is projected to record the fastest CAGR of 8.0% from 2026 to 2031.
Note: Market size and forecast figures in this report are generated using Mordor Intelligence’s proprietary estimation framework, updated with the latest available data and insights as of January 2026.
Global Walnut Market Trends and Insights
Drivers Impact Analysis*
| Driver | (~) % Impact on CAGR Forecast | Geographic Relevance | Impact Timeline |
|---|---|---|---|
| Government support programs and subsidy extensions for walnut orchards | +1.20% | North America, Europe, and South America | Medium term (2-4 years) |
| Rising demand for plant-based protein and healthy snacking | +1.8% | Global, strongest in North America, Europe, and Asia-Pacific | Long term (≥ 4 years) |
| Premiumization in emerging consumer markets | +1.3% | Asia-Pacific and Middle East | Medium term (2-4 years) |
| Carbon-sequestration credits and agro-forestry income stacking | +0.7% | North America, Europe, and Chile | Long term (≥ 4 years) |
| Surge in walnut usage in plant-based dairy and nut-protein beverages | +1.1% | Global, led by North America and Europe | Short term (≤ 2 years) |
| Blockchain-enabled origin traceability boosting export premiums | +0.6% | North America, Europe, and Chile | Medium term (2-4 years) |
| Source: Mordor Intelligence | |||
Government support programs and subsidy extensions for walnut orchards
Federal and state incentives help cushion orchard economics, funding irrigation improvements and integrated pest management. The United States Department of Agriculture (USDA) disbursed USD 3.1 billion in 2024 for climate-smart commodities; walnut agroforestry systems are eligible for multi-year grants that cover the costs of installing micro-irrigation and mechanical harvesting[1]Source: United States Department of Agriculture, “Climate-Smart Commodities,” USDA, usda.gov. California’s Walnut Marketing Order lifted its assessment rate to USD 0.0276 per kilogram for the 2024–25 season, funneling research dollars to drought-tolerant rootstocks[2]Source: California Walnut Board, “Walnut Marketing Order,” California Walnut Board, walnuts.org. Chile’s Programa de Fomento Agrícola provides up to USD 17,000 (CLP 15 million) per hectare for orchard modernization through 2027. The European Union secured USD 1.3 billion (EUR 1.2 billion) in 2025 for permanent-crop support, cushioning producers in France, Romania, and Spain. Collectively, these measures stabilize acreage and underpin the walnut market trajectory.
Rising demand for plant-based protein and healthy snacking
Health-driven consumers are making walnuts a pantry staple due to their high omega-3, protein, and polyphenol content. The Food and Drug Administration (FDA)’s formal recognition of walnuts as “healthy” offers new labeling leverage that can boost supermarket sales velocity. Emerging research indicates that walnut pellicle lipids, including oxylipins and endocannabinoids, support the positioning of functional foods. Premium processors like Omega Walnuts, which exports 100% United States Department of Agriculture (USDA) No. 1 grade kernels, are capitalizing on this demand in Japan, Korea, and Australia. Convenience-oriented packaged snacks and ingredient-ready kernels are driving the growth of shelled formats at a faster rate than in-shell counterparts within the walnut market.
Premiumization in Emerging Consumer Markets
Rising middle-class incomes in India, China, and the Middle East animate demand for light-halves, and nitrogen-flushed packs that fetch 30-50% premiums over generic in-shell offerings. India imported 62,000 metric tons in 2025, a 29% increase year-over-year, as organized retail chains expanded their assortments[3]Source: Agricultural and Processed Food Products Export Development Authority, “Agri Exchange,” APEDA, apeda.gov.in. Chinese e-commerce giants Tmall and JD.com recorded 19% growth in kernel sales during the 2025 Singles’ Day festival. These patterns move value toward processed formats, amplifying revenue in the walnut market.
Surge in Walnut Usage in Plant-Based Dairy and Nut-Protein Beverages
Elmhurst 1925 launched walnut milk in 2024, featuring 1,200 milligrams of omega-3 per serving. This was followed by Califia Farms’ walnut-oat blend in 2025, which targets coffee channels. Ingredient suppliers estimate kernel demand from nut beverages will reach 35,000 metric tons by 2029, widening industrial off-take. Walnut protein isolates are being incorporated into sports-nutrition formulations that deliver 20 grams of plant protein per serving. Diversified applications accelerate the adoption of processed kernels and increase the value of the walnut market.
Restraints Impact Analysis*
| Restraint | (~) % Impact on CAGR Forecast | Geographic Relevance | Impact Timeline |
|---|---|---|---|
| High water footprint and increasing irrigation restrictions | -1.4% | California, Chile, and China | Short term (≤ 2 years) |
| Rising orchard labor scarcity and picking costs | -0.9% | North America, Europe, and Middle East | Medium term (2-4 years) |
| Pest and disease outbreaks | -0.7% | Global, especially North America and Asia-Pacific | Short term (≤ 2 years) |
| Geopolitical trade sanctions on leading exporters | -0.6% | Middle East spill-over to Asia-Pacific and Europe | Medium term (2-4 years) |
| Source: Mordor Intelligence | |||
High Water Footprint and Increasing Irrigation Restrictions
Walnut orchards require 1,200-1,500 cubic meters of water per metric ton. California’s Department of Water Resources cut surface-water allocations by 25% in 2024, driving orchard fallowing or investment in USD 2,500-4,000 per acre micro-irrigation. Chile’s Directorate General of Water capped withdrawals at 80% of historical averages in 2025, prompting the implementation of deficit-irrigation protocols. Xinjiang introduced tiered water pricing in 2024, raising irrigation bills 30% for high-volume users. These constraints threaten output in legacy zones and shape the development of new plantings.
Rising Orchard Labor Scarcity and Picking Costs
Labor expenses in California increased by 18% from 2023 to 2025, as growers competed with construction and logistics companies. Chilean harvest wages climbed above USD 28 (CLP 25,000) daily, squeezing margins for smallholders without access to financing for USD 150,000 harvesters. Turkish orchards face similar shortages amid rural-to-urban migration. Mechanization gains traction in large units, yet uneven terrain and capital access keep manual picking prevalent, limiting efficiency in parts of the walnut market.
*Our forecasts treat driver/restraint impacts as directional, not additive. The impact forecasts reflect baseline growth, mix effects, and variable interactions.
Segment Analysis
By Form: Shelled Kernels Extend Value Leadership
In-shell walnuts accounted for 60% of the walnut market share in 2025. In-shell walnuts continue to attract consumers in China, Iran, and Turkey, where the shell serves as a signal of freshness and authenticity. Even there, urban lifestyles and tighter schedules are nudging shoppers toward shelled kernels that remove the work of home cracking. Value-added processing keeps margins healthy. Shelled kernels sell for USD 6,500–8,500 per metric ton, while in-shell nuts bring only USD 3,000–4,000. Brands are investing in resealable, nitrogen-flushed pouches that stretch shelf life to 18 months and protect omega-3 oils from rancidity. Flavor launches are accelerating, too. Roasted-and-salted, honey-glazed, and chili-lime options captured 22% of North American retail sales in 2025, up from 14% in 2023. Food-service chains are incorporating walnut pieces into salads, grain bowls, and bakery items to highlight the benefits of plant-based protein and heart health. Costco and Whole Foods saw private-label kernel sales rise 18% in 2025, supported by single-serve packs that fit on-the-go snacking habits. Competition is squeezing commodity-grade margins, yet suppliers that invest in origin branding, omega-3 claims, and traceable sourcing continue to secure premiums.
The shelled premium kernels are projected to grow at a CAGR of 9.8% through 2031. Demand for shelled formats is rising because shoppers want ready-to-eat snacks, ingredient-ready nuts for baking and cooking, and plant-based dairy products that call for pre-processed kernels. Processors such as Olam Food Ingredients and Borges Agricultural and Industrial Nuts increased their shelling and sorting capacity by 15% after 2024. Their new color sorters and laser graders now separate light halves, light pieces, and amber kernels with precision that meets the demands of premium buyers. The latest electronic graders screen more than 2 metric tons per hour, identifying defects that would have been missed in manual checks, allowing suppliers to charge 15–25% more for extra-light halves with uniform color and smooth surfaces.



Geography Analysis
Asia-Pacific remained the clear anchor of the walnut market. The region accounted for 65% of the walnut market size in 2025 and is projected to grow at an 8.0% CAGR between 2026 and 2031. China produced more than 1.1 million metric tons in 2025 and consumed nearly all of it, yet it still imported premium kernels to satisfy the rising demand for light halves. India’s import needs continued to climb as organized retail spread into tier-two cities, while Japan and South Korea provided a steady pull for United States and Chilean origins.
North America supplied a smaller but still meaningful portion of global volume. The United States harvest in 2024 was impacted by drought in California’s Central Valley, and water allocations remain tight, encouraging investment in drip irrigation and high-density plantings. Canada filled domestic snack manufacturing needs with imports, and Mexico’s orchards in Chihuahua and Sonora gained acreage on the back of favorable United States-Mexico-Canada Agreement terms. Across the Atlantic, European producers in France, Romania, and Ukraine worked to modernize aging orchards even as import dependence persisted, particularly for premium kernel grades.
South America relies primarily on Chile, whose counter-season harvest provides exporters with a prized off-season window, offering premium pricing in Asia and Europe. Peru and Brazil continued to expand small orchards, but they still face logistics bottlenecks that limit export scale. In the Middle East, Iran’s large crop struggled under trade sanctions, channeling much of its kernels through gray routes, while Turkey’s growers balanced domestic demand with small but stable sales to Western Europe. Africa’s output stayed modest, yet pilot plantings in Morocco and Egypt hinted at long-term diversification in suitable mountain zones.

Regulatory Landscape
Walnut trade and processing are shaped by a mix of U.S. marketing-order administration and broader food-safety and traceability requirements. In the United States, USDA AMS administers the Federal marketing order for walnuts grown in California (7 CFR part 984), including handler obligations and assessments that fund grade, quality, and research programs. In October 2025, USDA published proposed administrative requirement changes covering assessment payment schedules and interest for overdue assessments. Separately, USDA issued a direct final rule in September 2025 (effective November 6, 2025) that indefinitely stayed the regulation governing imports of walnuts under 7 CFR 999.100, shifting more import compliance emphasis toward general federal food-safety controls rather than a standalone import handling program.
Food safety and traceability compliance continues to tighten at farm and pack levels. California walnut growers moved into mandatory on-farm Produce Safety Rule inspections beginning in April 2026 under CDFA implementation, which increases the importance of documented sanitation, water, and harvest practices. For exporters, European Union entry requirements remain anchored to official controls and food-safety rules such as (EU) 2017/625, contaminant limits under (EU) 2023/915, pesticide residue limits under (EC) 396/2005, and risk-based border control provisions under (EU) 2019/1793. This elevates the value of verified testing, packaging compliance, and shipment-ready documentation.
Value Chain Analysis
The walnut value chain runs from orchard inputs (saplings/rootstocks, irrigation equipment, fertilizers and crop protection) to farm production, post-harvest hulling and drying, storage, shelling and sorting, packaging, and downstream distribution through importers, ingredient buyers, and retail and food-service channels. Production is split between smallholders (notably in China and parts of Eastern Europe) and larger commercial orchards in export-oriented origins such as California and Chile, with cooperative marketing and centralized processing playing an outsize role in price discovery and market access; Diamond Walnut Growers is a key example of a grower-owned cooperative model used to aggregate supply and serve large buyers.
Value capture increasingly concentrates in processing and quality assurance as buyers favor ingredient-ready kernels and consistent grades. Bottlenecks include cold storage and drying capacity, access to modern shelling and optical sorting, and logistics reliability for long-haul shipments, while trade policy and tariff changes add volatility to realized export prices. In California, water constraints and rising labor costs are accelerating adoption of high-density plantings, mechanized harvesting, and improved irrigation management, whereas smaller farms without capital access face higher discounting for inconsistent quality and limited on-farm infrastructure.
Competitive Landscape
Walnut production and sales remain highly fragmented, with smallholder growers cultivating the majority of the global acreage and relying on cooperative marketing systems to reach export buyers. In China, more than 2 million farms manage orchards of only 2–5 hectares and rely on local traders who pool volumes for wholesale markets, limiting individual bargaining power. California offers a different model, built on grower-owned cooperatives such as Diamond Walnut Growers, which negotiate multi-year contracts with retailers and overseas importers, helping member farms stabilize their income during price swings. Cooperative structures also support research into drought-tolerant rootstocks, mechanized harvesting, and blockchain traceability, which can help increase export premiums.
Chile presents a mixed landscape in which large vertically integrated orchards operate alongside thousands of smallholders who funnel nuts through regional cooperatives or independent exporters. Quality variation and limited cold storage often force smaller growers to accept discounts, which encourages ongoing investment in optical sorting, on-farm drying, and shared packing facilities. Consolidation is accelerating in water-stressed areas; farmland investment trusts acquired roughly 8,000 acres of California orchards during 2024 and 2025, converting them to high-density plantings with drip irrigation and mechanical shakers that trim per-acre costs by up to one-third. Similar capital inflows are beginning to appear in Chile’s Maule and O’Higgins regions, signaling a greater scale and adoption of technology over the next five years.
New go-to-market strategies are reshaping competition across origins. Contract farming has gained traction in India and Turkey, where exporters pre-finance inputs and provide agronomic advice in return for exclusive purchase rights, thereby improving kernel consistency while shifting price risk to growers. Direct-to-consumer channels are also expanding; cooperatives in California and Chile launched e-commerce storefronts in 2025 that bypass wholesale intermediaries, thereby boosting farm-gate returns for participating members. Processors continue to deploy blockchain-ledgers and satellite provenance tools to verify orchard practices, and early adopters are capturing meaningful premiums in European Union and North American retail programs focused on sustainability and transparency.
Market Opportunities and Future Outlook
Market whitespace is building around compliant, higher-value kernel formats that fit traceability, safety, and sustainability requirements. In the United States, the start of mandatory Produce Safety Rule inspections for California walnut growers in April 2026 pushes more volume toward packers and brands with strong on-farm documentation and preventive controls, reinforcing demand for standardized post-harvest handling, testing, and lot-level recordkeeping. In the European Union, the Packaging and Packaging Waste Regulation becomes applicable on August 12, 2026, including restrictions tied to PFAS and heavy metals in food-contact materials, which raises the compliance premium for exporters that can provide packaging declarations, validated materials, and consistent audit trails.
Trade access and market development programs also create targeted avenues for volume placement and product repositioning. A July 1, 2026 EU-US trade deal sets tariffs to zero percent for various U.S. tree nuts, including walnuts, within a 500,000-metric-ton quota framework, improving the economics for U.S. origin walnuts competing in Europe. On the demand side, industrial off-take continues expanding via plant-based dairy and blended beverages, supported by named product activity such as Elmhurst 1925 launching walnut milk in 2024 and Califia Farms introducing a walnut-oat blend in 2025. This supports opportunities for processors supplying beverage-grade kernels and functional ingredient formats (pieces, pastes, and protein-rich fractions) with consistent flavor and oxidation control.
Recent Industry Developments
- July 2026: The EU-US trade deal implementation set tariffs to zero percent for various US tree nuts, including walnuts, effective July 1, 2026, within a 500,000-metric-ton quota framework. The change improved landed-cost competitiveness for US-origin walnuts in Europe and increased the strategic value of compliant packaging and traceability for exporters targeting EU retail and ingredient channels.
- September 2025: Hiland Dairy and Hammons Products Company launched the limited-edition Ozark Harvest Crunch ice cream featuring candied Hammons Black Walnuts, with retail availability starting October 1, 2025. The co-branded product broadened consumer-facing usage for black walnuts and highlighted incremental demand creation through dessert and dairy innovation beyond traditional baking and snacking use cases.
- April 2024: The US FDA opened an outbreak investigation into E. coli O157:H7 linked to bulk organic walnuts. The incident increased attention on preventive controls, supplier verification, and lot-level traceability for bulk and ingredient-format walnuts moving through retail and food-service channels.


Research Methodology Framework and Report Scope
Market Definition and Coverage
For this study, the walnut market covers the value generated from edible walnuts sold into food and ingredient uses. The value is counted at the producer and processor level, reported in USD, and built around major producing and consuming countries.
Scope exclusions: We do not include walnut timber, non-edible byproducts that are not sold as walnut food products, or mixed tree-nut products where the walnut value cannot be separated.
Segmentation Overview
- By Geography
- North America
- United States
- Production Analysis (Area Harvested, Yield, and Production Volume)
- Consumption Analysis (Consumption Value and Volume)
- Import Market Analysis (Import Value, Volume, and Key Supplying Markets)
- Export Market Analysis (Export Value, Volume, and Key Destination Markets)
- Wholesale Price Trend Analysis and Forecast
- Regulatory Framework
- List of Key Players
- Logistics and Infrastructure
- Seasonality Analysis
- Mexico
- Production Analysis (Area Harvested, Yield, and Production Volume)
- Consumption Analysis (Consumption Value and Volume)
- Import Market Analysis (Import Value, Volume, and Key Supplying Markets)
- Export Market Analysis (Export Value, Volume, and Key Destination Markets)
- Wholesale Price Trend Analysis and Forecast
- Regulatory Framework
- List of Key Players
- Logistics and Infrastructure
- Seasonality Analysis
- United States
- Europe
- France
- Production Analysis (Area Harvested, Yield, and Production Volume)
- Consumption Analysis (Consumption Value and Volume)
- Import Market Analysis (Import Value, Volume, and Key Supplying Markets)
- Export Market Analysis (Export Value, Volume, and Key Destination Markets)
- Wholesale Price Trend Analysis and Forecast
- Regulatory Framework
- List of Key Players
- Logistics and Infrastructure
- Seasonality Analysis
- Ukraine
- Production Analysis (Area Harvested, Yield, and Production Volume)
- Consumption Analysis (Consumption Value and Volume)
- Import Market Analysis (Import Value, Volume, and Key Supplying Markets)
- Export Market Analysis (Export Value, Volume, and Key Destination Markets)
- Wholesale Price Trend Analysis and Forecast
- Regulatory Framework
- List of Key Players
- Logistics and Infrastructure
- Seasonality Analysis
- Germany
- Production Analysis (Area Harvested, Yield, and Production Volume)
- Consumption Analysis (Consumption Value and Volume)
- Import Market Analysis (Import Value, Volume, and Key Supplying Markets)
- Export Market Analysis (Export Value, Volume, and Key Destination Markets)
- Wholesale Price Trend Analysis and Forecast
- Regulatory Framework
- List of Key Players
- Logistics and Infrastructure
- Seasonality Analysis
- Italy
- Production Analysis (Area Harvested, Yield, and Production Volume)
- Consumption Analysis (Consumption Value and Volume)
- Import Market Analysis (Import Value, Volume, and Key Supplying Markets)
- Export Market Analysis (Export Value, Volume, and Key Destination Markets)
- Wholesale Price Trend Analysis and Forecast
- Regulatory Framework
- List of Key Players
- Logistics and Infrastructure
- Seasonality Analysis
- Spain
- Production Analysis (Area Harvested, Yield, and Production Volume)
- Consumption Analysis (Consumption Value and Volume)
- Import Market Analysis (Import Value, Volume, and Key Supplying Markets)
- Export Market Analysis (Export Value, Volume, and Key Destination Markets)
- Wholesale Price Trend Analysis and Forecast
- Regulatory Framework
- List of Key Players
- Logistics and Infrastructure
- Seasonality Analysis
- Netherlands
- Production Analysis (Area Harvested, Yield, and Production Volume)
- Consumption Analysis (Consumption Value and Volume)
- Import Market Analysis (Import Value, Volume, and Key Supplying Markets)
- Export Market Analysis (Export Value, Volume, and Key Destination Markets)
- Wholesale Price Trend Analysis and Forecast
- Regulatory Framework
- List of Key Players
- Logistics and Infrastructure
- Seasonality Analysis
- France
- Asia-Pacific
- China
- Production Analysis (Area Harvested, Yield, and Production Volume)
- Consumption Analysis (Consumption Value and Volume)
- Import Market Analysis (Import Value, Volume, and Key Supplying Markets)
- Export Market Analysis (Export Value, Volume, and Key Destination Markets)
- Wholesale Price Trend Analysis and Forecast
- Regulatory Framework
- List of Key Players
- Logistics and Infrastructure
- Seasonality Analysis
- India
- Production Analysis (Area Harvested, Yield, and Production Volume)
- Consumption Analysis (Consumption Value and Volume)
- Import Market Analysis (Import Value, Volume, and Key Supplying Markets)
- Export Market Analysis (Export Value, Volume, and Key Destination Markets)
- Wholesale Price Trend Analysis and Forecast
- Regulatory Framework
- List of Key Players
- Logistics and Infrastructure
- Seasonality Analysis
- Japan
- Production Analysis (Area Harvested, Yield, and Production Volume)
- Consumption Analysis (Consumption Value and Volume)
- Import Market Analysis (Import Value, Volume, and Key Supplying Markets)
- Export Market Analysis (Export Value, Volume, and Key Destination Markets)
- Wholesale Price Trend Analysis and Forecast
- Regulatory Framework
- List of Key Players
- Logistics and Infrastructure
- Seasonality Analysis
- South Korea
- Production Analysis (Area Harvested, Yield, and Production Volume)
- Consumption Analysis (Consumption Value and Volume)
- Import Market Analysis (Import Value, Volume, and Key Supplying Markets)
- Export Market Analysis (Export Value, Volume, and Key Destination Markets)
- Wholesale Price Trend Analysis and Forecast
- Regulatory Framework
- List of Key Players
- Logistics and Infrastructure
- Seasonality Analysis
- Australia
- Production Analysis (Area Harvested, Yield, and Production Volume)
- Consumption Analysis (Consumption Value and Volume)
- Import Market Analysis (Import Value, Volume, and Key Supplying Markets)
- Export Market Analysis (Export Value, Volume, and Key Destination Markets)
- Wholesale Price Trend Analysis and Forecast
- Regulatory Framework
- List of Key Players
- Logistics and Infrastructure
- Seasonality Analysis
- China
- Middle East
- Iran
- Production Analysis (Area Harvested, Yield, and Production Volume)
- Consumption Analysis (Consumption Value and Volume)
- Import Market Analysis (Import Value, Volume, and Key Supplying Markets)
- Export Market Analysis (Export Value, Volume, and Key Destination Markets)
- Wholesale Price Trend Analysis and Forecast
- Regulatory Framework
- List of Key Players
- Logistics and Infrastructure
- Seasonality Analysis
- Turkey
- Production Analysis (Area Harvested, Yield, and Production Volume)
- Consumption Analysis (Consumption Value and Volume)
- Import Market Analysis (Import Value, Volume, and Key Supplying Markets)
- Export Market Analysis (Export Value, Volume, and Key Destination Markets)
- Wholesale Price Trend Analysis and Forecast
- Regulatory Framework
- List of Key Players
- Logistics and Infrastructure
- Seasonality Analysis
- Iran
- Africa
- Egypt
- Production Analysis (Area Harvested, Yield, and Production Volume)
- Consumption Analysis (Consumption Value and Volume)
- Import Market Analysis (Import Value, Volume, and Key Supplying Markets)
- Export Market Analysis (Export Value, Volume, and Key Destination Markets)
- Wholesale Price Trend Analysis and Forecast
- Regulatory Framework
- List of Key Players
- Logistics and Infrastructure
- Seasonality Analysis
- Morocco
- Production Analysis (Area Harvested, Yield, and Production Volume)
- Consumption Analysis (Consumption Value and Volume)
- Import Market Analysis (Import Value, Volume, and Key Supplying Markets)
- Export Market Analysis (Export Value, Volume, and Key Destination Markets)
- Wholesale Price Trend Analysis and Forecast
- Regulatory Framework
- List of Key Players
- Logistics and Infrastructure
- Seasonality Analysis
- Egypt
- South America
- Chile
- Production Analysis (Area Harvested, Yield, and Production Volume)
- Consumption Analysis (Consumption Value and Volume)
- Import Market Analysis (Import Value, Volume, and Key Supplying Markets)
- Export Market Analysis (Export Value, Volume, and Key Destination Markets)
- Wholesale Price Trend Analysis and Forecast
- Regulatory Framework
- List of Key Players
- Logistics and Infrastructure
- Seasonality Analysis
- Brazil
- Production Analysis (Area Harvested, Yield, and Production Volume)
- Consumption Analysis (Consumption Value and Volume)
- Import Market Analysis (Import Value, Volume, and Key Supplying Markets)
- Export Market Analysis (Export Value, Volume, and Key Destination Markets)
- Wholesale Price Trend Analysis and Forecast
- Regulatory Framework
- List of Key Players
- Logistics and Infrastructure
- Seasonality Analysis
- Peru
- Production Analysis (Area Harvested, Yield, and Production Volume)
- Consumption Analysis (Consumption Value and Volume)
- Import Market Analysis (Import Value, Volume, and Key Supplying Markets)
- Export Market Analysis (Export Value, Volume, and Key Destination Markets)
- Wholesale Price Trend Analysis and Forecast
- Regulatory Framework
- List of Key Players
- Logistics and Infrastructure
- Seasonality Analysis
- Chile
- North America
- By Form (Value)
- In-shell
- Shelled
Data Sources, Market Sizing, and Validation
Desk Research
Desk research starts with a clear supply and demand picture, then turns it into a clean, comparable value series by country. We use public agriculture and trade statistics such as FAOSTAT, USDA (including ERS and FAS releases), UN Comtrade, and national agriculture ministries to compile production, harvested area, yield, and trade flows.
Price and usage context is added using sources such as the International Nut and Dried Fruit Council, peer-reviewed food science and nutrition journals for application trends, and public company filings and investor presentations for product mix and pricing commentary. A paid subscription that aggregates company financials and news is used selectively to cross-check processor scale and to capture major plant expansions, and an import-export shipment-level database is used in a limited way to validate trade direction and seasonality. These desk sources are illustrative, and other public references were also used for clarification and cross-checking.
Primary Interviews and Surveys
Primary work is used to fill gaps that public data leaves, mainly around price realization, kernel recovery, and how in-shell versus shelled formats are sold across channels. We interview growers, processors, traders, and downstream buyers across APAC, EMEA, and the Americas so the final assumptions reflect contracting terms, typical quality splits, and regional demand patterns.
Distribution of primary research fieldwork respondents
| Company type | Respondent position | Region |
|---|---|---|
| Top tier: 32% | CXOs: 13% | APAC: 53% |
| Mid tier: 54% | Functional/Unit leaders: 43% | EMEA: 29% |
| Smaller Players: 14% | Managers: 44% | Americas: 18% |
Market-Sizing & Forecasting
Sizing is built using a top-down model where country-level production and trade data are reconstructed into an edible supply pool, then translated into value using observed price ranges by form and quality. To keep it grounded, the model uses a small set of inputs tracked each year, including harvested area and yield trends, import-export balances, in-shell versus shelled share, typical kernel recovery rates for shelled output, and annual price movement by origin.
After the first pass, results are checked with selective bottom-up approximations such as rolling up a sample of processor volumes, using channel checks on average selling prices, and sanity-checking per-capita consumption against known dietary use patterns. When local data is thin, we apply conservative proxies from similar origin markets, then adjust after expert feedback so gaps do not create artificial spikes.
For forecasting, we combine scenario analysis with a simple multivariate regression lens that links value growth to drivers such as planted area changes, expected yield normalization, trade policy direction, and the pace of value-added processing adoption. Once the assumptions are built, they are validated with primary respondents so the final curve reflects what buyers and sellers expect to happen on the ground.
Data Validation & Update Cycle
Validation is done through step-by-step checks, not a single final sweep, so errors are caught early. We compare outputs against independent signals such as major origin export totals, price direction from public trade statistics, and the implied consumption balance by region, then rework outliers until the story and the math align.
Before sign-off, the model and assumptions go through internal peer review, followed by targeted re-contacts when a variance is too large to explain through seasonality or currency movement. The report is refreshed annually, and interim updates are made when major events occur, such as sharp harvest shocks, trade restrictions, or sustained price breaks. Right before delivery, a fresh pass is completed so clients receive the most current view available.
Mordor Intelligence's Walnut Market Size Versus Other Published Estimates
Published walnut market values can look far apart because each publisher draws the line around a different mix of forms, pricing points, and time periods. Differences also show up when one estimate is closer to farmgate values, another reflects wholesale value, and a third mixes in downstream applications that are hard to isolate.
A common gap driver is scope, where some sources describe a broader revenue stack that blends producer sales with importer activity, or includes adjacent processed categories without separating the walnut-only portion. Other differences come from currency timing, how in-shell to shelled conversion is treated, and whether price changes are modeled as a smooth progression or as a step change after a short crop year.
Benchmark comparison
| Source | Market Size | Gaps in Research Methodology |
|---|---|---|
| Mordor Intelligence | USD 9.00 B (2025) | |
| Industry Data Publisher A | USD 10.30 B (2024) | Uses a wholesale market value view that aggregates producer and importer revenues and is anchored to a different year, which makes the number sensitive to trade price swings and currency timing. |
| Global Consultancy B | USD 7.40 B (2025) | Treats the market closer to raw and processed category reporting with slower growth assumptions, and it can understate value when premium shelled kernels and higher realization pricing are not fully reflected. |
The spread is mainly explained by which selling level is being counted and how forms are converted into a single value number, rather than by any single demand story. Some figures roll in broader wholesale activity, then a narrower counting rule is applied. In line with Mordor Intelligence's approach, the value is limited to edible walnuts sold at producer and processor levels with clear form splits, keeping inputs traceable to production, trade, and pricing checks so the estimate is repeatable and easier to validate year over year.


Key Questions Answered in the Report
What is the estimated market size of the walnut market in 2026 and its projected growth through 2031?
The walnut market is estimated to reach USD 9.68 billion in 2026 and is projected to grow to USD 13.91 billion by 2031, reflecting a CAGR of 7.52%.
Which product form is expanding fastest within global walnut trade?
Shelled premium kernels are the fastest, advancing at a 9.8% CAGR through 2031 as convenience and ingredient-ready formats gain favor.
Which region dominates walnut production value?
Asia-Pacific leads with 65% of production value in 2025 and will grow at an 8.0% CAGR during 2026 to 2031, driven mainly by China and India.
How are carbon credits influencing walnut orchard economics?
Walnut orchards sequester 1.5–2.0 metric tons of CO₂ per acre, enabling growers to sell carbon credits valued at USD 30–100 per metric ton and add up to USD 75 per acre in California in 2025.
Page last updated on:






