AP Automation Market Size and Share
Market Overview
| Study Period | 2020 - 2031 |
|---|---|
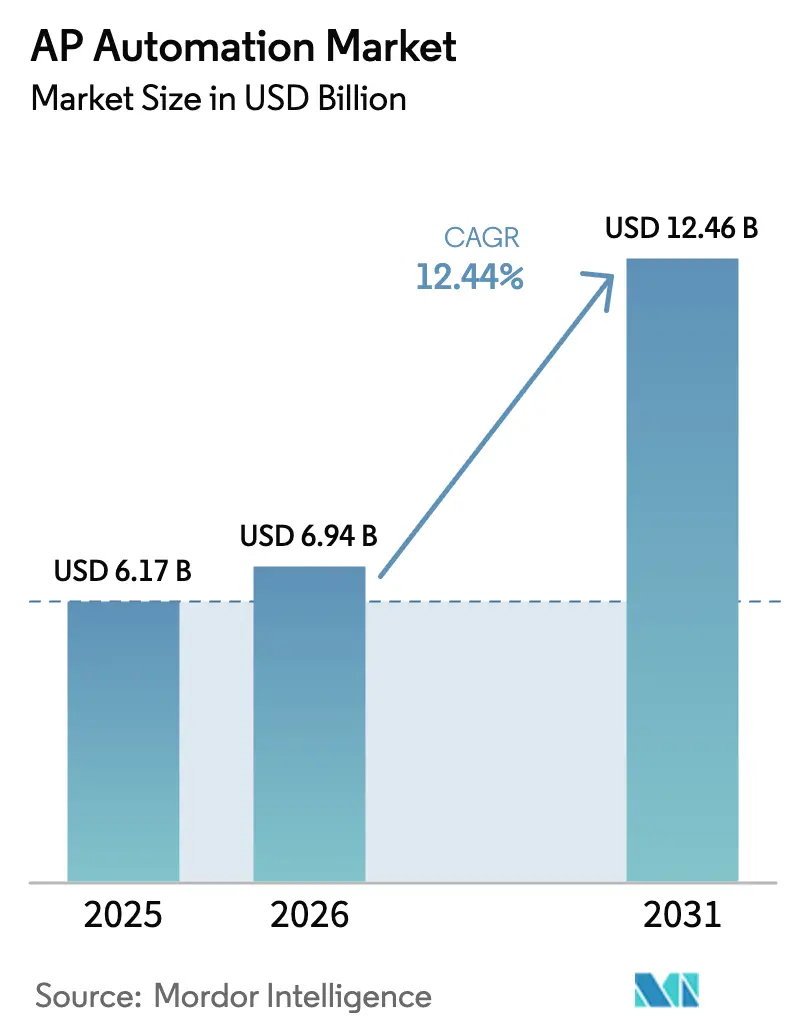
| Market Size (2026) | USD 6.94 Billion |
| Market Size (2031) | USD 12.46 Billion |
| Growth Rate (2026 - 2031) | 12.44% CAGR |
| Fastest Growing Market | Asia Pacific |
| Largest Market | North America |
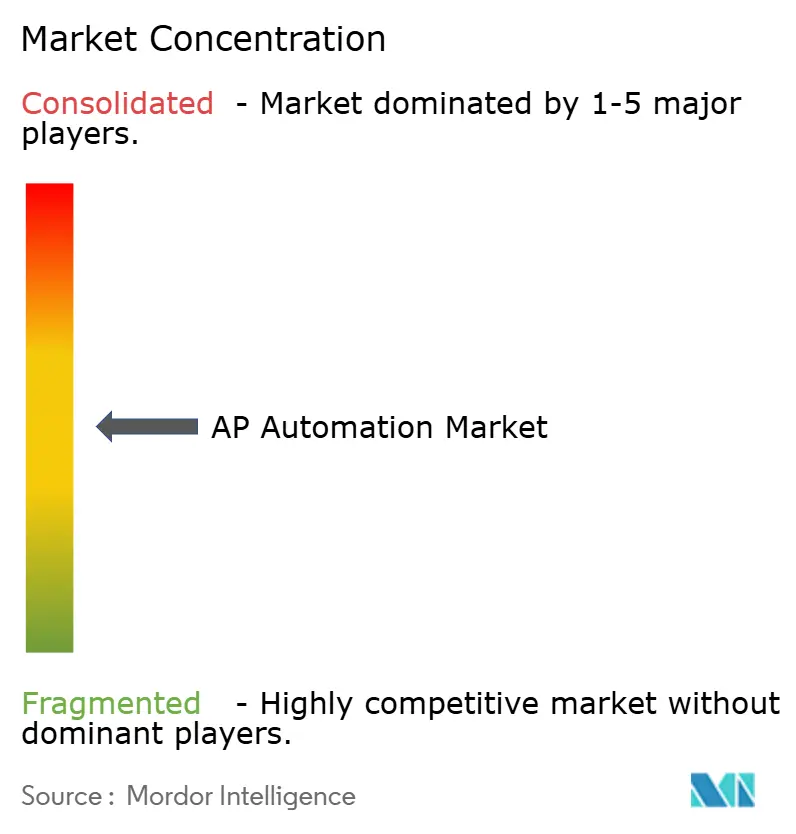
| Market Concentration | Medium |
Major Players *Disclaimer: Major Players sorted in no particular order Image © Mordor Intelligence. Reuse requires attribution under CC BY 4.0. | |
AP Automation Market Analysis by Mordor Intelligence
AP automation market size in 2026 is estimated at USD 6.94 billion, growing from 2025 value of USD 6.17 billion with 2031 projections showing USD 12.46 billion, growing at 12.44% CAGR over 2026-2031. Expanding cloud-native finance architectures, regulatory e-invoicing waves and real-time payment rails form the strongest growth catalysts for the AP automation market. Enterprises move away from manual invoice processing to lower cost, comply with multi-country tax mandates and gain real-time cash-flow visibility. Artificial intelligence strengthens data capture accuracy and fraud detection, shortening invoice-to-pay cycles and enhancing audit readiness. Meanwhile, vendors gain pricing power by embedding payments and carbon-accounting add-ons that turn the platform into a strategic source of revenue and environmental reporting efficiency. Competitive intensity rises as ERP majors, fintech specialists and vertical SaaS firms race to bundle AP, spend analytics and embedded payments into one finance operating layer.
Key Report Takeaways
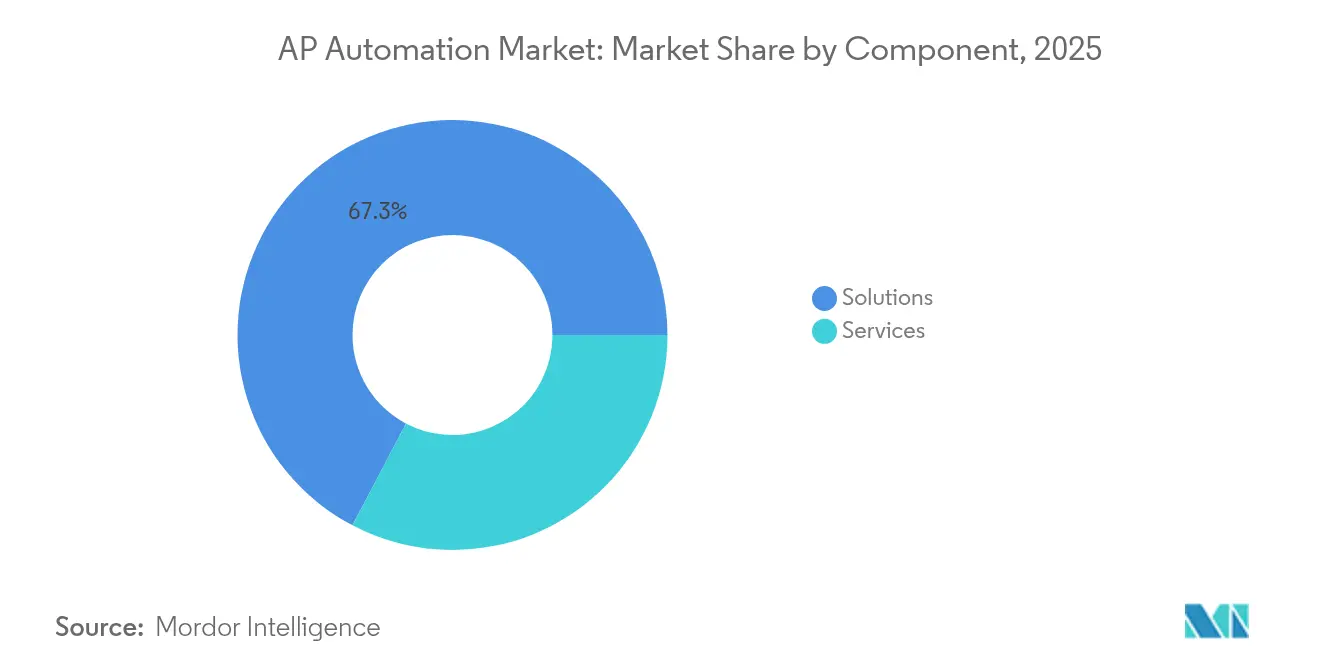
- By component, solutions held 67.30% revenue share in 2025, while services are projected to expand at a 15.25% CAGR to 2031.
- By deployment mode, on-premise accounted for 54.10% of the AP automation market share in 2025; cloud deployments are forecast to grow at 14.32% CAGR through 2031.
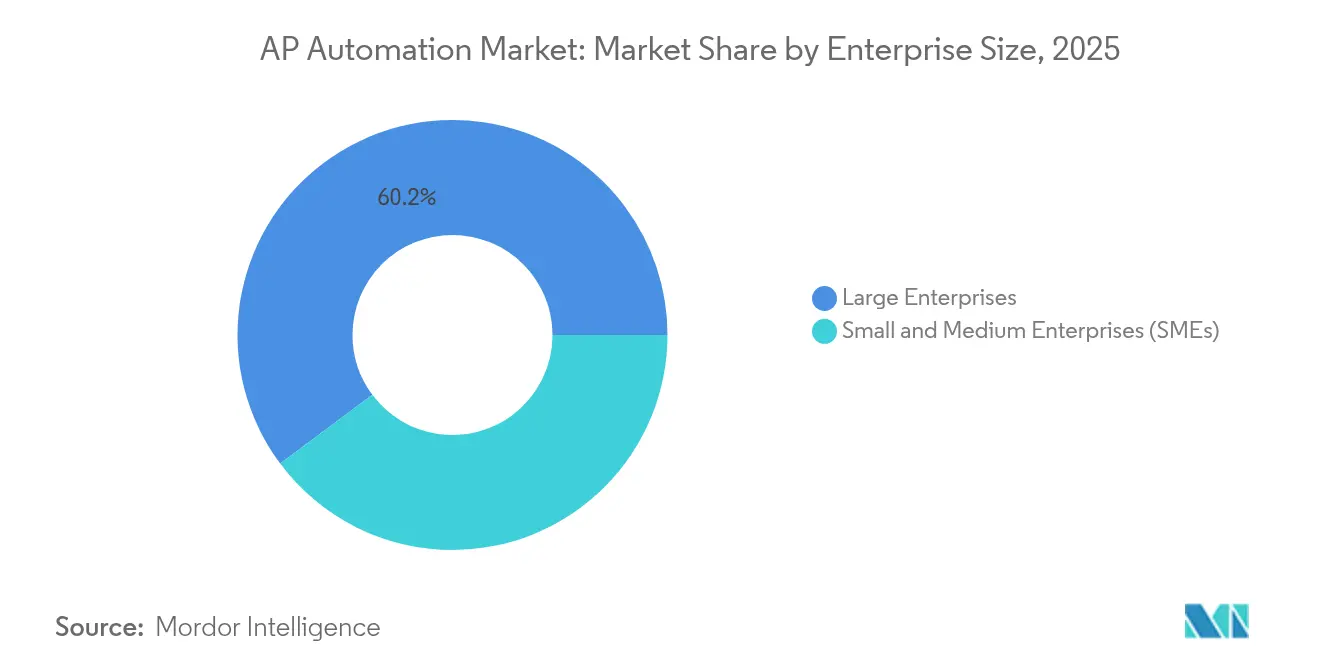
- By enterprise size, large enterprises captured 60.20% of the AP automation market size in 2025, whereas small and medium enterprises are set to grow at an 18.15% CAGR between 2026-2031.
- By industry vertical, BFSI led with 34.40% revenue share in 2025; IT and telecom is the fastest-growing vertical at 16.98% CAGR through 2031.
- By geography, North America commanded 37.10% revenue share in 2025; Asia-Pacific is advancing at 13.96% CAGR to 2031.
Note: Market size and forecast figures in this report are generated using Mordor Intelligence’s proprietary estimation framework, updated with the latest available data and insights as of 2026.
Global AP Automation Market Trends and Insights
Driver Impact Analyis*
| Driver | (~) % Impact on CAGR Forecast | Geographic Relevance | Impact Timeline |
|---|---|---|---|
| Digital transformation and cloud-first finance functions | +3.2% | Global, led by North America and Europe | Medium term (2-4 years) |
| Surge in e-invoicing mandates worldwide | +2.8% | Europe and Asia-Pacific core, expanding to Americas | Short term (≤ 2 years) |
| Embedded payments in ERPs and B2B marketplaces | +2.1% | North America and Europe, spillover to Asia-Pacific | Medium term (2-4 years) |
| AI-driven fraud detection requirements | +1.9% | Global, BFSI concentration | Short term (≤ 2 years) |
| Interoperable real-time payment rails | +1.7% | North America and Asia-Pacific, selective European adoption | Long term (≥ 4 years) |
| Carbon-accounting integration pressure | +1.3% | Europe and North America, expanding to Asia-Pacific | Long term (≥ 4 years) |
| Source: Mordor Intelligence | |||
Digital transformation and cloud-first finance functions
A majority of CFOs rate digital finance transformation as a top priority, and SAP reported 24% cloud revenue growth in Q1 2024 with a EUR 14.2 billion cloud backlog as enterprises migrate from legacy ERP to integrated platforms [1]SAP SE, “Q1 2024 Financial Results,” sap.com. Cloud deployment unlocks real-time data, automated compliance and faster AI innovation, trimming implementation times from months to weeks. Accessible web interfaces also support hybrid work, allowing finance staff to approve invoices securely from any location. These advantages reinforce enterprise preference for cloud subscriptions over capital-intensive on-premise projects, accelerating the AP automation market.
Surge in e-invoicing mandates worldwide
Over 80 countries now require structured e-invoices that feed tax authorities directly. The European Union’s VAT in the Digital Age program and India’s phased B2B e-invoicing roll-outs mandate near real-time data exchange that manual processes cannot satisfy europa.eu. Asia-Pacific’s APEC forum estimates USD 5 billion in productivity gains once member states reach 50% e-invoice penetration. Mandatory e-billing turns compliance into a trigger event, prompting enterprises to replace legacy scanning tools with certified AP automation suites that transmit validated invoice data to tax portals.
Embedded payments in ERPs and B2B marketplaces
Growing adoption of embedded finance lets platforms route payables directly to domestic or cross-border payment networks, eliminating reconciliation delays. VoPay’s Cross-Border Payments-as-a-Service enables money movement to 140+ countries and plugs into existing AP workflows [2]VoPay Inc., “VoPay Launches Cross-Border Payments-as-a-Service,” vopay.com. Straight-through processing shortens supplier settlement times, increases early-payment discount capture and creates new transaction-based revenue for software vendors. This embedded model advances the AP automation market by aligning invoice processing, approval and payment execution inside one user flow.
AI-driven fraud detection requirements
As payment volumes scale, finance teams seek machine-learning models that flag anomalous vendors, duplicate invoices and suspicious bank account changes. IBM’s Payments Center uses AI to monitor patterns across invoices and payment files, providing banks and corporates with proactive alerting. Dynamic analytics outperform static rule sets and protect against evolving fraud tactics. Vendors embedding AI engines differentiate their offerings and meet auditor expectations for robust internal controls.
Restraints Impact Analysis*
| Restraint | (~) % Impact on CAGR Forecast | Geographic Relevance | Impact Timeline |
|---|---|---|---|
| High switching and integration cost with legacy ERPs | -2.4% | Global, mature markets most affected | Medium term (2-4 years) |
| Data-sovereignty / residency rules | -1.8% | Europe and Asia-Pacific, selective North American sectors | Long term (≥ 4 years) |
| Growing API-security attack surface | -1.5% | Global, cloud-first firms most exposed | Short term (≤ 2 years) |
| Scarcity of domain-skilled AP data scientists | -1.3% | North America and Europe, emerging in Asia-Pacific | Medium term (2-4 years) |
| Source: Mordor Intelligence | |||
High switching and integration cost with legacy ERPs
Many enterprises run heavily customized SAP ECC or Oracle E-Business Suite environments due for end-of-support by 2027, yet migrations can exceed USD 10 million for global entities. Connecting modern AP tools to bespoke data models requires costly interface development and change management. Finance leaders therefore phase projects or extend incumbent systems, delaying full automation benefits and moderating AP automation market expansion.
Data-sovereignty and residency rules
European GDPR, China’s Cybersecurity Law and regional tax store-and-report stipulations demand that financial records stay inside national borders. Vendors must maintain local data centers or offer hybrid deployment, raising operating expense and limiting their global scalability. Enterprises often compromise on feature depth to satisfy residency rules, creating fragmented adoption patterns and elevating total cost of ownership.
*Our forecasts treat driver/restraint impacts as directional, not additive. The impact forecasts reflect baseline growth, mix effects, and variable interactions.
Segment Analysis
By Component: Services accelerate despite solutions dominance
Solutions captured 67.30% of 2025 revenue, reflecting buyer preference for end-to-end invoice-to-pay platforms. Services, however, clock a 15.25% CAGR to 2031 as organizations seek integration, change management and managed operations expertise. Corpay’s USD 475 million acquisition of Paymerang underscores the premium placed on bundled software-plus-service models. The AP automation market therefore evolves into a lifecycle partnership where advisory, implementation and continuous optimization unlock the full platform value. Services firms that master multi-ERP connectors, tax compliance templates and supplier onboarding become critical enablers and secure recurring revenue.
The services boom mirrors rising complexity in cross-border VAT rules, real-time payment schemes and ESG disclosures. Providers run invoice capture centers, apply AI training to client data and manage supplier support desks, activities many finance teams cannot scale internally. As a result, enterprises view outsourcing as a route to predictable costs and higher straight-through rates. This interplay of software and expert support cements services as the growth engine within the AP automation market.


By Deployment Mode: Cloud transformation accelerates
On-premise installations held a 54.10% slice of the AP automation market share in 2025, yet cloud subscriptions are expanding at 14.32% CAGR. Early adopters kept sensitive payables data on site due to perceived security advantages. Cloud infrastructure, now bolstered by encryption, zero-trust controls and ISO-compliant data centers, outperforms many corporate server rooms. Vendors release monthly features such as AI line-item extraction and carbon tracking that only cloud tenants receive in real time. As hybrid work requires browser-based approvals, finance chiefs recalibrate risk measures and prioritize agility, reinforcing cloud-first pathways in the AP automation market.
Cloud platforms also integrate with national real-time payment rails and tax portals through continuously updated APIs, an impossible task for static on-premise software. Subscription pricing converts capital outlays into operating expenses and allows SMEs to achieve parity with larger peers. Collectively, these drivers reduce total cost of ownership and shift the AP automation market size balance toward cloud-delivered solutions over the forecast horizon.
By Enterprise Size: SME digitization drives growth
Large enterprises accounted for 60.20% of 2025 revenue due to higher invoice volumes and complex approval matrices. Yet SMEs lead growth at an 18.15% CAGR, reflecting the democratization of automation via intuitive SaaS interfaces and per-invoice pricing. Platforms like Airwallex integrate local tax codes and payment rails out-of-the-box, removing technical hurdles for smaller firms . The AP automation market size for the SME cohort is projected to widen rapidly as banks embed white-label AP modules and marketplaces demand electronic invoices for faster settlement.
SME adoption creates network pressure upstream; suppliers expect electronic POs and remittance advice, pushing larger buyers to upgrade their own systems. Low-code configuration, template libraries and community forums lower training time, letting small finance teams automate within weeks. This groundswell injects new volume and drives product innovation across the broader AP automation market.
By Industry Vertical: IT sector leads digital adoption
BFSI retained 34.40% of revenue in 2025 thanks to regulatory scrutiny and high transaction counts. The IT and telecom segment, however, grows fastest at 16.98% CAGR because technology firms readily embrace API-first architectures and data-driven spend analytics. Ramp’s procurement API illustrates how tech companies stitch AP automation into dev-ops pipelines, turning finance controls into programmable checks. The AP automation market thus sees demand shift toward vertical features such as telecom tax mapping and software license spend optimization.
Healthcare and manufacturing verticals also expand as they confront stringent supplier traceability and rising material costs. Vendors add GS1 barcode validation, 3-way match against electronic delivery notes and automated ESG scorecards tailored to each sector. This verticalization trend differentiates platforms and aligns product roadmaps to industry pain points, deepening market penetration.
Geography Analysis
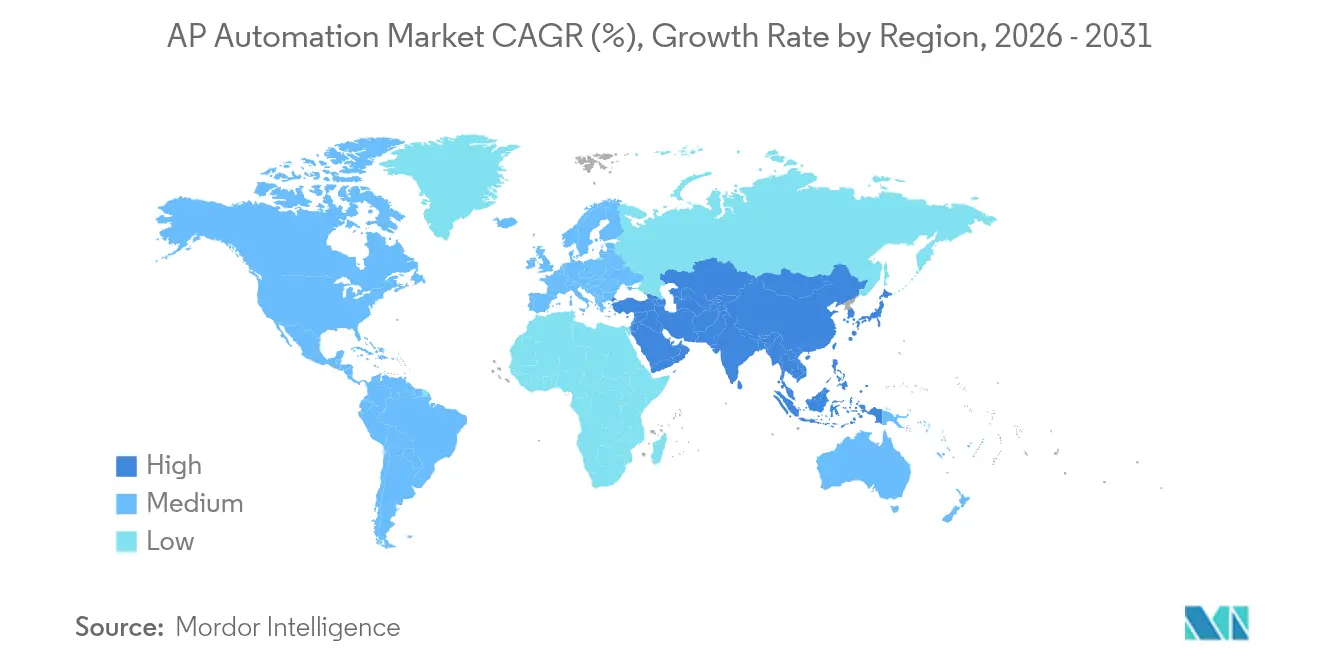
North America held 37.10% of global revenue in 2025 on the back of mature ERP penetration and the rollout of FedNow, which enables instant interbank settlement that feeds directly into AP workflows. Growth in the region moderates as Fortune 1000 cohorts near full automation, directing vendor focus to mid-market and state-local government segments. Canada’s upcoming Real-Time Rail, scheduled for 2026, is expected to unlock further opportunities for embedded payables solutions.
Asia-Pacific is the fastest-growing region at 13.96% CAGR, spurred by mandatory e-invoicing in India, Indonesia, and Japan, and the region’s rapidly rising AI investment to USD 86.8 billion by 2025. Cloud-first small businesses leapfrog legacy systems, embracing mobile approval apps and QR-code billing. Governments encourage cross-border interoperability through frameworks such as Singapore’s SGQR and Australia’s PEPPOL adoption, further widening the AP automation market.
Europe showcases consistent uptake driven by VAT in the Digital Age reforms and sustainability legislation that pushes firms to track carbon embedded in supplier invoices. OpenText’s Business Network already routes millions of compliant e-invoices per month across 30 European jurisdictions. Vendors offering localization, multi-currency support and local data residency capture share as customers prioritize regulatory adherence over generic functionality.

Competitive Landscape
The AP automation market remains moderately fragmented. ERP incumbents SAP and Oracle leverage large installed bases, while specialists such as Coupa, Tipalti and AvidXchange innovate on AI extraction, global payments and supplier portals.
SAP reported a EUR 14.2 billion cloud backlog in Q1 2024, highlighting cloud upsell success. Recent MandA signals consolidation: Corpay purchased Paymerang to fuse spend management and payments; Basware acquired AP Matching to improve duplicate detection; Modulr bought Nook to roll out Modulr AP.
Technology differentiation centers on four themes: embedded payments, AI-based fraud analytics, carbon-accounting modules and vertical templates. Vendors that couple broad platform depth with domain consultants secure multiyear renewals and raise competitive barriers. Pricing remains subscription plus transaction fee, but value-based models tied to straight-through-processing rates emerge in enterprise contracts.
AP Automation Industry Leaders
SAP SE
Oracle Corporation
Coupa Software Inc.
Tipalti Inc.
Basware Oy
- *Disclaimer: Major Players sorted in no particular order

Recent Industry Developments
- April 2025: VoPay launched Cross-Border Payments-as-a-Service, supporting money movement across 140+ countries inside existing AP workflows.
- January 2025: AvidXchange agreed to be acquired by TPG in partnership with Corpay for USD 2.2 billion, forming a combined B2B payments and AP automation leader serving 250,000 merchants and processing USD 120 billion in annual spend.
- November 2024: Modulr acquired AP automation platform Nook and announced Modulr AP for early 2025 launch, integrating AI OCR with global payments and accounting connectors.
- October 2024: Procurify released an AI-driven AP automation module that accelerates invoice coding and reduces exception handling time.


Research Methodology Framework and Report Scope
Market Definitions and Key Coverage
Our study defines the accounts payable (AP) automation market as all cloud or on-premise software and supporting services that capture invoices, validate them against purchase data, route approvals, and trigger electronic payment while feeding audit and analytics layers. We treat solution license or subscription fees, implementation, and managed support revenues as part of market value, and we model spend from large enterprises and midsized firms across every industry that handles third-party invoices at scale.
Scope exclusion: stand-alone workflow or ERP suites not sold with invoice-to-pay modules are left outside the boundary.
Segmentation Overview
- By Component
- Solutions
- Services
- By Deployment Mode
- Cloud
- On-premise
- By Enterprise Size
- Large Enterprises
- Small and Medium Enterprises (SMEs)
- By Industry Vertical
- BFSI
- IT and Telecom
- Retail and Consumer Goods
- Healthcare and Life Sciences
- Manufacturing
- Energy and Utilities
- Government and Public Sector
- Others
- By Geography
- North America
- United States
- Canada
- Mexico
- South America
- Brazil
- Argentina
- Rest of South America
- Europe
- Germany
- United Kingdom
- France
- Italy
- Spain
- Russia
- Rest of Europe
- Asia-Pacific
- China
- Japan
- India
- South Korea
- Australia and New Zealand
- Rest of Asia-Pacific
- Middle East and Africa
- Middle East
- Saudi Arabia
- UAE
- Turkey
- Rest of Middle East
- Africa
- South Africa
- Nigeria
- Kenya
- Rest of Africa
- Middle East
- North America
Detailed Research Methodology and Data Validation
Primary Research
Mordor analysts interviewed AP managers, controllers, and implementation partners across North America, Europe, and Asia-Pacific. They then ran structured surveys among mid-market CFOs to stress-test payback periods, digital invoice penetration, and average subscription prices. Insights from technology integrators helped us verify regional price corridors and rollout timelines.
Desk Research
We began with authoritative public data such as US Bureau of Labor Statistics cost-of-processing surveys, European Commission e-Invoicing mandate timelines, Reserve Bank real-time payments statistics, and filings of listed payables platform providers. This was augmented by finance leadership reports from bodies such as the Institute of Finance & Management. Global trade repositories and customs datasets helped us size cross-border invoice volumes that influence automation demand.
These inputs were complemented by paid resources in Mordor's toolset, notably D&B Hoovers for company revenue splits and Dow Jones Factiva for deal flow that signals adoption inflection points. Annual reports, investor decks, and reputable business press rounded out trend validation. The sources cited above are illustrative; our analysts referenced many additional materials during cross-checks.
Market-Sizing & Forecasting
A top-down demand pool built from the number of addressable invoices multiplied by surveyed cost-to-automate and adoption ratios sets the first estimate, which is then checked through selective bottom-up supplier revenue roll-ups. Key variables include invoice volumes per employee, share of touchless processing, cloud migration rates, regulatory e-invoicing cut-off dates, and average SaaS price points. A multivariate regression model links these drivers to historical spend, while scenario analysis handles policy or pricing shocks. Gaps in bottom-up coverage are bridged by regional channel checks before final reconciliation.
Data Validation & Update Cycle
Outputs pass a three-layer review: automated variance flags, peer analyst inspection, and senior sign-off. We refresh the dataset each year, with in-cycle addendums when material events alter adoption curves, ensuring clients receive the newest view.
Why Mordor's AP Automation Baseline Is Dependable
Published figures frequently diverge because firms apply different functional scopes, currency conversions, and refresh cadences. By anchoring revenues to invoice-level economics and validating price bands with active buyers, we minimize scope drift and currency bias.
Lower rival estimates often stem from excluding services or SMEs, or from using vendor revenue alone without invoice adoption filters, whereas Mordor folds those layers in and updates once new e-invoicing mandates lift demand.
Benchmark comparison
| Market Size | Anonymized source | Primary gap driver |
|---|---|---|
| USD 6.17 B (2025) | Mordor Intelligence | - |
| USD 3.41 B (2024) | Global Consultancy A | Software fees only, services omitted, vendor roll-up approach |
| USD 3.85 B (2023) | Industry Research B | Excludes SMEs and uses static adoption rates, older currency base |
In short, Mordor's blended top-down and field-validated bottom-up framework, combined with an annual refresh, delivers a balanced reference point that decision-makers can trace back to transparent variables and repeatable steps.


Key Questions Answered in the Report
What is the current size of the AP automation market?
The AP automation market stands at USD 6.94 billion in 2026 and is projected to reach USD 12.46 billion by 2031.
Which segment of the AP automation market is growing the fastest?
Cloud deployment is the fastest-growing segment, expanding at a 14.32% CAGR as enterprises migrate from on-premise systems to SaaS platforms.
Why are e-invoicing mandates important for AP automation adoption?
Mandatory e-invoices in more than 80 countries require real-time data exchange, making automated platforms essential for compliance and driving growth of the AP automation market.
Which region shows the highest growth rate in AP automation?
Asia-Pacific is expected to advance at a 13.96% CAGR due to government e-invoicing mandates and widespread mobile-first finance adoption.
How are embedded payments changing the AP automation landscape?
Embedded payments link invoice approval directly to payment execution inside ERPs and marketplaces, reducing settlement time and creating new revenue streams for software providers.
What is the main barrier to adopting AP automation in large enterprises?
High switching and integration costs with customized legacy ERPs often exceed USD 10 million, slowing full migration to modern automation suites.
Page last updated on:


