
North America Orange Market Analysis by Mordor Intelligence
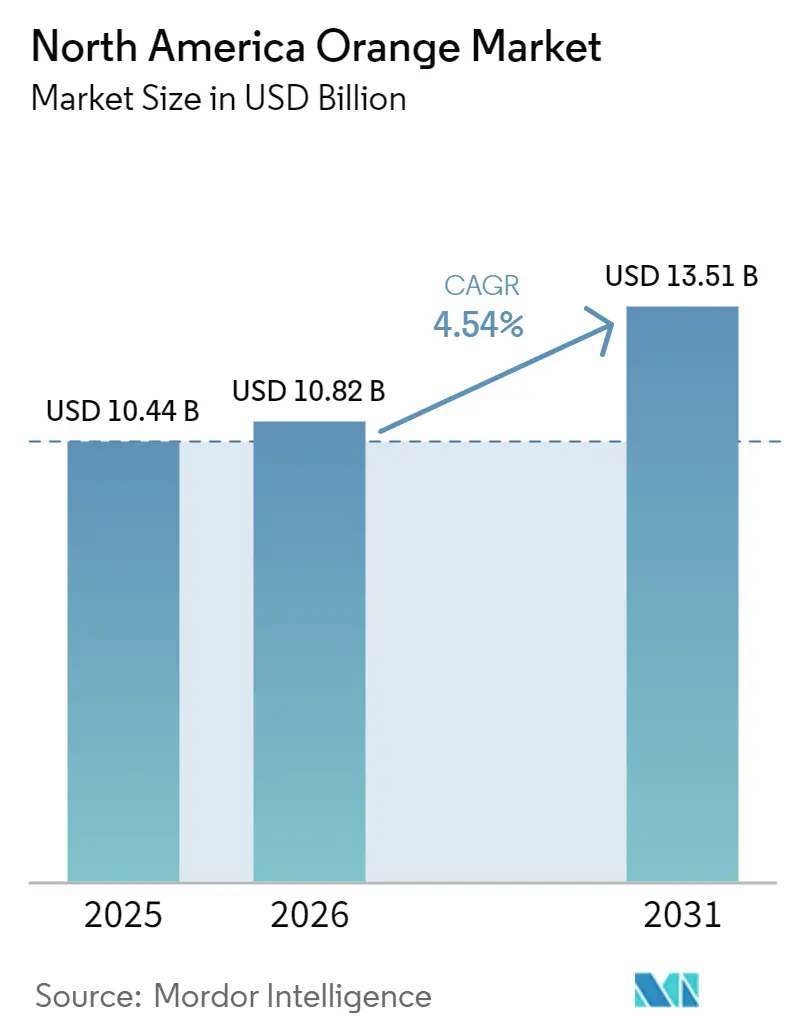
The North America orange market size is projected to increase from USD 10.44 billion in 2025 to USD 10.82 billion in 2026 and reach USD 13.51 billion by 2031, growing at a CAGR of 4.54% over 2026-2031. The expansion rests on three intertwined forces, a structural shift in regional output from Florida toward northern Mexico, fast-growing demand for premium not-from-concentrate juice, and the accelerating rollout of climate-resilient cultivars that can withstand huanglongbing infections. United States processors are re-engineering contract terms around guaranteed fresh-fruit volumes rather than frozen-concentrate benchmarks, thereby reframing grower incentives toward higher-quality fruit. Mexico is drawing acreage and investment away from Florida as growers respond to Veracruz’s favorable microclimate and lower vector pressure. Canada, while remaining a net importer, provides a stable demand floor because tariff-free provisions under the United States-Mexico-Canada Agreement keep landed costs competitive. Production volatility, labor shortages, and tightening water regulations temper the upside, yet the overall trajectory remains positive as processors hedge risk through geographic diversification and cultivar innovation.
Key Report Takeaways
- By country, the United States led with 72.3% of the North America orange market share in 2025, while Mexico recorded the fastest projected CAGR of 4.8% through 2031.
Note: Market size and forecast figures in this report are generated using Mordor Intelligence’s proprietary estimation framework, updated with the latest available data and insights as of January 2026.
North America Orange Market Trends and Insights
Drivers Impact Analysis*
| Driver | (~) % Impact on CAGR Forecast | Geographic Relevance | Impact Timeline |
|---|---|---|---|
| Climate-resilient cultivar adoption | +0.6% | United States (Florida, Texas), and Mexico (Veracruz, Tamaulipas) | Long term (≥ 4 years) |
| Surge in not-from-concentrate (NFC) juice contracts | +0.9% | United States, and Canada (import-driven demand) | Medium term (2-4 years) |
| Integrated pest-management diffusion | +0.4% | United States (Florida, California, Texas), and Mexico | Medium term (2-4 years) |
| Orchard automation and robotics uptake | +0.3% | United States (California, Florida), and pilots in Mexico | Long term (≥ 4 years) |
| Government re-planting subsidies | +0.5% | United States and Mexico | Medium term (2-4 years) |
| Rising health-driven per-capita juice intake | +0.2% | Canada, and selected United States demographics | Short term (≤ 2 years) |
| Source: Mordor Intelligence | |||
Climate-Resilient Cultivar Adoption
Growers across Florida, Texas, Veracruz, and Tamaulipas are grafting Sugar Belle, Tango, and other tolerant varieties that retain soluble solids content even at higher ambient temperatures. In April 2025, the University of Florida Institute of Food and Agricultural Sciences released six HLB-tolerant varieties including sweet orange selections OLL-DC-3-40 and OLL-DC-3-36 and mandarin hybrids C4-10-42 and RBA 13-18, developed specifically to restore Brix and soluble solids in not-from-concentrate processor blends, with The United States Department of Agriculture Agricultural Research Service (USDA ARS) separately advancing Brixy, an HLB-tolerant selection averaging approximately 12.3 Brix across replicated Florida trials[1]. Mexican producers replanted with Valencia on Swingle citrumelo rootstock after a 55.5% production jump in early 2025, signaling confidence in longer-term yield stability. Adoption remains uneven because Florida’s older growers face a three- to five-year payback and fear additional disease flare-ups. The transition nevertheless underpins Mexico’s outperformance as newer orchards enter peak production just as legacy Florida groves reach removal age.
Surge in Not-From-Concentrate (NFC) Juice Contracts
Processors are increasingly negotiating multi-year supply agreements that guarantee fresh-fruit volumes and establish floor prices indexed to wholesale fresh-fruit benchmarks, helping insulate growers from frozen-concentrate price volatility. Investments in cold-storage capacity and premium product portfolios are strengthening supply chain resilience and supporting the production of higher-value juice products. Mexico benefits from shorter transit times to major processing hubs in the United States, preserving fruit quality during transportation. In Canada, a duty-free trade environment improves the competitiveness of not-from-concentrate (NFC) juice by enabling retailers to offer competitively priced products despite refrigeration costs. By linking grower revenues to NFC premiums, these developments improve farm-gate returns and encourage continued investment in orchard rehabilitation and productivity improvements.
Integrated Pest-Management Diffusion
Regulatory programs emphasizing vector surveillance, area-wide pest management, and biological control are increasing compliance requirements for citrus growers. Coordinated pest monitoring and certification efforts across major producing regions are helping maintain pest-free status and support access to export markets. Larger cooperatives increasingly integrate pest-monitoring data into processor audit systems, enabling growers to qualify for quality-based price incentives. Although adoption remains uneven among smaller producers, processor procurement standards are encouraging wider implementation of integrated pest management practices. The broader adoption of these measures is helping slow disease spread, improve orchard productivity, and support long-term supply stability.
Government Re-Planting Subsidies
Government conservation and cost-share programs continue to support investments in orchard rehabilitation, irrigation modernization, improved rootstocks, and soil health management. However, application requirements, funding prioritization, and administrative procedures can limit participation among smaller growers, slowing the adoption of productivity-enhancing practices in some producing regions. These programs are particularly beneficial for smallholders, who often rely on financial assistance to offset the costs of orchard modernization and the adoption of improved cultivation practices. At the same time, eligibility requirements tied to sustainable production and integrated pest management can increase compliance obligations and implementation costs. Over the long term, these investments are anticipated to improve orchard productivity, strengthen production resilience, and support higher yields as newly established orchards reach commercial maturity.
Restraints Impact Analysis*
| Restraint | (~) % Impact on CAGR Forecast | Geographic Relevance | Impact Timeline |
|---|---|---|---|
| Labor shortages during harvest peaks | -0.6% | United States (California, Florida), and emerging in Mexico | Short term (≤ 2 years) |
| Water-use regulations tightening | -0.5% | United States (California Sustainable Groundwater Management Act zones, Florida aquifer limits) | Medium term (2-4 years) |
| Price volatility in frozen concentrated orange juice (FCOJ) futures | -0.4% | United States (processor margins), and indirect impact on Mexico | Short term (≤ 2 years) |
| Rising plant-based beverage substitutes | -0.7% | United States and Canada urban centers | Long term (≥ 4 years) |
| Source: Mordor Intelligence | |||
Labor Shortages During Harvest Peaks
California’s reliance on guest workers faltered in 2025 when H-2A approvals slipped eight weeks behind schedule, forcing growers to hire spot crews at 20% wage premiums[2]. Florida’s farm labor pool eroded as groves were abandoned due to huanglongbing, leaving pickers to compete for jobs in other crops offering steadier year-round jobs. Mexico traditionally relied on an abundant seasonal workforce, yet manufacturing expansion in Tamaulipas and Nuevo León is now pulling labor away from agriculture, lifting orchard day rates. With peak harvest compressed into November-to-March windows, every lost day converts to lower juice-solids yields, reducing processor throughput and inflating input costs.
Water-Use Regulations Tightening
The Sustainable Groundwater Management Act (SGMA) basin plans in California, set to be finalized in 2025, will impose limits on groundwater withdrawals in the San Joaquin Valley. This region accounts for 79% of the state's citrus acreage, which relies heavily on deep wells[3]. To adapt, growers must either invest in drip irrigation systems, costing between USD 2,000 and USD 3,500 per acre, or purchase surface water allocations at USD 1,200 per acre-foot, reflecting a 40% price increase since 2023. Similarly, Florida growers face challenges as the Southwest Florida Water Management District enforces restrictions on water withdrawals during the critical bloom period. In Mexico, the water authority has initiated pilot volumetric tariffs in the Pánuco basin, indicating potential future costs for water usage. These developments render older flood-irrigated citrus blocks economically unviable, leading to their conversion into almond or avocado orchards, or even residential developments.
*Our forecasts treat driver/restraint impacts as directional, not additive. The impact forecasts reflect baseline growth, mix effects, and variable interactions.
Geography Analysis
The United States held 72.3% of the North America orange market size in 2025, supported by entrenched processing assets in Florida and California and robust retail distribution that anchors not-from-concentrate revenue streams. California offsets some losses with stable San Joaquin Valley output, yet Sustainable Groundwater Management Act pumping caps raise costs for orchard expansion. Texas registers consistent volumes under stringent vector-control regimes that have halted disease spread, but acreage remains insufficient to move the regional needle. Imports from Mexico rise as processors seek reliable fresh-fruit flows to maintain NFC lines, indicating that United States demand rather than supply drives its continuing revenue dominance.
Mexico, conversely, is the fastest-growing geography with a 4.8% CAGR to 2031, driven by early-2025 harvests and government subsidies that lower replanting cost barriers. Fresh-fruit exports to United States extraction plants shorten cycle times for NFC processing and bypass price friction from FCOJ futures. As newer orchards enter full production, Mexico captures incremental share of the North America orange market, while processor integration across the Texas border cements the country’s role as a reliable volume hedge. Government support through Producción para el Bienestar offsets replanting costs, while Senasica’s pest-free certification accelerates border clearance. As Valencia clones on Swingle citrumelo mature, yield per hectare climbs, and Mexico’s share of the North America orange market advances rapidly despite the country’s lower domestic consumption base.
Canada continues to act as a stabilizer for demand. The duty-free regime under the trade agreement with the United States and Mexico supports cost-efficient import flows, with the United States contributing 36% of total arrivals. Juice formats dominate the retail market due to cold weather, which limits the availability of fresh fruit during certain periods. While increasing competition from plant-based alternatives constrains growth potential, population growth and the emphasis on health messaging provide a stable baseline for North American suppliers. The Canadian market benefits from a well-established distribution network and consumer preference for convenience, both of which further support the dominance of juice formats. The trade agreement also ensures a steady supply chain, minimizing disruptions and maintaining consistent product availability.
Competitive Landscape
Moderate concentration defines the processor tier of the North America orange market, while the grower base remains highly fragmented. Florida’s Natural Growers manages more than 50 million gallons of annual NFC capacity and negotiates retailer-private-label contracts that require year-round delivery accuracy. Tropicana, under new private-equity ownership, refocused its Lake Wales and Fort Pierce facilities on premium lines and invested in digital traceability to validate origin claims. Coca-Cola leverages global procurement to secure concentrate and NFC for its Simply Orange brand, smoothing raw-fruit shortages through international blending. Processor competition centers on brand differentiation, cold-storage capacity, and risk management tools that hedge futures exposure.
Growers cluster into cooperatives to regain pricing power, but they still face asymmetric bargaining power. Large processors discount fruit that lacks documented IPM compliance, forcing smaller orchards to adopt certified practices or exit. Robotics pilots in California signal a capital-intensive path to labor flexibility, early adopters can secure processor bonuses for damage-free deliveries. Mexican exporters such as Citrofrut and Jugos del Valle exploit cost advantages and shorter shipping distances to Texas juice plants, eroding the delivered-cost edge once held by Florida.
Intellectual property advancements related to huanglongbing-tolerant germplasm are primarily driven by university-industry consortia funded by the United States Department of Agriculture. These consortia play a crucial role in research and development, ensuring that innovations in germplasm are effectively translated into practical applications. By fostering collaboration between academic institutions and industry stakeholders, these initiatives aim to address the challenges posed by huanglongbing. This approach facilitates the gradual dissemination of new varietal developments within the grower community, promoting long-term benefits for the agricultural sector and enhancing the resilience of citrus production systems.
Recent Industry Developments
- August 2025: The United States Food and Drug Administration (FDA) has proposed updating the 60-year-old standard of identity for pasteurized orange juice by reducing the minimum sugar content requirement from 10.5° Brix to 10.0°. This change is intended to support United States citrus growers and processors in addressing the decline in sugar levels in domestic fruit, without impacting taste or price for consumers.
- June 2025: The Florida Legislature approved USD 124.5 million for the state's citrus industry under the FY2025–26 budget, as the first phase of Senate President Ben Albritton's "Make Citrus Great Again" agenda. The allocation directed USD 100 million toward large-scale commercial field trials testing grove management, therapeutic tools, and disease-resistant variety plantings, with the remainder split across CRAFT Foundation programs, marketing support for 100% orange juice, nursery and equipment grants, and the Citrus Recovery Program.
- February 2025: Governor Ron DeSantis signed the FY2026–27 Florida state budget on June 29, 2026, committing USD 196 million to citrus recovery, including USD 160 million to the CRAFT Foundation for commercial-scale replanting field trials, USD 4.5 million for basic research, and USD 2 million each for the Citrus Recovery Program and Citrus Budwood Program. Combined with USD 124.5 million approved in FY2025–26, the two-year "Make Citrus Great Again" investment totals more than USD 320 million, the largest sustained state commitment to Florida citrus recovery on record.
North America Orange Market Report Scope
An orange is a citrus fruit, typically round and yellowish-orange. It contains a significant proportion of citric acid. The report includes an analysis of various parameters of the orange market.
The North America Orange Market Report is Segmented by Geography (North America). The Report Includes Production Analysis (Volume), Consumption Analysis (Value and Volume), Export Analysis (Value and Volume), Import Analysis (Value and Volume), Wholesale Price Trend Analysis, and More. The Market Forecasts are Provided in Terms of Value (USD) and Volume (Metric Tons).
By Geography
| North America | United States | Production Analysis (Area Harvested, Yield, and Production Volume) |
| Consumption Analysis (Consumption Value and Volume) | ||
| Import Market Analysis (Import Value, Volume, and Key Supplying Markets) | ||
| Export Market Analysis (Export Value, Volume, and Key Destination Markets) | ||
| Wholesale Price Trend Analysis and Forecast | ||
| Regulatory Framework | ||
| List of Key Players | ||
| Logistics and Infrastructure | ||
| Seasonality Analysis | ||
| Mexico | Production Analysis (Area Harvested, Yield, and Production Volume) | |
| Consumption Analysis (Consumption Value and Volume) | ||
| Import Market Analysis (Import Value, Volume, and Key Supplying Markets) | ||
| Export Market Analysis (Export Value, Volume, and Key Destination Markets) | ||
| Wholesale Price Trend Analysis and Forecast | ||
| Regulatory Framework | ||
| List of Key Players | ||
| Logistics and Infrastructure | ||
| Seasonality Analysis | ||
| Canada | Production Analysis (Area Harvested, Yield, and Production Volume) | |
| Consumption Analysis (Consumption Value and Volume) | ||
| Import Market Analysis (Import Value, Volume, and Key Supplying Markets) | ||
| Export Market Analysis (Export Value, Volume, and Key Destination Markets) | ||
| Wholesale Price Trend Analysis and Forecast | ||
| Regulatory Framework | ||
| List of Key Players | ||
| Logistics and Infrastructure | ||
| Seasonality Analysis | ||
| By Geography | North America | United States | Production Analysis (Area Harvested, Yield, and Production Volume) |
| Consumption Analysis (Consumption Value and Volume) | |||
| Import Market Analysis (Import Value, Volume, and Key Supplying Markets) | |||
| Export Market Analysis (Export Value, Volume, and Key Destination Markets) | |||
| Wholesale Price Trend Analysis and Forecast | |||
| Regulatory Framework | |||
| List of Key Players | |||
| Logistics and Infrastructure | |||
| Seasonality Analysis | |||
| Mexico | Production Analysis (Area Harvested, Yield, and Production Volume) | ||
| Consumption Analysis (Consumption Value and Volume) | |||
| Import Market Analysis (Import Value, Volume, and Key Supplying Markets) | |||
| Export Market Analysis (Export Value, Volume, and Key Destination Markets) | |||
| Wholesale Price Trend Analysis and Forecast | |||
| Regulatory Framework | |||
| List of Key Players | |||
| Logistics and Infrastructure | |||
| Seasonality Analysis | |||
| Canada | Production Analysis (Area Harvested, Yield, and Production Volume) | ||
| Consumption Analysis (Consumption Value and Volume) | |||
| Import Market Analysis (Import Value, Volume, and Key Supplying Markets) | |||
| Export Market Analysis (Export Value, Volume, and Key Destination Markets) | |||
| Wholesale Price Trend Analysis and Forecast | |||
| Regulatory Framework | |||
| List of Key Players | |||
| Logistics and Infrastructure | |||
| Seasonality Analysis | |||
Key Questions Answered in the Report
What is the current value of the North America orange market?
The market stood at USD 10.44 billion in 2025 and is projected to reach USD 13.51 billion by 2031.
Which country grows fastest within the region?
Mexico is forecast to expand at a 4.8% compound annual growth rate through 2031 due to climate advantages and subsidy-supported replanting.
Why are not-from-concentrate juices gaining share?
Consumers prefer fresh-taste profiles, and processors pay a 20-30% premium for oranges that meet NFC quality, lifting grower returns.
How does huanglongbing affect supply?
The disease has infected more than 90% of Florida acreage, cutting the state’s harvest to 15 million boxes in 2024-2025 and accelerating orchard removals.
Are robotic harvesters commercially viable today?
Field pilots achieve up to 90% pick rates, but unit costs near USD 250,000 limit adoption to large growers, wider rollout is anticipated after 2028 as costs fall.