
Microfluidics Market Size and Share
Market Overview
| Study Period | 2020 - 2031 |
|---|---|
| Market Size (2026) | USD 26.90 Billion |
| Market Size (2031) | USD 46.13 Billion |
| Growth Rate (2026 - 2031) | 11.39 % |
| Fastest Growing Market | Asia Pacific |
| Largest Market | North America |
| Market Concentration | Medium |
Major Players *Disclaimer: Major Players sorted in no particular order Image © Mordor Intelligence. Reuse requires attribution under CC BY 4.0. | |
Microfluidics Market Analysis by Mordor Intelligence
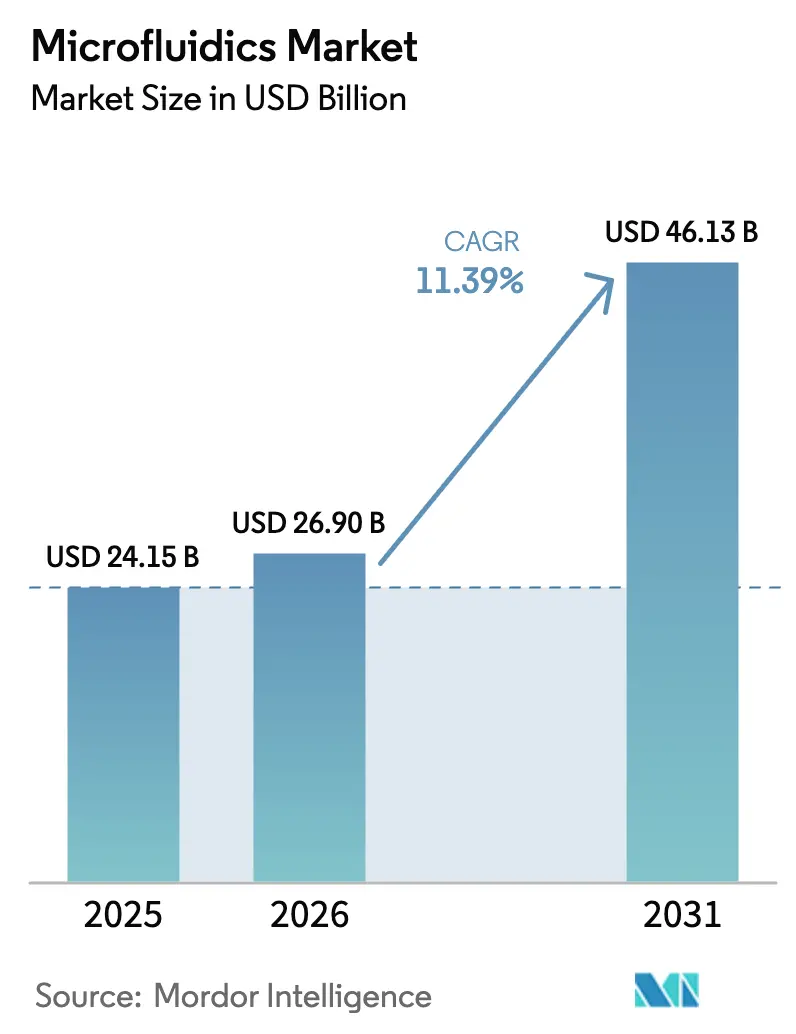
The Microfluidics Market size is projected to be USD 24.15 billion in 2025, USD 26.90 billion in 2026, and reach USD 46.13 billion by 2031, growing at a CAGR of 11.39% from 2026 to 2031.
The outlook reflects structural movement toward decentralized diagnostics, rapid integration of artificial intelligence into lab-on-chip systems, and rising adoption of single-cell assays across pharmaceutical research programs. Point-of-care platforms that combine sample preparation, amplification, and detection on a disposable cartridge shorten result times from hours to minutes, reducing hospital readmissions and improving antimicrobial stewardship. At the same time, drug developers deploy organ-on-chip technologies to model human physiology more accurately than animal studies, a practice reinforced by the FDA’s New Approach Methodologies initiative. Increasing investment by China, India, and Japan in diagnostic infrastructure accelerates demand in Asia-Pacific, while established reimbursement frameworks sustain North American procurement of advanced microfluidic analyzers.
Key Report Takeaways
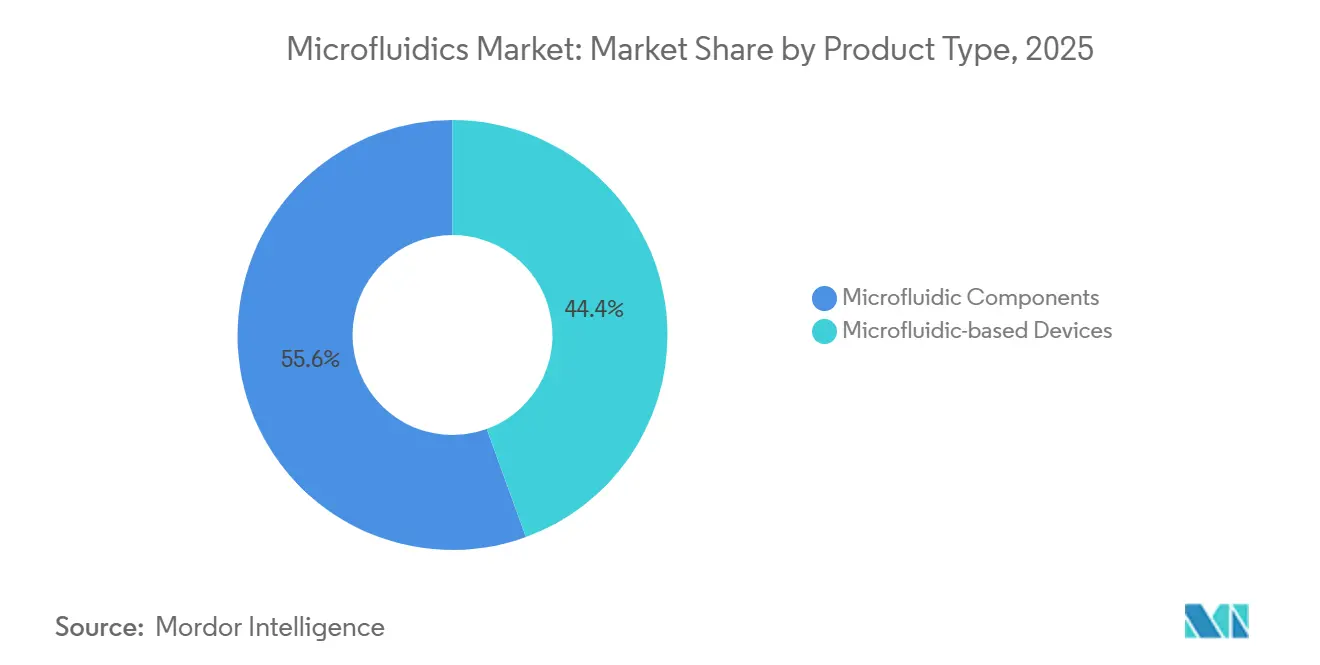
- By product type, microfluidic components held 55.56% of the microfluidics market share in 2025, and are forecast to record an 18.25% CAGR through 2031.
- By application, point-of-care diagnostics led with 38.53% revenue in 2025, while pharmaceutical & biotechnology research is set to grow fastest at a 19.85% CAGR.
- By material, polymer substrates captured 53.63% demand in 2025; paper & other porous substrates are projected to expand at a 19.87% CAGR.
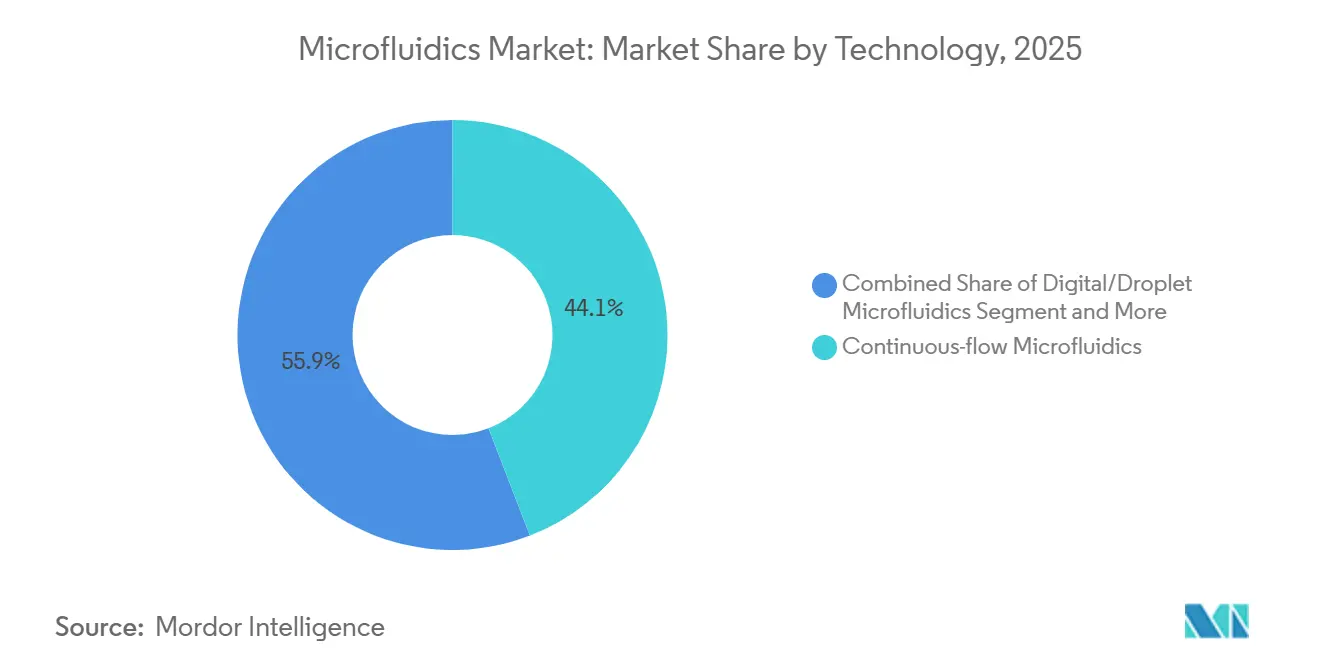
- By technology, continuous-flow systems accounted for 44.13% revenue in 2025, whereas organ-on-chip platforms will accelerate at a 22.7% CAGR.
- By end-user, pharmaceutical & biotechnology companies represented 40.3% of spending in 2025; diagnostic laboratories are predicted to progress at a 17.51% CAGR.
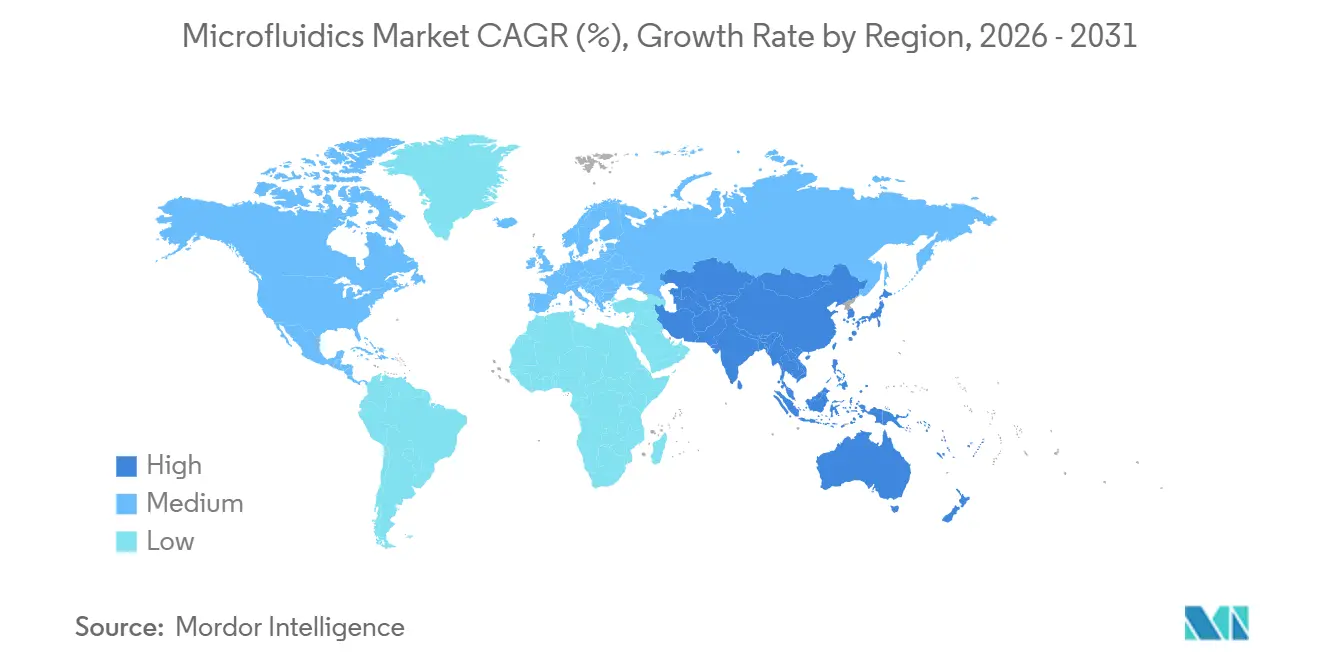
- By geography, North America commanded 34.13% regional revenue in 2025, yet Asia-Pacific is expected to post the fastest 14.81% CAGR through 2031.
Note: Market size and forecast figures in this report are generated using Mordor Intelligence’s proprietary estimation framework, updated with the latest available data and insights as of January 2026.
Market Trends and Insights
Drivers Impact Analysis of Microfluidics Market*
| Driver | (~) % Impact on CAGR Forecast | Geographic Relevance | Impact Timeline |
|---|---|---|---|
| Increasing demand for point-of-care testing | +2.8% | Global, with accelerated adoption in North America, Europe, and urban Asia-Pacific | Short term (≤ 2 years) |
| Rising incidences of chronic and infectious diseases | +2.3% | Global, particularly acute in Asia-Pacific and Middle East & Africa | Medium term (2-4 years) |
| Rapid turnaround time & device miniaturization | +1.9% | North America and Europe core, spillover to Asia-Pacific | Medium term (2-4 years) |
| AI-enabled lab-on-chip for decentralized molecular diagnostics | +2.1% | North America and Europe early adoption, Asia-Pacific scaling | Medium term (2-4 years) |
| Surge in single-cell assays for immuno-oncology & cell-therapy R&D | +1.7% | North America and Europe pharmaceutical hubs, emerging in China and Japan | Long term (≥ 4 years) |
| Source: Mordor Intelligence | |||
Increasing Demand for Point-of-Care Testing
Healthcare providers value rapid diagnostic answers that guide real-time therapeutic choices, cut emergency room congestion, and prevent repeat admissions. Microfluidic lateral-flow cartridges paired with optical readers deliver quantitative biomarker results in under 15 minutes, exemplified by the SepTec sepsis test that flags bloodstream infections at clinically relevant concentrations. During 2024-2025 the U.S. FDA granted 23 Emergency Use Authorizations for microfluidic COVID-19 assays, cementing an accelerated review precedent manufacturers now leverage for chronic disease tests. Reimbursement policy also aligns; Medicare’s ADLT framework offers favorable payment when assays demonstrate clinical utility, prompting hospitals to replace manual workflows with automated, closed microfluidic systems. The effect is immediate: demand for single-use cartridges that integrate extraction, amplification, and detection grows swiftly, especially in urgent-care clinics where skilled lab personnel are scarce. As supply chains stabilize, manufacturers focus on expanding test menus covering cardiac, metabolic, and respiratory panels, reinforcing the momentum of the microfluidics market.
Rising Incidences of Chronic and Infectious Diseases
A growing global burden of diabetes, cardiovascular disorders, and chronic kidney disease fuels continuous monitoring solutions that eliminate repeated venipuncture. Microfluidic sensors analyzing interstitial fluid or saliva suit pediatric and geriatric care, improving compliance and enabling tighter therapeutic control. At the same time, syndromic surveillance networks deploy multiplex PCR microfluidic chips that differentiate bacterial, viral, and parasitic pathogens in a single run, conserving reagents and shortening isolation decisions for suspected cases. The World Health Organization projects a 34% rise in non-communicable disease load across low- and middle-income regions by 2030, underscoring the urgency for affordable, low-power diagnostic formats[1]Global Health Estimates 2025, World Health Organization, who.int . Antimicrobial resistance screening benefits as well; microfluidic susceptibility assays provide drug-response profiles within 6 hours versus 48 hours for culture, supporting stewardship programs that limit empiric antibiotic use. Collectively, these factors propel the microfluidics market toward integrated devices capable of handling diverse sample matrices under minimal infrastructure constraints.
AI-Enabled Lab-on-Chip for Decentralized Molecular Diagnostics
Artificial intelligence converts microfluidic platforms from passive channels into adaptive diagnostic engines. Image-based algorithms that track droplet morphology, flow stability, and fluorescence dynamics self-correct reaction parameters, reducing false negatives when pathogen titers are low. Edge-compute modules embedded in handheld readers eliminate reliance on cloud connectivity, enabling deployment in rural clinics and field stations with intermittent internet. Regulatory bodies anticipate these hybrid devices; the FDA issued draft SaMD guidance in 2024 detailing algorithm validation expectations for in-vitro diagnostic contexts. Cytology benefits immediately: AI-driven imaging classifies cells with pathologist-level accuracy yet processes smears 10× faster, freeing specialist time. As machine-learning models ingest ever larger reaction datasets, on-cartridge decisions—such as dynamic thermal cycling adjustments—become routine, further differentiating the microfluidics market from conventional benchtop PCR workflows.
Surge in Single-Cell Assays for Immuno-Oncology and Cell-Therapy R&D
Pharmaceutical scientists rely on single-cell profiling to decipher tumor heterogeneity and immune-escape pathways. Microfluidic droplet systems barcode thousands of cells within minutes, accelerating sequencing-based discovery of resistance-driving subclones. Illumina’s Single Cell 3′ RNA Prep kit, launched in January 2025, reduced library preparation time from two days to six hours and integrates seamlessly with existing sequencers. Meanwhile, CAR-T manufacturers deploy microfluidic potency assays that confirm antigen-specific killing before infusion, responding to FDA feedback on batch variability that delayed approvals in 2024. Spatial transcriptomics, blending microfluidic slicing with in-situ sequencing, maps tumor-immune cell interplay, informing combination therapy design. These advances expand the microfluidics market beyond diagnostics into upstream drug discovery and advanced therapy manufacturing.
Restraints Impact Analysis of Microfluidics Market*
| Restraint | (~) % Impact on CAGR Forecast | Geographic Relevance | Impact Timeline |
|---|---|---|---|
| High capital cost & workflow integration challenges | -1.6% | Global, most acute in price-sensitive Asia-Pacific, Middle East & Africa, and South America | Short term (≤ 2 years) |
| Regulatory complexity across multi-jurisdiction clinical use | -1.3% | Global, particularly burdensome in Europe (IVDR), China (NMPA), and emerging markets | Medium term (2-4 years) |
| Limited reimbursement & low adoption in price-sensitive economies | -1.1% | Asia-Pacific (excluding Japan, South Korea), Middle East & Africa, South America | Long term (≥ 4 years) |
| Supply constraints in medical-grade elastomers & specialty polymers | -0.8% | Global manufacturing, with acute impact during geopolitical supply disruptions | Short term (≤ 2 years) |
| Source: Mordor Intelligence | |||
High Capital Cost and Workflow Integration Challenges
Purchasing a droplet digital PCR rig typically demands USD 150,000–250,000 upfront, while fully integrated organ-on-chip stations surpass USD 500,000 once ancillary microscopes, incubators, and service contracts are tallied. Laboratories operating under reimbursement pressure hesitate to commit, especially when payer reviews question incremental clinical benefit. Validation periods last 6–12 months as teams run microfluidic and legacy assays in parallel to satisfy CLIA precision criteria. UnitedHealthcare denied coverage for multiple microfluidic liquid-biopsy tests in 2024, citing insufficient utility evidence, signaling skepticism that slows smaller labs[2]UnitedHealthcare Lab Management Guidelines, UnitedHealthcare, uhc.com. Shared-service models now emerge: regional reference labs amortize equipment across pooled sample volumes, but adoption still lags in resource-constrained regions, restraining the microfluidics market.
Regulatory Complexity Across Multi-Jurisdiction Clinical Use
The European Union’s IVDR, fully enforced in May 2025, shifted 90% of in-vitro diagnostics—including most microfluidic cartridges—from self-declaration to notified-body review, yet only 23 bodies hold designation, extending approval queues. China’s NMPA mandates local clinical data even when international studies exist, adding 18–24 months to launch timelines and increasing intellectual-property risk. In the United States, FDA warning letters issued in 2024-2025 targeted laboratories offering microfluidic LDTs without adequate validation, underscoring stricter oversight. Efforts by the International Medical Device Regulators Forum to harmonize requirements remain slow, compelling manufacturers to maintain multiple documentation sets, which suppresses smaller entrants and tempers growth across the microfluidics market.
*Our forecasts treat driver/restraint impacts as directional, not additive. The impact forecasts reflect baseline growth, mix effects, and variable interactions.
Microfluidics Market Segment Analysis
By Product Type:
Components Drive Customization DemandMicrofluidic components accounted for a 55.56% microfluidics market size share in 2025 and are forecast to expand at an 18.25% CAGR to 2031, reflecting end-user preference for building bespoke workflows instead of adopting fixed instruments. Chips, pumps, and valves ordered à-la-carte enable researchers to tailor channel geometries, droplet diameters, and pressure profiles to specific biological assays. High-throughput screening groups favor droplet-generation chips that partition nanoliter reactions, conserving costly reagents. Microneedle arrays grow swiftly inside transdermal vaccine studies, broadening component demand. In parallel, integrated devices continue to secure regulatory clearances for point-of-care diagnostic use, yet their slower update cycle prevents rapid pivot to emerging assays, sustaining component momentum within the microfluidics market.
A second factor is the rise of open-hardware communities publishing photomask files and control scripts under permissive licenses, accelerating academic adoption. Contract manufacturers in South Korea and Taiwan offer short-run PDMS and cyclic-olefin-polymer fabrication at competitive pricing, lowering entry barriers. The component-centric supply chain therefore promotes experimentation in single-cell sequencing, organoid culture, and gradient generation, reinforcing the centrality of components to overall microfluidics market expansion.


By Application:
Pharma Research Outpaces Point-of-Care GrowthPoint-of-care diagnostics led 38.53% of 2025 revenue, yet pharmaceutical & biotechnology research is projected to register a 19.85% CAGR, lifting its microfluidics market share as drug discovery groups prioritize reagent savings and assay miniaturization. Droplet microfluidics reduces library screening volumes by up to 1,000-fold, enabling biopharma to test wider compound ranges at constant budget. Contract research organizations, such as Charles River, scaled droplet-based platforms in 2025 to meet sponsor demand, reinforcing commercial traction.
Proteomics advances further amplify research pull: Thermo Fisher’s integration of Olink’s proximity-extension assay yields 5,000-protein panels processed on microfluidic cartridges, equipping translational studies with multiplexed readouts. In diagnostics, rapid syndromic panels sustain cartridge volumes in emergency and critical-care units, but reimbursement vigilance caps price ceilings. Drug-delivery applications remain exploratory, though microfluidic-fabricated nanoparticles show promise for mRNA and siRNA payloads, implying new medium-term revenue avenues for the microfluidics market.
By Material:
Paper Substrates Challenge Polymer DominancePolymer substrates held 53.63% of demand in 2025, yet paper and other porous materials will climb at a 19.87% CAGR as healthcare planners in India and Africa prioritize sub-USD 1 lateral-flow strips. Wax-patterned cellulose channels move fluid via capillarity without external pumps, aligning with intermittent power grids. Development groups pair these substrates with smartphone-based readouts, circumventing the need for dedicated analyzers. Meanwhile, silicone and glass retain niches in high-temperature PCR and optical analytics where PDMS absorption or auto-fluorescence poses obstacles, preserving polymer dominance but opening plural material workflows that broaden the microfluidics market.
ISO Technical Committee 229 released guidance on material characterization in 2024, yet proprietary chemistries remain common as manufacturers seek assay stability and intellectual-property protection. Supply shortages of medical-grade PDMS during 2025 geopolitical disruptions highlighted vulnerability, prompting diversified sourcing strategies and spurring interest in thermoplastics with injection-mold compatibility. This diversification mitigates risk and supports sustained growth across the microfluidics market.
By Technology:
Organ-Chips Redefine Preclinical ModelsContinuous-flow configurations contributed 44.13% of 2025 revenue due to predictable residence times critical in chemical synthesis and gradient studies. However, organ-on-chip systems are poised for a 22.7% CAGR as regulatory pressure mounts for animal-free safety testing. Bio-Techne’s acquisition of Lunaphore brought spatial-biology chips that stain 40 protein markers on tissue sections, enabling high-content pharmacodynamic readouts. Droplet digital microfluidics accelerates rare-variant detection down to 0.01% allele frequency, bolstering liquid biopsy sensitivity. Emerging electrowetting and acoustofluidic platforms manipulate samples without contact, protecting fragile stem-cell cultures and supporting regenerative-medicine pipelines.
Technology selection now influences downstream bioinformatics; droplet-based assays produce massive single-reaction datasets, requiring tailored analytics stacks. Vendors that bundle chemistry, instrumentation, and cloud pipelines differentiate amid a crowded microfluidics market, driving consolidation among toolmakers.

By End-User:
Diagnostic Labs Accelerate AutomationPharmaceutical & biotechnology firms generated 40.3% of 2025 expenditure, leveraging microfluidic high-throughput platforms to shorten lead-optimization cycles and cut reagent usage. These organizations employ specialized engineers who manage dedicated chip-fabrication suites, amortizing costs across broad portfolios. Diagnostic laboratories will rise at a 17.51% CAGR to 2031 as automation reduces technician intervention and supports 24/7 sample runs that meet hospital turnaround targets.
Academic centers prioritize flexible, open-design chips for proof-of-concept studies, often fabricating molds in-house. Hospitals procure sealed-cartridge analyzers for emergency departments, valuing CLIA-waived status and minimal maintenance. Contract research and manufacturing outfits expand microfluidic service menus—cell-line development, potency testing, and biomarker validation—providing an outsourced path for companies lacking in-house hardware. Combined, these dynamics reinforce end-user diversity that sustains the microfluidics market.
Geography Analysis
North America Microfluidics Market
North America retained 34.13% revenue share in 2025, anchored by FDA pathways that expedite clinical testing of microfluidic diagnostics and by Medicare ADLT reimbursement that rewards novel assays demonstrating utility. Venture investment clusters around Boston and the San Francisco Bay Area create rapid iteration loops between startup innovators and pharmaceutical clients. National Institutes of Health programs, such as All of Us, supply millions of biospecimens, ensuring pipeline demand for high-throughput microfluidic preparation kits.
APAC Microfluidics Market
Asia-Pacific is projected to lead growth at a 14.81% CAGR through 2031 as China’s 14th Five-Year Plan channels USD 15 billion toward domestic medical-device development, officially naming microfluidics a strategic priority[3]China’s 14th Five-Year Plan for Medical Equipment, State Council of the People’s Republic of China, gov.cn. India’s primary-care upgrade programs mandate decentralized diagnostics, perfect for paper-based chips that function without cold chain. Japan’s aging society drives home-based monitoring devices, while South Korea’s semiconductor prowess lowers chip-fabrication costs. Australia hosts early-stage clinical trials, serving as a launchpad into Southeast Asia.
Europe Microfluidics Market
Europe demonstrates robust academic publication output but slower clinical adoption. The IVDR extension of conformity assessments burdens small manufacturers, extending time to market. Germany’s pharma cluster maintains sizeable microfluidic research instrumentation, yet reimbursement uncertainty in France and Italy delays hospital purchases. Post-Brexit divergence adds further complexity for firms targeting both the United Kingdom and EU27. Despite these hurdles, collaborative projects funded under Horizon Europe sustain R&D momentum, preserving relevance of the microfluidics market across the continent.

Regulatory Landscape
Microfluidic diagnostics and lab-on-chip systems are governed mainly through in-vitro diagnostic and medical-device regulatory frameworks, with tighter evidence and documentation expectations in major markets. In the European Union, Regulation (EU) 2017/746 (IVDR) moved most IVDs, including many microfluidic cartridges, into notified-body assessment, and full enforcement in May 2025 increased the compliance load for performance evaluation and technical documentation, extending timelines for smaller manufacturers.
In the United States, microfluidics used in medical devices is increasingly shaped by FDA CDRH’s regulatory-science work, including targeted activity under the Office of Science and Engineering Laboratories Microfluidics Program and practical measurement tools such as the FDA flow-resistivity measurement user manual released in October 2025. Standardization is also advancing: ISO/TC 48/SC 10 (microfluidic devices) was established in 2026, and ISO/TS 6417:2025 supports more consistent communication of microfluidic pump symbols and performance, helping suppliers and OEMs align design inputs and verification practices across jurisdictions.
Competitive Landscape
The microfluidics market features moderate fragmentation with accelerating consolidation. Thermo Fisher’s USD 3.1 billion purchase of Olink in July 2024 integrated proximity-extension assays into a proteomics workflow alongside Orbitrap mass spectrometers, expanding the buyer’s end-to-end analytics suite. Illumina followed by acquiring Fluent BioSciences, securing digital-microfluidics IP for single-cell library prep and defending share against low-cost challengers.
Niche startups focus on organ-on-chip disease models; Emulate and Hesperos partner with drug sponsors seeking predictive toxicity data that satisfies FDA NAMs guidance. Meanwhile, Bio-Rad’s QX600 droplet digital PCR launch in 2024 increased throughput 6-fold, raising competitive stakes in mutation-detection platforms. Patent density in droplet-generation and electrokinetics pressures newcomers to pursue application-specific claims or new materials to avoid litigation.
Strategic alliances complement acquisitions. Thermo Fisher and Seer entered a co-marketing pact in November 2024 to combine microfluidic proteograph sample prep with mass-spectrometry detection for high-definition proteomics. Such workflow bundling attracts customers seeking one-vendor accountability, challenging point-solution vendors. Overall, competitive dynamics reward firms offering tightly integrated chemistries, instruments, and bioinformatic pipelines that reduce buyer integration burden.
Microfluidics Industry Leaders
Bio-Rad Laboratories Inc.
Illumina Inc.
PerkinElmer, Inc.
Standard BioTools (Fluidigm)
Agilent Technologies
- *Disclaimer: Major Players sorted in no particular order

Microfluidics Market Companies Covered in this Report
- Abcam
- Agilent Technologies
- Becton Dickinson & Co.
- Bio-Rad Laboratories
- Biosurfit
- Dolomite Microfluidics (Blacktrace/Unchained Labs)
- Dropworks Inc.
- Emulate
- Fluigent
- Hesperos
- Illumina
- Micronit
- PerkinElmer
- QuidelOrtho
- Sphere Fluidics Ltd.
- Standard BioTools (Fluidigm)
- Thermo Fisher Scientific
- ZEON Corporation

Market Opportunities and Future Outlook
The most immediate opportunities sit in scaling microfluidic manufacturing and expanding test menus for decentralized diagnostics, where integrated sample preparation, amplification, and detection drive higher cartridge volumes. Recent company actions point to investment in semi-automated and regionalized production footprints. In June 2026, Scope Fluidics (via Bacteromic) secured a new location for a semi-automated production line for antibiotic susceptibility testing panels, with a stated annual capacity target of 350,000 units. Micronic also announced in November 2025 a new 15,000 sq ft manufacturing facility in Coatesville, Pennsylvania, with completion scheduled for September 2026. On the supply side, Microbritt’s March 2025 move to a larger facility in Cramlington, including a tenfold increase in operational space, also reflects ongoing demand for precision microfabrication capacity that supports chips, tooling, and short-run production.
A second area of whitespace is standardization and regulatory enablement for microfluidic performance verification, since it affects time-to-clearance and multi-region commercialization. FDA’s Microfluidics Program and related measurement initiatives, alongside the formation of ISO/TC 48/SC 10 and metrology work such as the MFMET II project (started June 2025), create a pathway to reduce custom, one-off validation approaches that slow adoption, particularly under the EU IVDR environment. As more platforms incorporate AI-enabled analytics and single-cell workflows, vendors that bundle validated chips, reagents, and software into end-to-end offerings gain more procurement traction with hospitals, diagnostic laboratories, and biopharma research programs that are aiming to reduce workflow integration burden and shorten validation cycles.
Recent Industry Developments in Microfluidics Market
- January 2026: Standard BioTools completed the sale of SomaLogic to Illumina for USD 350 million upfront cash, with up to USD 75 million in earnout payments tied to 2025 and 2026 performance targets. The transaction sharpened Standard BioTools' focus on its core mass cytometry and microfluidics tools while transferring a high-profile proteomics asset into Illumina's ecosystem, shaping competitive bundling across multi-omics workflows.
- July 2025: Bio-Rad expanded its droplet digital PCR lineup with new platform rollouts following its acquisition activity around digital PCR capabilities. The broader, higher-throughput ddPCR offering strengthens Bio-Rad's position in mutation detection and applied research workflows that rely on microfluidic partitioning, raising performance and automation benchmarks for competing systems.
- February 2024: Standard BioTools entered a long-term agreement with Next Gen Diagnostics to manufacture the NGD-100, a microfluidics-based system designed to optimize pathogen whole genome sequencing library preparation. The arrangement extends microfluidics into pathogen genomics workflow automation and provides an OEM-style route to scale a specialized platform without requiring the partner to build manufacturing infrastructure from scratch.


Microfluidics Market Report Scope and Research Methodology
Market Definition and Coverage
For this study, the microfluidics market covers the revenue earned from products and enabling tools that manipulate very small fluid volumes in micro-scale channels, which are used to run tests, separation, and analysis workflows in lab and clinical settings.
Scope exclusions: We do not count general laboratory consumables that are not purpose-built for microfluidic flow control or on-chip fluid handling.
Segments Covered in This Report
- By Product Type
- Microfluidic-based Devices
- Microfluidic Components
- Microfluidic Chips
- Micro-pumps
- Microneedles
- Other Components
- By Application
- Drug Delivery
- Point-of-care Diagnostics
- Pharmaceutical & Biotechnology Research
- High-throughput Screening
- Proteomics
- Genomics
- Cell-based Assay
- Capillary Electrophoresis
- Other Pharma/Biotech Research
- Clinical Diagnostics
- Other Applications
- By Material
- Polymer
- Silicone
- Glass
- Paper & Other Porous Substrates
- By Technology
- Continuous-flow Microfluidics
- Digital/Droplet Microfluidics
- Organ-on-Chip & Tissue-chip
- Acoustofluidics & Electrowetting
- Centrifugal & Paper-based Microfluidics
- By End-user
- Pharmaceutical & Biotechnology Companies
- Diagnostic Laboratories
- Academic & Research Institutes
- Hospitals & Clinics
- Contract Research & Manufacturing Organisations
- By Geography
- North America
- United States
- Canada
- Mexico
- Europe
- Germany
- United Kingdom
- France
- Italy
- Spain
- Rest of Europe
- Asia-Pacific
- China
- Japan
- India
- South Korea
- Australia
- Rest of Asia-Pacific
- Middle East & Africa
- GCC
- South Africa
- Rest of Middle East & Africa
- South America
- Brazil
- Argentina
- Rest of South America
- North America
Data Sources, Market Sizing, and Validation
Desk Research
Desk research was used to set the factual base for the model and to keep assumptions anchored to real-world adoption. We relied on public sources such as the US FDA databases for diagnostics and device clearances, the US National Institutes of Health (NIH) funding and project records, the World Health Organization (WHO) program updates tied to infectious disease testing, and the World Bank macro indicators that help explain lab spend capacity by region.
To translate this context into sizing inputs, we also reviewed patent databases to spot technology intensity shifts (for example, lab-on-chip and flow control related filings) and checked scientific literature for usage patterns in sample prep and assay formats. On top of that, we used company filings, investor presentations, product catalogs, and credible press coverage to understand pricing direction, product mix changes, and distribution footprints, and then we sanity-checked select company financial signals using paid subscriptions for company intelligence and news and financials. The sources listed here are illustrative only, and many other public and paid references were used to collect, cross-check, and clarify data points.
Primary Interviews and Surveys
Primary work was done to confirm where demand is actually coming from and to close gaps that public data cannot explain well, such as current purchasing criteria and the practical split between research use and routine testing. We spoke with a mix of manufacturers, channel partners, lab decision makers, and technical users across major regions so we could validate adoption, pricing logic, and the pace of new application uptake before locking the final model.
Distribution of primary research fieldwork respondents
| Company type | Respondent position | Region |
|---|---|---|
| Top tier: 26% | CXOs: 14% | APAC: 49% |
| Mid tier: 60% | Functional/Unit leaders: 34% | EMEA: 29% |
| Smaller Players: 14% | Managers: 52% | Americas: 22% |
Market-Sizing & Forecasting
Sizing started with a top-down build where the demand pool was reconstructed using diagnostics and life science testing activity, R and D intensity, and the penetration of microfluidic workflows into those pipelines. Once that ceiling was set, we corroborated totals using selective bottom-up approximations, including a sampled ASP x volume build for common chip and cartridge formats and a channel check on instrument placements, which then helped adjust outliers.
Inputs used in the model include the pace of point-of-care and near-patient testing adoption, funding and publication intensity linked to micro-scale assay development, regulatory approvals for microfluidic-enabled diagnostics, average selling price progression by product class (instruments versus consumables), and regional lab capacity trends that influence purchasing cycles. Where company disclosures were incomplete, gaps were handled by applying conservative penetration rates supported by expert feedback, and then rechecking implied revenue per installed base.
Forecasts were produced using scenario analysis, where growth drivers such as testing mix, R and D budgets, and pricing pressure were varied within realistic bands and then reviewed with interview feedback to settle on a practical base case.
Data Validation & Update Cycle
Outputs were validated by cross-checking the model against independent signals like diagnostic test volumes, funding trajectories, and observed pricing ranges from catalogs and interviews. When a region or product line showed a sharp jump, it was flagged for a second review, followed by a return call to selected respondents to confirm whether the change was real or a data artifact.
Before sign-off, assumptions and calculations go through multi-step analyst review so definitions, currency conversions, and unit logic remain consistent throughout the file. Reports are refreshed annually, with interim updates triggered by material events, and a final pre-delivery pass is done so clients receive the most current view.
Mordor Intelligence's Microfluidics Market Sizing Compared With Other Published Estimates
Published values for microfluidics can look far apart even when they are all describing a growing market, because each publisher draws boundaries differently and refreshes key inputs on its own schedule. Differences usually show up around what gets counted as microfluidics-enabled revenue, how fast prices are assumed to move, and how currency conversion timing is handled when regional sales are aggregated.
A common gap driver is scope expansion into adjacent lab automation or broader diagnostics hardware, which can inflate totals if the microfluidics element is not isolated. Another driver is ASP logic, where some models assume faster price increases for consumables or apply uniform pricing across regions without enough channel validation. In addition, a slower refresh cadence can miss recent pricing resets and near-term demand swings, while a faster update cycle can capture these changes but requires more frequent validation checks.
Benchmark comparison
| Source | Market Size | Gaps in Research Methodology |
|---|---|---|
| Mordor Intelligence | USD 24.15 B (2025) | |
| Global Consultancy A | USD 41.92 B (2025) | Often uses a wider revenue perimeter across research and diagnostics, and may not separate microfluidics-specific content from adjacent device and workflow value when aggregating regional totals. |
| Industry Publisher B | USD 30.66 B (2025) | Can apply more aggressive near-term growth and pricing uplift assumptions, with less clarity on currency conversion timing and how validation checks were used to filter overlapping categories. |
The spread in the table mostly traces back to boundary setting and how frequently pricing and conversion assumptions are refreshed. By rechecking ASP movement and currency timing during updates, Mordor Intelligence keeps the 2025 value tied to microfluidics-specific demand signals instead of broader lab spend rollups.


Key Questions Answered in the Report
What is the projected revenue for the microfluidics market in 2031?
The microfluidics market is expected to reach USD 46.13 billion by 2031, reflecting an 11.39% CAGR from 2026 to 2031.
Which segment is growing fastest within microfluidic applications?
Pharmaceutical & biotechnology research is forecast to expand at a 19.85% CAGR, outpacing point-of-care diagnostics through 2031.
Why are organ-on-chip technologies attracting investment?
They model human physiology more accurately than animal studies, align with FDA New Approach Methodologies, and show the highest 22.7% CAGR among technologies.
How does Asia-Pacific compare to North America in growth?
Asia-Pacific is projected to grow at a 14.81% CAGR, faster than North America, driven by large-scale healthcare infrastructure spending in China, India, and Japan.
What hampers adoption among smaller diagnostic laboratories?
High capital costs of USD 150,000-500,000 per platform, extended validation timelines, and uncertain reimbursement slow uptake for smaller facilities.
Page last updated on:





