
Hazelnut Market Size and Share
Hazelnut Market Analysis by Mordor Intelligence
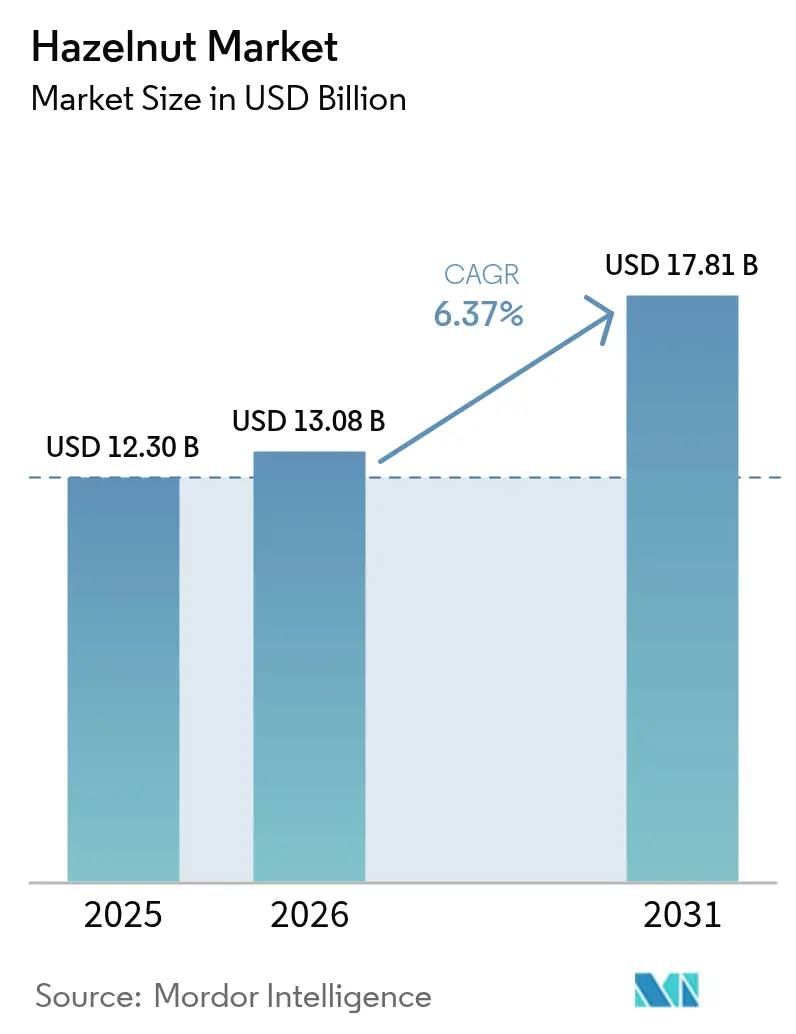
The hazelnut market size is expected to grow from USD 12.3 billion in 2025 to USD 13.08 billion in 2026 and is forecast to reach USD 17.81 billion by 2031 at 6.37% CAGR over 2026-2031. Rising confectionery demand and sustained interest in plant-based nutrition support this trajectory. Recent severe frost damage significantly reduced hazelnut production, prompting producers to expand operations into Romania, Chile, and the United States to reduce supply risks. The Asia-Pacific region's increasing demand for premium nuts has redirected trade flows from Europe and increased high-quality kernel prices. Global chocolate manufacturers are implementing vertical integration, while the United States' adoption of mechanized harvesting is changing industry cost structures. To meet stringent buyer requirements, exporters are implementing quality certification and traceability systems. South American producers are leveraging favorable climate conditions and competitive labor costs to challenge established suppliers. The hazelnut supply chain participants are adapting their strategies to address growing consumer emphasis on sustainability and ethical sourcing.
Key Report Takeaways
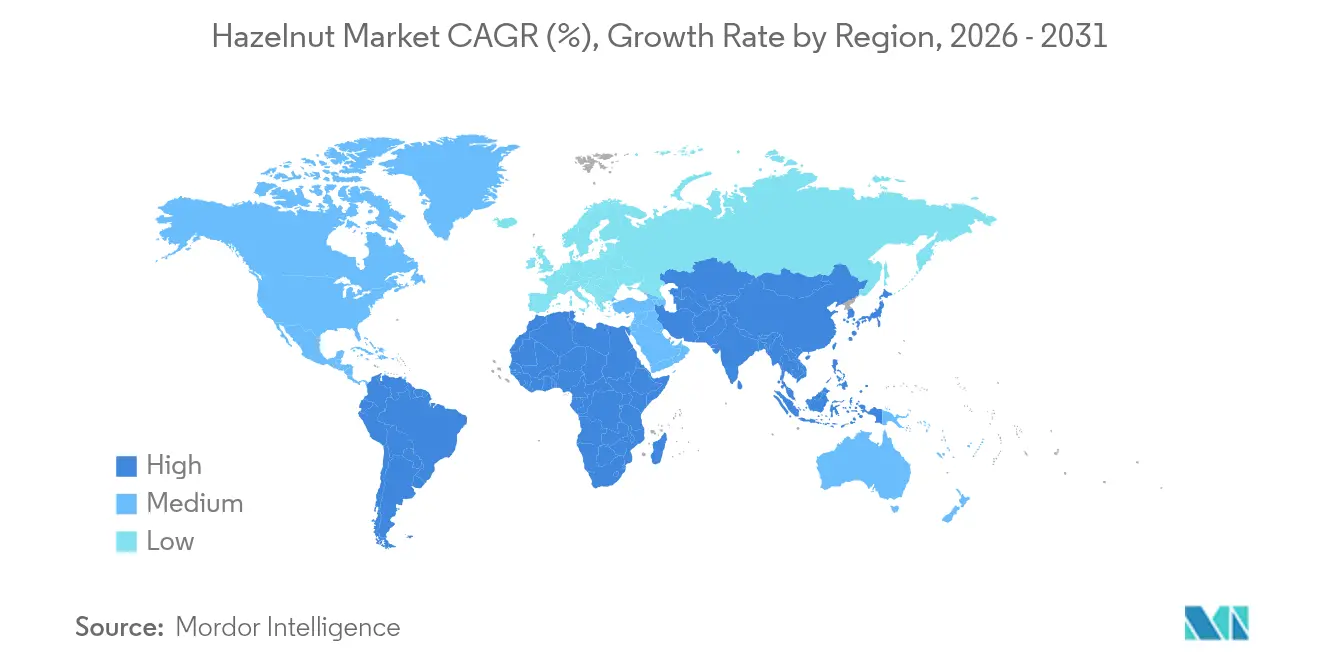
- By geography, Europe led with 63.20% of the hazelnut market share in 2025, while Asia-Pacific is growing fastest at a 6.68% CAGR through 2031.
Note: Market size and forecast figures in this report are generated using Mordor Intelligence’s proprietary estimation framework, updated with the latest available data and insights as of 2026.
Global Hazelnut Market Trends and Insights
Drivers Impact Analysis*
| Driver | (~) % Impact on CAGR Forecast | Geographic Relevance | Impact Timeline |
|---|---|---|---|
| Rising Demand from Confectionery and Spreads | +1.8% | Europe and North America | Medium term (2-4 years) |
| Backward-integration by Global Chocolate Majors | +1.2% | Turkey, Romania, Chile, and United States | Long term (≥ 4 years) |
| Adoption of Sustainable Agro-forestry Practices | +0.8% | Turkey, Italy, and emerging producers | Long term (≥ 4 years) |
| Mechanized Harvesting and Post-harvest Innovations | +0.7% | United States, Italy, and Chile | Medium term (2-4 years) |
| Emerging Demand in Plant-based Dairy Alternatives | +0.6% | North America, Europe, and Asia-Pacific | Short term (≤ 2 years) |
| Government-funded Climate-resilient Cultivar Research and Development | +0.4% | United States, European Union, and Turkey | Long term (≥ 4 years) |
| Source: Mordor Intelligence | |||
Rising Demand from Confectionery and Spreads
The global hazelnut market is primarily driven by chocolate, biscuit, and spread manufacturers, with Ferrero expanding its market presence through the WK Kellogg acquisition and subsequent integration of hazelnuts into breakfast products. Italian scientists have demonstrated that Tonda Gentile Romana hazelnut extracts can inhibit liver cancer cell growth in laboratory conditions, enhancing the ingredient's functional appeal.[1] ENEA, “Health: ENEA research proves anti-cancer potential of hazelnuts,” enea.it The growing demand has strengthened price stability and increased competition for certified, premium-quality hazelnuts. Consumer preference for nutritious ingredients has positioned hazelnuts as both an indulgent and functional food component, leading to product innovations across multiple categories, including granola and dairy alternatives. The market also shows increased emphasis on origin verification and traceability systems, particularly in the premium segment.
Backward-integration by Global Chocolate Majors
Ferrero's acquisition of Turkish supplier Oltan demonstrated its move toward complete supply chain control, which competitors are now adopting. The company provides research grants to Oregon State University and Rutgers University to develop frost-resistant hazelnut varieties, strengthening its domestic sourcing capabilities and climate adaptation. Ferrero established a large-scale plantation in Romania dedicated to its supply chain, showing how major buyers are developing new production centers. These initiatives protect against climate-related disruptions and influence market negotiations. The company's investments in production facilities and research establish a model for vertical integration that improves product tracking and quality control. This approach to supply chain management is becoming increasingly common among premium confectionery manufacturers as global demand grows.
Adoption of Sustainable Agro-forestry Practices
Hazelnut trees contribute to climate resilience and soil health through carbon sequestration and reduced pesticide requirements. Integrating hazelnuts into agroforestry systems improves biodiversity and land productivity. The Food and Agriculture Organization (FAO) identifies these systems as essential components of sustainable land management and carbon capture strategies. Ferrero's Hazelnut Charter implements regenerative farming practices and traceability measures that align with the European Union's Farm to Fork Strategy. The International Labour Organization (ILO) and the Association of Chocolate, Biscuits and Confectionery Industries of Europe (CAOBISCO) support initiatives in Turkey to enhance labor conditions and productivity in hazelnut farming, ensuring ethical sourcing practices.[2]ILO, "Elimination of Worst Forms of Child Labor in Seasonal Agriculture in Hazelnut Harvesting in Türkiye," ilo.orgThe industry's focus on sustainability addresses both regulatory compliance and brand value. These agricultural approaches reduce operational costs, stabilize production, and strengthen resilience to climate-related challenges.
Mechanized Harvesting and Post-harvest Innovations
Mechanized hazelnut orchards in Oregon demonstrate higher efficiency compared to traditional hand-harvesting methods, reducing labor costs and maintaining consistent kernel quality. This mechanization makes large-scale production economically viable in regions with higher wages. Advanced post-harvest technologies, including infrared scanning systems, enable processors to detect rancidity in sealed packages, reducing waste and maintaining quality standards. Mechanical harvesting and sorting equipment increase operational efficiency in areas with high labor costs. These technological improvements reduce market entry barriers for new producers and enable expansion into non-traditional growing regions. The increasing adoption of automation supports geographic diversification of hazelnut production and strengthens supply chain stability.
Restraints Impact Analysis*
| Restraint | (~) % Impact on CAGR Forecast | Geographic Relevance | Impact Timeline |
|---|---|---|---|
| Climate-driven Pest and Disease Outbreaks | -1.4% | Turkey, Italy, and emerging producers | Short term (≤ 2 years) |
| Volatile Ocean-freight Rates Compressing Exporter Margins | -0.9% | Global trade routes, Turkey, and Europe | Medium term (2-4 years) |
| Stricter Pesticide-residue Regulations | -0.6% | European Union imports and global exporters | Medium term (2-4 years) |
| Heightened Traceability and Sustainability Compliance Costs Imposed by Downstream Brands | -0.5% | Global supply chains and developing growers | Long term (≥ 4 years) |
| Source: Mordor Intelligence | |||
Climate-driven Pest and Disease Outbreaks
Hazelnut-producing regions face increasing climate and disease pressures that affect production patterns. In Europe, the spread of Fusarium infections threatens crop yields and requires additional biosecurity measures. North American producers continue to manage Eastern Filbert Blight, implementing strict monitoring protocols and resistant varieties. Global temperature increases worsen these challenges by promoting aflatoxin contamination in warm, humid conditions, which affects food safety standards and export capabilities. Producers are responding through investments in cold-storage infrastructure and disease-resistant variety development. These necessary adaptations increase operational costs, affecting profit margins and operational strategies. The industry is evolving toward more technology-driven practices across traditional and emerging production regions.
Volatile Ocean-freight Rates Compressing Exporter Margins
Global hazelnut supply chains face challenges from increased freight rates and logistical disruptions. Transportation costs are anticipated to increase consumer prices by 0.6% in 2025, affecting exporter margins and industry pricing.[3]UNCTAD, “Freight rates, maritime transport costs and their impact on consumer prices,” unctad.org Delays at major shipping routes, including the Suez and Panama Canals, combined with labor strikes on the United States East Coast, are impacting raw hazelnut kernel deliveries to processing facilities. These disruptions extend delivery times and require costly alternative routing and additional shipping insurance. Exporters across Europe, North America, and emerging hazelnut-producing regions are increasing their logistics risk management spending. The unstable transportation environment has prompted producers and processors to strengthen their supply chain resilience through route diversification and regional processing capabilities.
*Our forecasts treat driver/restraint impacts as directional, not additive. The impact forecasts reflect baseline growth, mix effects, and variable interactions.
Geography Analysis
Europe holds 63.20% of the hazelnut market size in 2025, supported by its advanced processing infrastructure and established expertise. Germany and Italy are primary importers, utilizing extensive roasting and paste-making facilities to supply regional confectioners. European processors leverage integrated logistics and quality systems, incorporating sustainability certifications and carbon-positive cultivation zones. Increased demand from Asian buyers is elevating kernel prices, affecting procurement strategies. The emergence of new plantations in Romania and Chile may gradually reduce Europe's market share despite its current strong position.
Asia-Pacific demonstrates a 6.68% CAGR, leading all regions due to increased disposable incomes and health-conscious consumption patterns. Urban consumers show growing preference for nut-infused products, including chocolate, bakery items, and plant-based beverages, particularly in tier-one cities. Retailers are expanding their product range with hazelnut cereal bars and flavored milks, increasing per-capita nut consumption. The maturation of domestic hybrid orchards may reduce import requirements. The region's move toward self-sufficiency creates a market environment where premium positioning and wellness attributes are essential for maintaining margins.
North America has transformed from a net importer to an emerging exporter through mechanized harvesting and disease-resistant cultivars, particularly in Oregon. The region experiences growth in domestic consumption, primarily in plant-based dairy and artisanal spreads, while simultaneously increasing export volumes. Canada continues as a significant buyer, though internal demand influences market patterns. Concurrently, South American and Eastern European producers are developing new orchards and sustainable agro-forestry systems, diversifying global supply and creating additional competition for traditional hazelnut producers.


Regulatory Landscape
Hazelnut trade is shaped by food-safety limits on contaminants and by formal grade and inspection rules in key importing markets. In the European Union, maximum levels for aflatoxins in hazelnuts are set under Regulation (EU) 2023/915, and official sampling and analysis rules for mycotoxins are defined under Regulation (EU) 2023/2782, which raises compliance expectations for exporters selling to EU buyers.
EU border controls also add pressure on origins flagged as higher risk for aflatoxin. Under Commission Implementing Regulation (EU) 2019/1793 and its updates, consignments from selected third countries face reinforced documentary, identity, and physical checks; in June 2026, the European Commission adopted Commission Implementing Regulation (EU) 2026/1206, updating check frequencies for high-risk food consignments entering the EU. In the United States, the USDA framework for hazelnuts includes minimum grade, size, and quality requirements under 7 CFR Part 982, and Section 8e import requirements apply for handlers shipping lots above defined thresholds, aligning import quality with domestic marketing order standards.
Value Chain Analysis
The hazelnut value chain starts with nursery and planting material, moves through orchard establishment and farm inputs, and then covers harvesting and on-farm drying. It then shifts to primary processing (husking, shelling, cleaning, grading) and secondary processing (roasting, chopping, grinding into paste/praline), before flowing through traders and exporters, ingredient users, and branded food manufacturers. Turkey remains central to global supply, while Italy, Azerbaijan, Georgia, Chile, and the United States act as complementary origins supporting international trade and the industrial ingredient channel.
Risk and value capture concentrate at post-harvest and processing stages, since drying and storage discipline affect moisture stability and aflatoxin risk, and since shelling throughput and sorting capability influence exportable yield and defect rates. The chain is also increasingly shaped by coordinated industry programs and buyer requirements: AREFLH’s Corylus Europae Group aligns a large share of European production around shared technical priorities, including pest-related coordination, while the INC Sustainability Certification gives growers, processors, and trade specialists a common way to document sustainability and responsible practices across origins. Downstream chocolate and spread manufacturers are tightening traceability and quality assurance as well, which keeps demand focused on documented lots and more integrated origin-to-processor supply arrangements.
Market Opportunities and Future Outlook
Origin diversification and in-origin processing are clear opportunity areas as buyers respond to climate-linked supply volatility and the cost of meeting quality requirements. Chile is a concrete example, where capacity announcements and new facilities are building an integrated supply proposition. In May 2026, Ferrero announced an approximately EUR 80 million investment for a new hazelnut shelling plant in Cunco, Chile, along with upgrades to existing Maule and Nuble facilities, and in June 2026, Grupo Hijuelas and Nefuen inaugurated a processing plant in Osorno integrating washing, drying, calibrating, and shelling. These steps raise the role of Southern Chile as a kernel-ready origin that can ship product with tighter moisture control and standardized specifications for industrial users.
Technology and genetics also support another opportunity thread by addressing disease and climate constraints while enabling mechanization and expansion into non-traditional regions. In the United States, the Hybrid Hazelnut Consortium, including Oregon State University and Rutgers, is working under a USDA grant to develop EFB-resistant, cold-hardy, and drought-tolerant hybrids, aligned with the need for resilient, scalable orchard systems beyond traditional areas. At the same time, tightening EU import controls for aflatoxin-risk consignments, updated again in June 2026 through Commission Implementing Regulation (EU) 2026/1206, raises the commercial value of suppliers that can document robust pre-shipment testing, traceability, and consistent post-harvest handling, supporting processors and exporters that invest in advanced sorting, QA systems, and certification-ready supply programs.
Recent Industry Developments
- June 2026: Grupo Hijuelas and Nefuen inaugurated a new hazelnut processing plant in Osorno, Chile, integrating washing, drying, calibrating, and shelling. The added in-country processing supports export-ready quality and helps Chile move further from raw export toward standardized industrial kernels for confectionery and ingredient buyers.
- May 2026: Ferrero (AgriChile) announced an investment of around EUR 80 million (about USD 94 million) to build a new hazelnut shelling plant in Cunco, Chile, and to upgrade its existing Maule and Nuble operations. The investment expands processing capacity and strengthens Ferreros origin diversification strategy by building more controlled supply from outside Turkey.
- November 2024: Ferrero funded hazelnut research at Oregon State University (USD 180,000) and Rutgers University (USD 160,000) focused on disease resistance and sustainable farming. The program supports longer-term supply security by accelerating agronomic and varietal improvements that underpin expanded North American production.


Research Methodology Framework and Report Scope
Market Definition and Coverage
This market covers the value of hazelnuts traded and consumed globally, counted as raw nuts and processed kernel forms that move through food ingredients and retail channels. The sizing is built in USD and aligns volumes in metric tons with average realized prices.
Scope exclusions: We exclude hazelnut-flavored products with no meaningful hazelnut content and exclude downstream confectionery and spreads revenue so the value is not double counted.
Segmentation Overview
-
By Geography (Production Analysis (Volume), Consumption Analysis (Volume and Value), Import Analysis (Volume and Value), Export Analysis (Volume and Value), and Price Trend Analysis)
-
North America
- United States
- Canada
- Mexico
-
Europe
- Germany
- France
- United Kingdom
- Italy
- Russia
- Spain
- Netherlands
- Austria
-
Asia-Pacific
- China
- India
- Japan
- Vietnam
- South Korea
- Australia
-
South America
- Brazil
- Argentina
- Chile
-
Middle East
- Turkey
- Azerbaijan
- Iran
-
Africa
- South Africa
- Kenya
- Ethiopia
-
North America
Data Sources, Market Sizing, and Validation
Desk Research
Desk work starts with setting a clean supply and trade picture, since hazelnuts are heavily shaped by crop cycles and cross-border flows. We rely on public agricultural and trade statistics such as FAOSTAT, UN Comtrade, USDA, and Eurostat to map production, yield trends, export intensity, and destination mixes.
Next, the value layer is shaped using price signals and contextual notes from sources such as national agriculture ministries, customs price summaries, trade association releases, peer reviewed agronomy and food journals, and investor materials from listed processors and ingredient handlers. When company level revenue context is missing or long time series price patterns look inconsistent, we use paid subscriptions for company financials and news intelligence, plus import export shipment databases, as supporting checks. These examples are not exhaustive, and we review additional sources to collect, validate, and clarify the final inputs.
Primary Interviews and Surveys
Primary work focuses on validating farmgate to export price spreads, typical kernel-out ratios, and how contracts are indexed during tight and surplus seasons. We spoke with growers, processors, traders, ingredient buyers, and food manufacturers across the main producing and importing regions, so assumptions around volumes, losses, and pricing could be cross-checked before totals are finalized.
Distribution of primary research fieldwork respondents
| Company type | Respondent position | Region |
|---|---|---|
| Top tier: 35% | CXOs: 20% | APAC: 47% |
| Mid tier: 45% | Functional/Unit leaders: 32% | EMEA: 33% |
| Smaller Players: 20% | Managers: 48% | Americas: 20% |
Market-Sizing & Forecasting
The core sizing starts with a top-down build where production, trade, and apparent consumption are reconstructed by country, and then converted into value using region-appropriate average price series for in-shell and kernel equivalents. To keep the totals realistic, the model is then corroborated with selective bottom-up approximations, mainly sampled exporter and processor revenue context, channel checks on typical contract pricing, and a volume times ASP sanity build for key corridors.
Inputs that materially move the model include planted area and yield, exportable surplus versus domestic use, kernel-out conversion and processing loss ranges, seasonality of shipments after harvest, and observed price spreads between farmgate, FOB, and import unit values. For forecasting, scenario analysis is used around crop outcomes and price normalization, and then yearly growth is smoothed using exponential smoothing where volatility is high, supported by expert consensus on how quickly new orchards translate into commercial volumes. When bottom-up signals are incomplete in smaller producing countries, gaps are handled through trade mirror statistics and weighted price proxies tied to nearby origin markets.
Data Validation & Update Cycle
Validation is done by triangulating value totals against independent signals such as export unit values, global shipment volumes, and major origin crop reports, and then checking that implied prices stay within realistic seasonal bands. Any sharp variance triggers a deeper look at conversion factors, re-exports, and currency timing, followed by a second analyst review before sign-off.
The report is refreshed annually, and interim updates are made when material events occur, such as major frost impacts, trade policy shifts, or abnormal price spikes. Before delivery, an analyst performs a final pass to ensure the latest public statistics and key interview takeaways are reflected in the model outputs.
Mordor Intelligence's Global Hazelnut Market Size Compared Against Other Published Estimates
Published hazelnut market values can look far apart because sources do not always count the same product boundary, and they also apply different price points for in-shell versus kernels. Timing can also shift the outcome, since a single harvest shock can move both volumes and realized pricing within the same season.
By tracking trade volumes, crop-yield signals, and refresh timing, Mordor Intelligence keeps the 2026 hazelnut market value tied to the physical flow of nuts and kernels, instead of blending in downstream chocolate and spreads revenue. The estimates below also differ based on whether import values are used as the main price anchor, how conversion ratios are handled, and whether aggressive price growth is assumed through the forecast window.
Benchmark comparison
| Source | Market Size | Gaps in Research Methodology |
|---|---|---|
| Mordor Intelligence | USD 13.08 B (2026) | |
| Global Consultancy A | USD 9.41 B (2024) | Uses an earlier base year and a narrower revenue capture that can lean toward retail and ingredient sales, which may undercount bulk trade value in high export seasons. |
| Industry Publisher B | USD 10.21 B (2025) | Relies on a different price anchoring approach and growth path, where conversion between in-shell and kernel value and currency timing can pull the headline size lower. |
The spread is mainly explained by scope boundaries and the year used for pricing, followed by how conversion and trade flows are treated in the value build. When the same physical market is defined first and then priced with transparent, repeatable steps, the resulting market size becomes easier to reconcile across years and regions.


Key Questions Answered in the Report
What is the current value of the hazelnut market?
The hazelnut market size is USD 13.08 billion in 2026.
How fast is global demand growing?
The market registers a 6.37% CAGR through 2031, driven by confectionery demand and plant-based products.
Which region buys the most hazelnuts?
Europe holds 63.20% of global imports, led by Germany and Italy.
Why did Turkish frost in 2025 matter so much?
The frost cut Turkish supply by 30%, pushing prices up 300% and prompting buyers to diversify sourcing.
How are chocolate manufacturers securing supply?
Firms like Ferrero invest directly in orchards and R&D, integrating farms to stabilize long-term availability.
Are hazelnuts used beyond chocolate?
Yes, demand is rising for hazelnut milk, yogurt, and functional foods that leverage the nut's nutrient profile.
Page last updated on:




