
Peanuts Market Size and Share
Peanuts Market Analysis by Mordor Intelligence
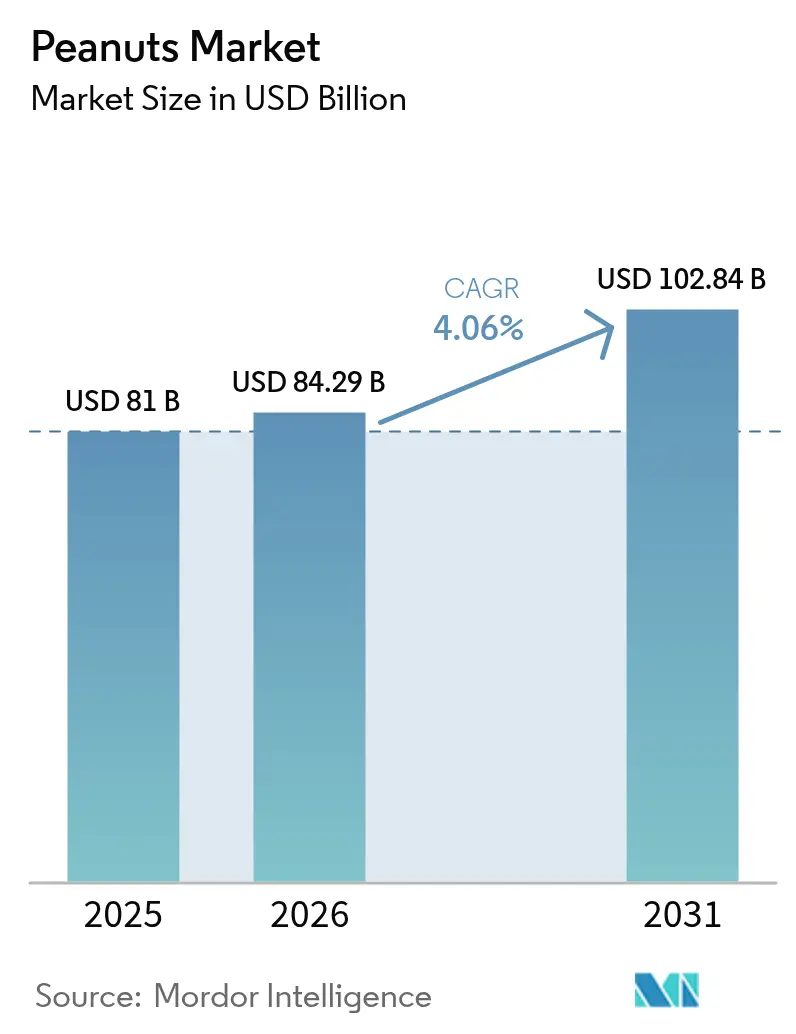
The peanut market size was valued at USD 81 billion in 2025 and estimated to grow from USD 84.29 billion in 2026 to reach USD 102.84 billion by 2031, at a CAGR of 4.06% during the forecast period (2026-2031). This stable expansion reflects resilient supply chains, innovations in processing, and the steady pivot toward plant-based proteins that position the peanut market for continued growth. Large-scale processing upgrades, blockchain-enabled traceability, and shell-upcycling projects are broadening end-use applications while helping producers defend margins against climate-driven cost pressures. Asia-Pacific maintains the strongest demand pull, South Africa delivers the sharpest regional acceleration, and sustained U.S. yield improvements anchor global export capacity. Competitive intensity remains moderate because no single supplier dominates every geography, enabling both multinationals and mid-tier processors to differentiate through sustainability credentials, flavor innovation, and specialty ingredients.
Key Report Takeaways
- By geography, Asia-Pacific led with 52.18% of the peanut market share in 2025, and Africa is projected to post a 6.35% CAGR through 2031.
Note: Market size and forecast figures in this report are generated using Mordor Intelligence’s proprietary estimation framework, updated with the latest available data and insights as of 2026.
Global Peanuts Market Trends and Insights
Drivers Impact Analysis*
| Driver | (~) % Impact on CAGR Forecast | Geographic Relevance | Impact Timeline |
|---|---|---|---|
| Rising demand for plant-based proteins | +1.2% | Global, with a concentration in North America and Europe | Medium term (2-4 years) |
| Growth of peanut-based snacking formats | +0.8% | North America, Europe, and Asia-Pacific urban centers | Short term (≤ 2 years) |
| Expansion of peanut processing capacity | +0.6% | Global, led by United States, China, and emerging markets | Long term (≥ 4 years) |
| Clean-label shift boosting peanut flour uptake | +0.5% | North America and Europe primarily | Medium term (2-4 years) |
| Blockchain-enabled origin tracing raising export premiums | +0.3% | Export-oriented regions: Argentina, United States, and India | Long term (≥ 4 years) |
| Upcycling peanut shells into bioplastics | +0.2% | Industrial regions with waste management focus | Long term (≥ 4 years) |
| Source: Mordor Intelligence | |||
Rising Demand for Plant-Based Proteins
Peanut flour delivers 35–55% protein plus 15% dietary fiber, giving manufacturers a clean-label ingredient suited for gluten-free foods and fortified beverages. Institutional research indicates feed formulations could absorb 700,000 metric tons annually, adding USD 437 million to producer sales while enriching eggs with unsaturated fats and beta-carotene. As flexitarian diets expand across Western economies, manufacturers are integrating peanut proteins into cereals, meal-replacement shakes, and sports nutrition lines, reinforcing a steady demand base for the peanut market.
Growth of Peanut-Based Snacking Formats
Retail sales of snack nuts hit USD 5.2 billion in 2024, even as volumes slipped 2.9%, signaling clear consumer willingness to pay premiums for flavor innovations and sustainable sourcing. Flavored peanuts, nutrition-rich trail mixes, and single-serve packs line convenience stores, positioning the peanut market to capture on-the-go spending despite inflationary pressure. KP Snacks’ acquisition of Whole Earth underlines the push to revitalize the stalled nut-butter category, maintaining 43% household penetration in the United Kingdom. Similar portfolio moves are anticipated across continental Europe, where premium spreads and coated nut innovations are climbing shelf space.
Expansion of Peanut Processing Capacity
Mechanized shelling, optical sorting, and socialized service programs are lifting product consistency and output rates, closing the technology gap between U.S. and Chinese facilities. The USD 42 million Santee shelling expansion improves domestic throughput and export readiness for U.S. suppliers. In therapeutic foods, Mother Administered Nutritive Aid (MANA) Nutrition’s USD 36 million capacity boost aims to reach 3 million malnourished children annually while leveraging Georgia’s 53% share of U.S. production.
Clean-Label Shift Boosting Peanut Flour Uptake
Global nutrition policies now mandate nutrient declarations in 95 countries, pushing producers toward recognizable ingredient lists. Peanut flour enhances protein counts in baked goods and shakes without synthetic additives, meeting clean-label thresholds while imparting distinctive roasted notes[1]Source: Tiefenbacher, Karl F., “Peanut Flour – an overview,” sciencedirect.com. Scientific research optimizes roasting profiles to balance antioxidant retention with texture performance, enabling bakers to swap refined flours for nutrient-dense alternatives at incorporation levels that preserve crumb structure. Transparent sourcing initiatives tie into blockchain tracing, giving the peanut market an edge among wellness-oriented shoppers.
Restraints Impact Analysis*
| Restraint | (~) % Impact on CAGR Forecast | Geographic Relevance | Impact Timeline |
|---|---|---|---|
| Climate-induced yield volatility | -1.5% | Global, with a severe impact in subtropical regions | Long term (≥ 4 years) |
| Food-safety recalls (aflatoxin) | -0.8% | Global, particularly affecting export markets | Short term (≤ 2 years) |
| EU deforestation-free import rules tightening | -0.4% | Export-oriented regions targeting Europe markets | Medium term (2-4 years) |
| Emerging allergy-labeling mandates in developing markets | -0.3% | Developing markets with expanding food safety regulations | Medium term (2-4 years) |
| Source: Mordor Intelligence | |||
Climate-Induced Yield Volatility
Modeling projects 20% yield losses for peanuts by 2100 under high-emission scenarios, with drought-prone belts in the U.S. Southeast already costing USD 50 million annually[2]Source: Ruane, Alex C. et al., “Carbon–Temperature–Water Change Analysis for Peanut Production under Climate Change,” nature.com. Genomics-assisted breeding delivers drought-tolerant lines, yet commercialization windows stretch beyond immediate needs, keeping supply tight during prolonged heatwaves. Senegalese trials reveal CO₂-fertilization could raise yields 19% in specific microclimates, highlighting heterogeneity that complicates global sourcing strategies. The development of high-throughput phenotyping methods is accelerating the breeding of stress-tolerant cultivars, though commercialization requires substantial investment and regulatory approval processes.
Food-Safety Recalls (Aflatoxin)
Aflatoxin alerts account for over half of EU mycotoxin border notifications, with 29% tied to Chinese shipments. Coles’ nationwide recall in Australia and Fortune Foods’ penalties of USD 1,800–USD 6 million in Taiwan during 2025 underscore commercial risk. AI-based hyperspectral imaging trials slash inspection times but remain capital-intensive for small processors. Innovative detection technologies using AI-based hyperspectral imaging and machine learning are emerging as solutions for rapid, non-destructive testing, though implementation costs remain prohibitive for smaller operations. Nanotechnology approaches for aflatoxin management show promise in research settings, but commercial deployment faces regulatory hurdles and scalability challenges.
*Our forecasts treat driver/restraint impacts as directional, not additive. The impact forecasts reflect baseline growth, mix effects, and variable interactions.
Geography Analysis
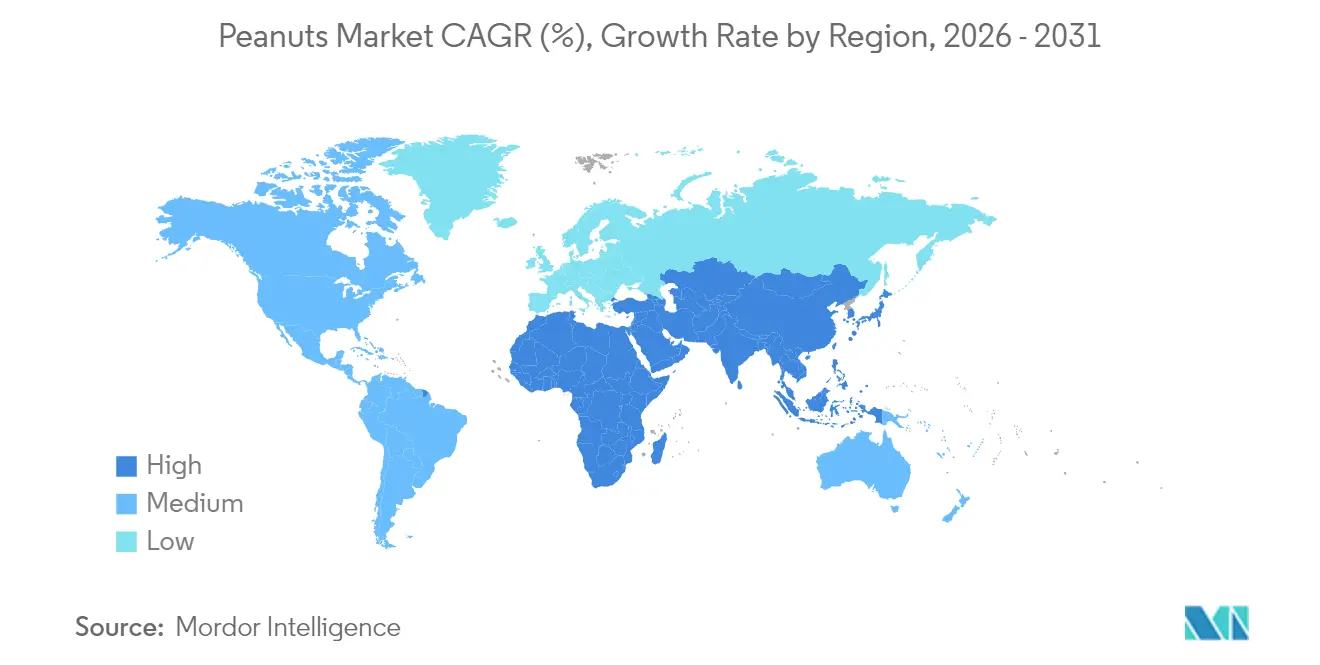
Asia-Pacific commands 52.18% of the peanut market share in 2025 on an annual production of 19,000 thousand metric tons, anchored by China at 36% global output. India’s 7,100 thousand metric tons crop secures second place while urbanizing Southeast Asia scales snack-nut demand. Consumption growth inside China tightens export surpluses, occasionally firming global prices, while equipment modernization spreads unevenly across producer nations.
Africa and the Middle East deliver mixed patterns. Africa registers the fastest regional rise at 6.35% CAGR to 2031, aided by disease-resistant cultivars and new irrigation schemes. Turkey and Saudi Arabia grow import demand, though foreign-exchange swings and political tension can disrupt shipping timelines. The implementation of deforestation-free rules will reward certified suppliers, potentially redirecting flows away from low-compliance origins. Germany and France favor peanut butter and confectionery usage, while the United Kingdom sustains premium snack selections despite static volumes.
The United States exports a stable 25% of crop volume to Mexico, Canada, Europe, China, and Japan. Georgia’s 53% share of national production offers shipping engagement but heightens regional weather risk. Canada and Mexico supplement supply while expanding roasted and confectionery categories. South America shows the fastest multi-country expansion, led by Argentina’s dominance in raw-nut exports and Brazil’s projected record crop of 832,300 metric tons, up 40.6%. Córdoba’s cluster model integrates growers with crushers and port logistics, enhancing competitive landed costs. Chile remains a primary regional buyer, whereas Brazil bolsters domestic processing to serve snack and confectionery segments.


Regulatory Landscape
Regulation in the peanut trade is increasingly shaped by mycotoxin food-safety controls and import-side inspection regimes. In the European Union, Commission Regulation (EU) 2023/2782 standardized sampling and analysis for mycotoxins, including aflatoxins, with application from 1 April 2024, and Commission Implementing Regulation (EU) 2026/194 (signed 28 January 2026) amended the enhanced official-controls framework under (EU) 2019/1793, including groundnuts from specific third countries, raising compliance stakes for exporters supplying Europe.
In the United States, quality and handling requirements under USDA programs and federal rules for peanuts anchor lot integrity and testing expectations, including positive lot identification and chemical certification as negative for aflatoxin for imported lots under 7 CFR Part 996. India has also tightened export-side process discipline through APEDA updated export procedures for peanuts and peanut products effective 1 November 2025, reinforcing documentation, testing, and importing-country compliance requirements for outbound shipments.
Value Chain Analysis
The peanut value chain spans seed and crop inputs (breeder seed, fertilizer, crop protection), production (smallholders to large mechanized farms), aggregation and primary handling (drying, storage, shelling), processing (sorting, blanching, roasting, grinding into peanut butter, oil crushing, and ingredient manufacturing such as flour and protein), and downstream channels into branded food, confectionery, foodservice, and export trading. Compliance activities (sampling, aflatoxin testing, and traceability documentation) run through post-harvest handling and processing, with optical sorting and accredited laboratory testing often determining cost and capability for export-oriented supply chains.
Trade disruptions and domestic policy actions have also exposed where the chain is most fragile. In Senegal, the government suspension of peanut exports for the 2024/2025 marketing season contributed to procurement shortfalls for Sonacos (76,424 tons secured versus a 300,000-ton target) and under-capacity operations (35-40%), pointing to bottlenecks in aggregation, contracting, and processing utilization. In South and Southeast Asia, aflatoxin-linked market access can quickly redirect flows, illustrated by Indonesia's import suspension on Indian groundnuts reported in September 2025, which reinforces the role of port-side compliance checks, storage hygiene, and segregation systems in protecting realizations and minimizing rejections.
Market Opportunities and Future Outlook
Investment in in-country processing and modernization programs is widening the opportunity set beyond raw kernel exports, especially where governments and local industry are building infrastructure to capture more value domestically. In Senegal, Mavamar Industries SA inaugurated a large-scale vegetable oil refinery in Sendou in January 2026 with 600 tons per day processing capacity, reflecting a push to expand local crushing and downstream edible-oil value addition tied to peanut supply. In Pakistan, a January 2026 memorandum of understanding between Shandong Rainbow Agricultural Technology Co. Ltd and Uqab Corporation (Pvt) Ltd to modernize cultivation and build an end-to-end supply chain (breeding, primary processing, and cold storage) highlights opportunities for yield stability, post-harvest quality retention, and export-grade handling in emerging origin markets.
In mature exporting systems, new shelling and handling capacity and stock management are shaping commercial priorities around throughput, quality, and channel diversification. Premium Peanut opened a state-of-the-art shelling facility in Santee, South Carolina in May 2026, adding modern primary processing capability in a key U.S. producing region. In July 2026, USDA reporting showed commercial storage holdings of 4.07 billion pounds of farmer stock peanuts for the 10th month of the marketing year (60% above the same period in 2025), reinforcing incentives for value-added processing and tighter quality segmentation where specifications and testing requirements are stringent.
Recent Industry Developments
- June 2026: Taiwan announced amendments to the Enforcement Rules for the Plant Variety and Plant Seed Act to restrict the export of peanut seeds, aiming to protect domestic varieties and growers. The change raises constraints on cross-border seed movement and affects how breeding material and improved varieties circulate in regional supply chains.
- April 2026: Indonesia introduced a new quota system for peanut imports that requires exporters to obtain global Good Agricultural Practices (GAP) certification. The move adds a compliance gate for suppliers and can shift sourcing toward origins and exporters that can document farm-level practices and certification.
- July 2024: ADM and Smucker launched a regenerative-agriculture initiative across U.S. peanut farms focused on soil-carbon accrual and fertilizer optimization. The program supports verified sustainability claims and can influence procurement requirements and on-farm practice adoption for large branded buyers.


Research Methodology Framework and Report Scope
Market Definition and Coverage
For this study, the peanuts market is measured as the value generated from peanuts supplied for food and industrial use, covering domestic consumption and trade flows, and supported by price trend checks across major producing and consuming countries.
Scope exclusions: We exclude farm machinery, on-farm services, and downstream packaged snack brand retail margins that are not directly tied to peanut commodity and primary processed value.
Segmentation Overview
- By Geography (Production Analysis (Volume), Consumption Analysis (Volume and Value), Import Analysis (Volume and Value), Export Analysis (Volume and Value), and Price Trend Analysis)
- North America
- United States
- Canada
- Mexico
- South America
- Brazil
- Argentina
- Chile
- Europe
- Germany
- France
- Italy
- United Kingdom
- Asia-Pacific
- China
- India
- Japan
- Australia
- Middle East
- Turkey
- Saudi Arabia
- Africa
- South Africa
- Kenya
- Egypt
- North America
Data Sources, Market Sizing, and Validation
Desk Research
Desk research was used to build the base structure of the model and to set reality checks around production, trade, and pricing. We mainly used public agriculture production statistics and balances, such as FAOSTAT, USDA (including PSD style supply and utilization tables), and national agriculture ministry releases from key peanut-producing countries.
Trade and pricing were then cross-checked using sources such as UN Comtrade, ITC Trade Map, and customs or port statistics where available, alongside inflation and FX references from sources such as the World Bank and IMF. Company filings, investor presentations, and association websites were used to understand processing mixes and procurement trends, and a paid subscription for shipment-level import-export data and company financials was used selectively to validate direction and outliers. These sources are illustrative, and many other public references were also consulted for data collection, validation, and clarification.
Primary Interviews and Surveys
Primary work focused on validating the demand pool and the pricing logic that links volumes to value, especially where public data is delayed or reported with different crop-year conventions. We spoke with participants across farming-linked procurement, shelling and processing, traders, and large end users, then re-checked assumptions across APAC, EMEA, and the Americas so regional conversion factors were applied consistently and not over-applied in the roll-up.
Distribution of primary research fieldwork respondents
| Company type | Respondent position | Region |
|---|---|---|
| Top tier: 33% | CXOs: 14% | APAC: 40% |
| Mid tier: 53% | Functional/Unit leaders: 27% | EMEA: 37% |
| Smaller Players: 14% | Managers: 59% | Americas: 23% |
Market-Sizing & Forecasting
Sizing starts with a top-down build that reconstructs market value from country-level production and trade balances, which are then aligned to consumption pools and priced using observed peanut price trends (by origin and grade where data is visible). We then corroborate totals with selective bottom-up approximations, such as sampled processor throughput checks, trader channel splits, and volume multiplied by observed average selling price bands, so the final number stays practical and not overly model-driven.
Key inputs used in the model include harvested area and yield trends, import and export volumes by major corridors, domestic crush and food use indicators, price spreads between in-shell and shelled kernels, and currency movements for major exporters. Forecasts were guided using scenario analysis that links yield and acreage outlooks, trade policy or tariff signals, and expected food use growth into a few clean cases, and then the most likely case was chosen based on what interviewees described as procurement reality. When bottom-up checks were incomplete for smaller origins, gaps were handled by applying conservative conversion factors that were later stress-tested against trade totals and price consistency.
Data Validation & Update Cycle
Outputs are checked in several passes so the totals, regional splits, and implied pricing do not conflict with observable market signals. We compare modeled consumption and trade values against independent indicators such as production balances, reported export earnings for key origins, and price trend direction, then investigate any sharp variance before sign-off.
If a large mismatch appears, assumptions are revisited and the relevant experts are re-contacted to confirm whether the driver is a reporting lag, a crop shock, or a temporary pricing spike. Reports are refreshed annually, and interim updates are made when material events occur, such as major crop failures, sudden policy changes, or large trade disruptions. Before delivery, a final analyst review is completed so clients receive the latest updated view.
Mordor Intelligence's Peanuts Market Sizing Compared With Other Published Estimates
Published peanuts market values often do not match because the boundary around what is counted can shift, even when everyone uses the same commodity name. The biggest drivers are usually whether value is built from production and trade balances versus revenue roll-ups, how crop-year reporting is converted into a calendar-year number, and how price levels are averaged when volatility is high.
Trade volumes and origin-level price trend checks are the evidence used to keep Mordor Intelligence's 2026 estimate anchored to the measurable consumption and export pool, instead of mixing in downstream packaged snack and branded retail markups. Differences also come from scope choices, since some sources fold peanut butter and oil as separate finished goods values into the total, and from refresh timing, because FX and freight shifts can move USD totals even if volumes are stable.
Benchmark comparison
| Source | Market Size | Gaps in Research Methodology |
|---|---|---|
| Mordor Intelligence | USD 84.29 B (2026) | |
| Global Consultancy A | USD 92.01 B (2024) | Uses an earlier base year and a broader basket that can include peanut-derived finished products in the same total, which increases value compared to a balance-based consumption and trade build. |
| Industry Research Publisher B | USD 92.16 B (2025) | Leans on application and channel splits that can embed additional downstream value layers, and the lower stated growth rate suggests a different base-case assumption set and averaging method for prices. |
Across the three figures, the spread is mainly explained by scope boundaries and how value is reconstructed from volumes and prices. By keeping the model tied to production and trade balances, then checking the implied price levels against observed market pricing, our estimate stays traceable to inputs that can be re-checked each year with the same steps.


Key Questions Answered in the Report
How big is the global peanut market in 2026?
The peanut market size reached USD 84.29 billion in 2026 and is projected to climb to USD 102.84 billion by 2031.
Which region accounts for the largest share of peanut demand?
Asia-Pacific leads with 52.18% of global market share, driven largely by China and India.
What growth rate is forecast for the South African peanut sector?
South Africa is projected to register a 6.35% CAGR through 2031 as new cultivars and processing upgrades take hold.
What are the main threats to peanut supply stability?
Key risks include climate-induced yield volatility, aflatoxin-related recalls, tighter EU deforestation regulations, and emerging allergy-label mandates.
Page last updated on:




