Sustainability Market Size and Share
Market Overview
| Study Period | 2020 - 2031 |
|---|---|
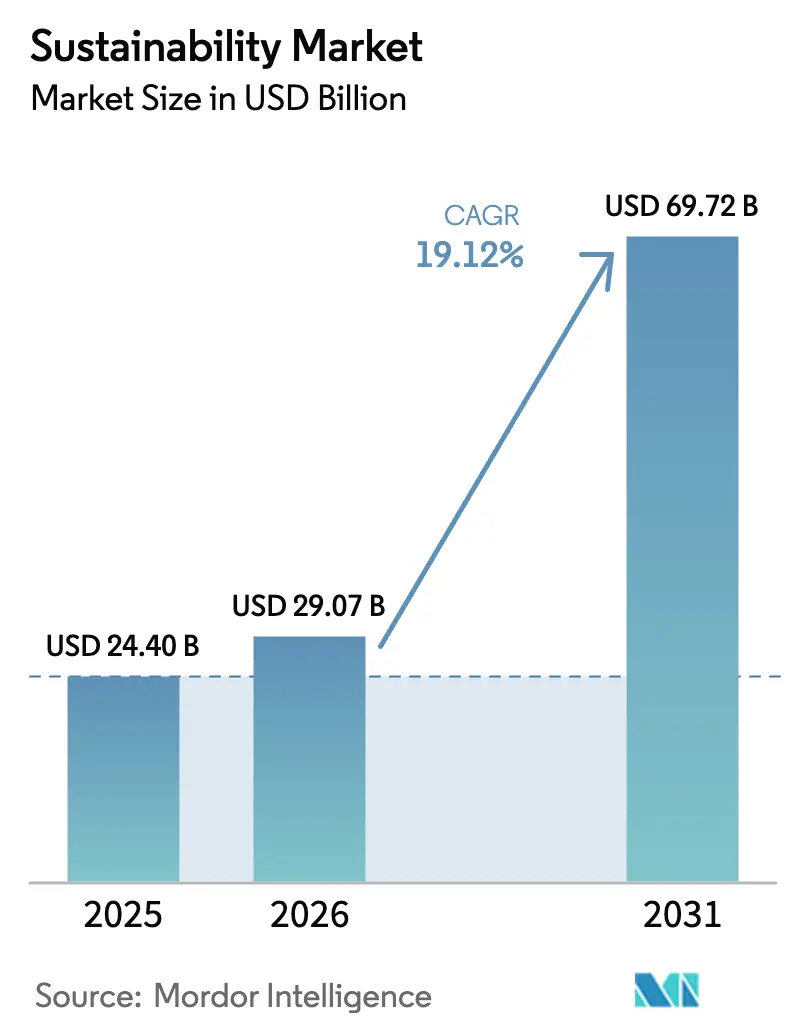
| Market Size (2026) | USD 29.07 Billion |
| Market Size (2031) | USD 69.72 Billion |
| Growth Rate (2026 - 2031) | 19.12% CAGR |
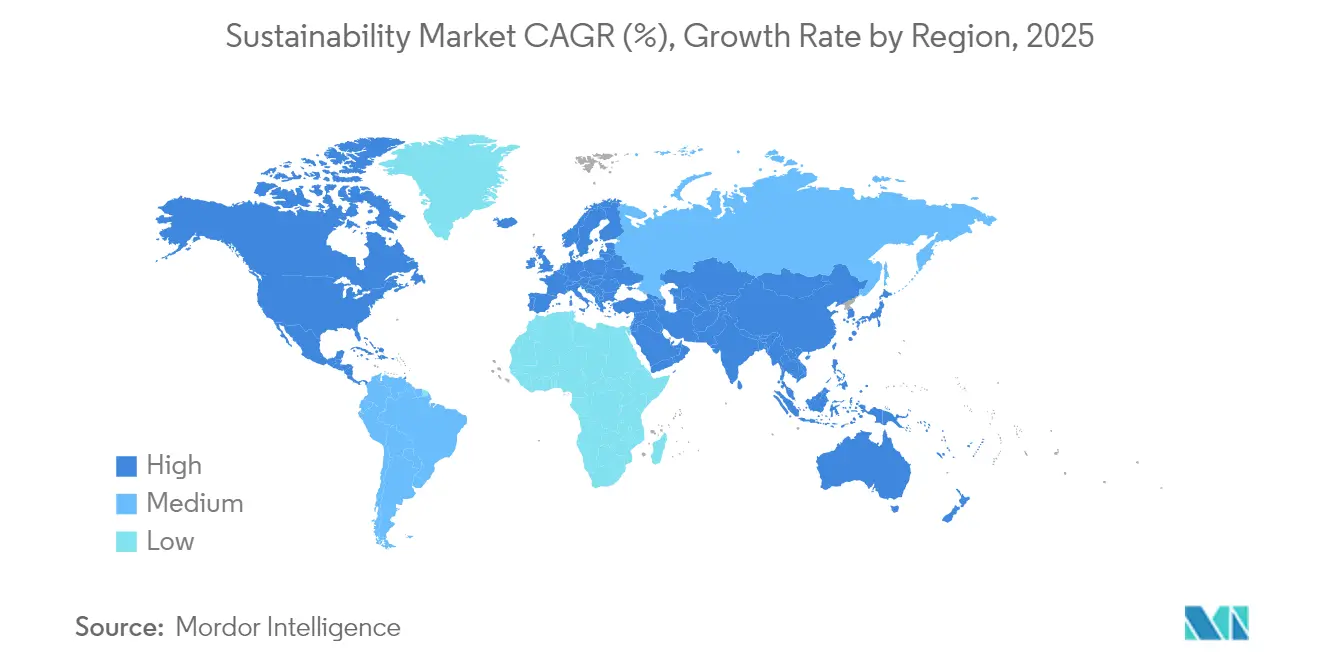
| Fastest Growing Market | Asia Pacific |
| Largest Market | North America |
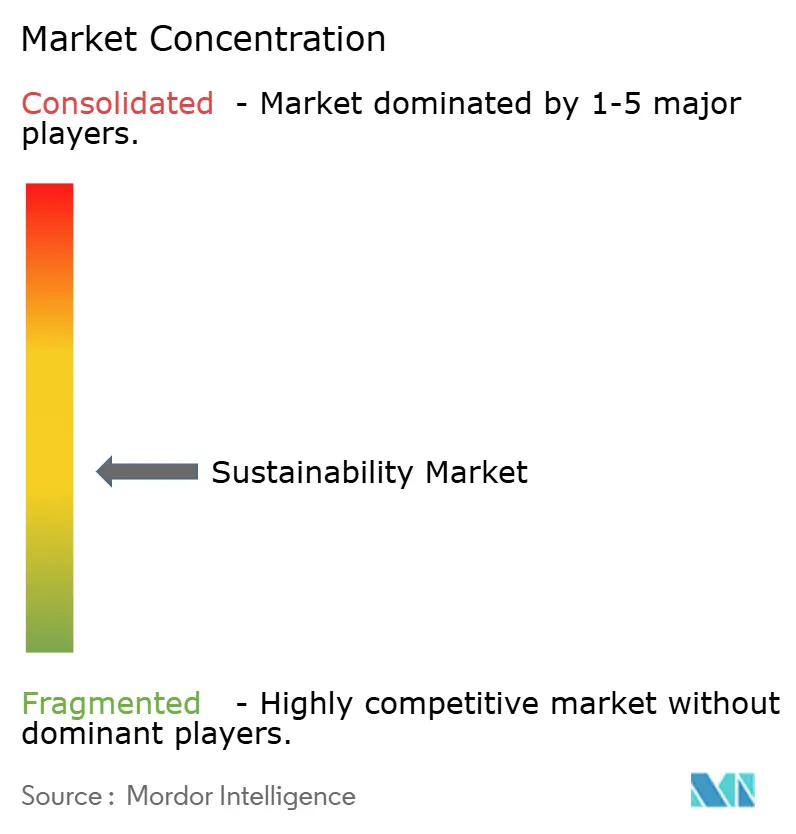
| Market Concentration | Medium |
Major Players *Disclaimer: Major Players sorted in no particular order Image © Mordor Intelligence. Reuse requires attribution under CC BY 4.0. | |
Sustainability Market Analysis by Mordor Intelligence
Sustainability market size in 2026 is estimated at USD 29.07 billion, growing from 2025 value of USD 24.40 billion with 2031 projections showing USD 69.72 billion, growing at 19.12% CAGR over 2026-2031.
Rising regulatory alignment, notably the European Union’s Corporate Sustainability Reporting Directive[1]European Commission, “Corporate Sustainability Reporting Directive Overview,” European Commission, europa.eu and climate-disclosure rules in the United States, is converting environmental reporting from a discretionary activity into a compliance obligation[2]Gary Gensler, “Statement on Proposed Climate-Related Disclosure Rules,” U.S. Securities and Exchange Commission, sec.gov. The resulting surge in demand for automated data-management platforms is reinforced by corporate net-zero targets, sustainability-linked financing, and real-time analytics that demonstrate clear cost-saving potential. Suppliers that integrate IoT sensors with artificial intelligence are capturing early advantage because enterprises now prioritize predictive insights over passive data collection. Meanwhile, a fragmented standards landscape and scarcity of specialist talent in emerging economies temper near-term uptake, especially among smaller businesses that struggle with implementation costs.
Key Report Takeaways
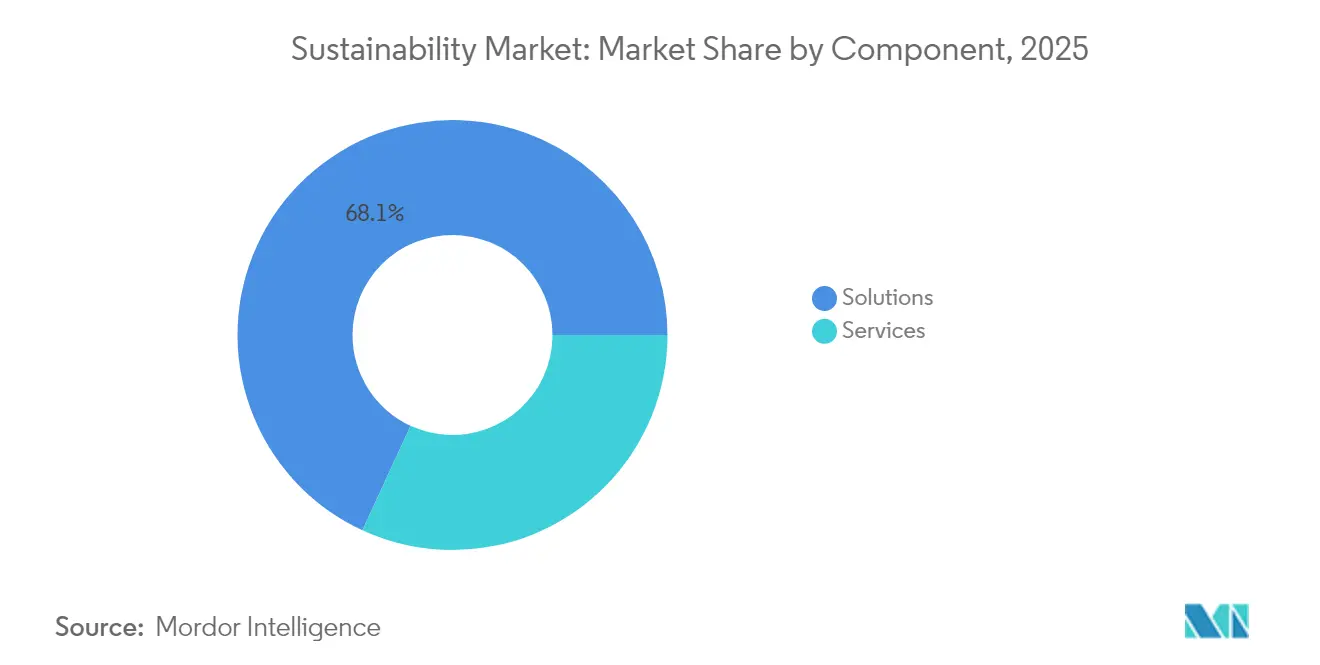
- By component, solutions held 68.12% revenue share of sustainability market in 2025, while services are advancing at an 18.34% CAGR through 2031.
- By technology, IoT led with 40.21% share of the sustainability market in 2025; AI and analytics are projected to record a 20.08% CAGR to 2031.
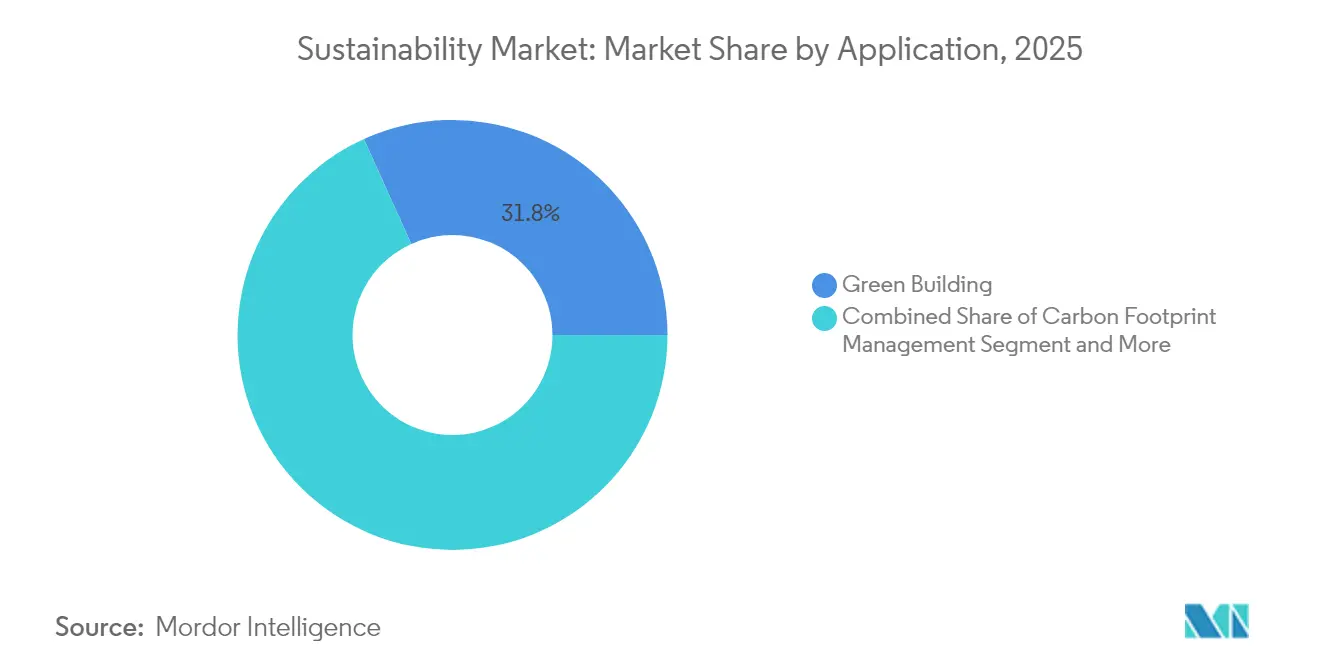
- By application, green building monitoring accounted for 31.76% of the sustainability market size in 2025, whereas carbon footprint management is growing at a 21.55% CAGR.
- By end-user industry, manufacturing commanded 26.08% of the sustainability market share in 2025, yet BFSI is poised for a 19.24% CAGR to 2031.
- By geography, North America captured 35.02% of 2025 revenue in sustainability market, but Asia-Pacific is set to expand at a 21.05% CAGR.
Note: Market size and forecast figures in this report are generated using Mordor Intelligence’s proprietary estimation framework, updated with the latest available data and insights as of 2026.
Global Sustainability Market Trends and Insights
Drivers Impact Analysis*
| Driver | % Impact on CAGR Forecast | Geographic Relevance | Impact Timeline |
|---|---|---|---|
| Mandatory ESG-Reporting Regulations (EU CSRD, SEC) Accelerating Solution Uptake | 4.2% | Global, with EU and North America leading | Medium term (2-4 years) |
| Net-Zero Commitments Driving Carbon Accounting Demand in North America | 3.8% | North America, expanding to APAC | Long term (≥ 4 years) |
| Sustainability-Linked Financing Pushing Adoption in APAC Manufacturing | 3.1% | APAC core, spill-over to MEA | Medium term (2-4 years) |
| AI-Led Resource-Efficiency Gains in Heavy Industries (JP, DE) | 2.9% | Japan, Germany, expanding globally | Long term (≥ 4 years) |
| Blockchain-Enabled Ethical Traceability Boosting Retail & Fashion | 2.4% | Global, with early adoption in EU and North America | Medium term (2-4 years) |
| Nature-Based Offset Surge in Brazil Creating Data-Management Needs | 1.8% | South America, with Brazil leading | Long term (≥ 4 years) |
| Source: Mordor Intelligence | |||
Mandatory ESG-reporting Regulations Accelerating Solution Uptake
Extensive disclosure mandates now cover more than 50,000 European companies, and parallel rules require climate data from US federal contractors. Digital tagging obligations under the EU directive have created urgent demand for automated collection tools that ingest structured environmental data and feed assurance workflows. In North America, new state-level measures add jurisdiction-specific metrics, pushing multinational firms toward platforms that reconcile overlapping rulesets. Penalties for non-compliance often exceed platform licence fees, making procurement decisions relatively price-insensitive. Suppliers that embed XBRL tagging and pre-configured templates are seeing sales cycles shorten despite budget scrutiny.
Net-zero Commitments Driving Carbon Accounting Demand in North America
More than 1,500 corporations have public science-based targets, and investors now request granular Scope 3 emissions data. Financial institutions face additional scrutiny under the Partnership for Carbon Accounting Financials standard, which requires financed-emissions baselines across lending books. Complexity around category-based emission factors is propelling the adoption of AI engines that can sift supplier invoices and map them against thousands of activity codes. The trend is cascading down supply chains, forcing smaller vendors to upload verified emissions data or risk disqualification.
Sustainability-linked Financing Pushing Adoption in APAC Manufacturing
Loan spreads tied to verified environmental improvements make real-time monitoring a prerequisite for favorable rates across regional banks. Singapore’s Green Finance Incentive Scheme, together with similar programs in India and Japan, subsidizes audit costs when borrowers deploy continuous-monitoring sensors[3]Ravi Menon, “Green Finance Incentive Scheme Guidelines,” Monetary Authority of Singapore, mas.gov.sg. Manufacturers are embedding water-usage dashboards, particulate-emission counters, and energy-efficiency models that feed directly into loan covenants, turning sustainability reporting into a finance-department deliverable rather than an external-affairs task.
AI-led Resource-efficiency Gains in Heavy Industries
Japanese automakers and German chemical majors apply machine-learning algorithms to cut energy use by up to 30% while hitting emissions ceilings. Algorithms crunch terabytes of machine telemetry, flagging compressor leaks or sub-optimal furnace profiles hours before deviations become material. Digital twins integrate historical production records with real-time data to simulate process tweaks, allowing engineers to test emissions-control scenarios without costly downtime.
Restraints Impact Analysis*
| Restraint | % Impact on CAGR Forecast | Geographic Relevance | Impact Timeline |
|---|---|---|---|
| Fragmented Standards Causing Data-Interoperability Issues | -2.8% | Global, particularly affecting multi-jurisdictional operations | Medium term (2-4 years) |
| Skilled-Talent Shortage in SE-Asia SMEs | -2.1% | Southeast Asia, with spillover to other emerging markets | Short term (≤ 2 years) |
| High TCO of Industrial IoT in South America | -1.6% | South America, with Brazil and Argentina leading impact | Medium term (2-4 years) |
| Greenwashing Litigation Risk in the US | -1.4% | North America, particularly United States | Short term (≤ 2 years) |
| Source: Mordor Intelligence | |||
Fragmented Standards Causing Data-interoperability Issues
Global organizations often juggle GRI, SASB, and TCFD frameworks, each with discrete metrics, units, and cutoff dates. Legacy platforms rarely support harmonized application programming interfaces, forcing firms to run separate instances or rely on brittle spreadsheet bridges. Integration projects inflate the total cost of ownership and postpone the return on investment, especially when suppliers lack shared data taxonomies. Regional standard-setting bodies promise convergence, yet timelines for full alignment remain uncertain.
Skilled-talent Shortage in Southeast-Asian SMEs
IoT rollouts demand engineers who understand low-power networks, cybersecurity, and environmental science[4]Dominic Waughray, “Adopting IoT Solutions for the UN SDGs,” World Economic Forum, weforum.org. Such multidisciplinary talent clusters in large urban centers, leaving provincial manufacturing hubs under-resourced. Small firms often hire consultants for initial deployments but cannot sustain iterative model retraining or evolving regulatory mappings, resulting in stalled pilots. Cloud-based managed services offer relief, yet onboarding still requires baseline expertise that many firms do not possess.
*Our forecasts treat driver/restraint impacts as directional, not additive. The impact forecasts reflect baseline growth, mix effects, and variable interactions.
Segment Analysis
By Component: Specialized Services Narrow The Gap With Solutions
Solutions generated 68.12% of sustainability market revenue in 2025, underpinned by sensor arrays, cloud platforms, and edge-processing gateways that anchor data acquisition. Services revenue is climbing faster at an 18.34% CAGR because organizations must tailor deployments to divergent regulatory, operational, and industry contexts. During 2026-2031, procurement teams increasingly bundle advisory engagements with platform licences to accelerate go-live schedules. Systems integrators design taxonomies that map facility-level emissions to jurisdiction-specific disclosures, ensuring downstream audit readiness. Analytics consultants interpret anomalies and translate them into investment-grade insights, moving client focus from pure compliance toward performance optimization. Large enterprises dominate spending, yet mid-market demand is rising as simplified SaaS offerings shrink upfront capital hurdles. Vendors that cultivate deep regulatory expertise and offer modular service catalogs are improving renewal rates and recurring revenue mix. As service margins eclipse hardware margins, several platform providers now emphasize managed-service contracts, locking in multi-year cash flows while strengthening customer intimacy. The pattern signals a maturing sustainability market where differentiation lies in post-deployment value delivery rather than basic data capture.


By Technology: AI Analytics Disrupts Sensor-centric Architectures
IoT underpins 40.21% of the sustainability market, supplying low-power devices that stream temperature, particulate, and greenhouse-gas data from factories, offices, and logistics fleets. Yet AI and analytics are projected to deliver a 20.08% CAGR to 2031, shifting boardroom conversations from data availability to actionable foresight. Edge-AI modules compress and preprocess sensor streams, easing bandwidth constraints and enabling sub-second anomaly detection inside industrial plants. Cloud hyperscalers add elasticity that supports seasonal scaling or acquisitions without on-premise hardware refreshes. Blockchain nodes certify provenance in supply chains, providing immutable ledgers that deter greenwashing claims. Digital twins simulate policy choices, such as adjusting HVAC setpoints against indoor-air-quality thresholds, allowing facilities managers to quantify trade-offs before implementation. Technology convergence prompts suite providers to embed AI libraries, data-lake connectors, and low-code orchestration tools inside single subscriptions. Start-ups focusing on sector-specific data models, cement kilns, cold-chain warehousing, or wastewater treatment, win contracts from operators that prefer pre-trained algorithms over generic frameworks. Over the forecast horizon, algorithm explainability and carbon-aware coding techniques will gain prominence as enterprises scrutinize model footprints alongside model outputs.
By Application: Carbon Management Eclipses Compliance Monitoring
Green-building monitoring retained 31.76% sustainability market share in 2025 because municipal codes require continuous tracking of energy intensity, peak-load factors, and ventilation rates. Carbon footprint management is accelerating at a 21.55% CAGR, becoming a board-level priority as public targets align with the Paris Agreement. The sustainability market size for carbon management platforms is therefore projected to multiply rapidly, driven by Scope 3 data requests that cascade through supplier tiers. New platforms integrate life-cycle-assessment databases with financial ledgers, converting emissions reductions into monetary savings for executive dashboards. Air-quality and water-quality modules remain essential for compliance, yet growth pivots toward holistic carbon orchestration that spans procurement, operations, logistics, and end-of-life considerations. Agriculture and forestry applications gain traction because remote-sensing data can verify nature-based offsets. Fire-detection systems evolve into multi-parameter environmental nodes, supporting early-warning services that dovetail with insurers’ risk-scoring models. As enterprises adopt unified platforms, application boundaries blur, and customers prefer vendor-agnostic marketplaces that surface certified micro-applications.
By End-User Industry: BFSI Adoption Challenges Manufacturing Dominance
Manufacturing contributed 26.08% of 2025 spending in the sustainability market, reflecting regulatory pressure on energy-intensive facilities and the operational payback of process optimization. Financial institutions, however, will post a 19.24% CAGR up to 2031 as climate-risk stress testing and sustainable-finance products hinge on robust data flows. The sustainability market size within BFSI is benefiting from portals that map loan books and investment portfolios against emissions trajectories. Utilities deploy high-resolution grid sensors to accommodate distributed energy resources, ensuring load-balancing while meeting decarbonization mandates. Transport and logistics operators install telematics to track fleet emissions in real time, feeding route-optimization engines that cut fuel costs. Retailers embed QR-code traceability on packaging so shoppers can scan supply-chain footprints, thereby aligning brand equity with transparency. Healthcare operators monitor pharmaceutical cold chains and hospital energy baselines to meet health-sector pledges. Across industries, executives seek turnkey dashboards that reconcile operational KPIs with disclosure-grade evidence, allowing cross-functional decision-making.
By Organization Size: Cloud Delivery Expands SME Access
Large enterprises continue to dominate expenditure because multi-site operations require enterprise-grade control towers that ingest data from thousands of assets. They negotiate volume licences and often co-develop features with vendors, accelerating roadmap evolution. Small and mid-sized enterprises confront budget caps and limited internal expertise, yet regulatory thresholds are dropping and supply-chain audits now target second-tier suppliers. SaaS models offer pay-as-you-go telemetry and pre-built analytics that lower barriers. Vendors provide implementation accelerators, template dashboards, drag-and-drop workflows, and library connectors that compress onboarding from months to weeks. Regional development banks and industry associations run voucher schemes to subsidize initial deployments, recognizing that SME participation is vital for complete value-chain visibility. Despite progress, training gaps persist; platform vendors therefore bundle e-learning modules and remote support. The balance between affordability and functionality remains a design constraint as providers strive to keep feature creep from inflating subscription tiers.
By Deployment Mode: Cloud Infrastructure Supports Elastic Scaling
Cloud deployment dominates because sustainability workloads demand burst capacity during reporting cycles and machine-learning retraining. Built-in redundancy assures data durability across diverse availability zones, satisfying enterprise recovery mandates without duplicative hardware. On-premise installations still appeal to sectors with strict data-sovereignty rules or isolated networks, such as defense contractors and nuclear facilities. Hybrid models emerge where latency-sensitive controls stay local while bulk analytics and archival storage migrate to the cloud. Vendors optimize containerized microservices that let customers shift workloads dynamically, responding to peak audit seasons or acquisitions. Integrated marketplaces inside cloud consoles offer plug-in carbon calculators, facilitating feature expansion without procurement delays. Edge-cloud architectures push minimal models to devices, sending exceptions to the cloud for deeper analysis, thus balancing bandwidth, responsiveness, and cost.
Geography Analysis
North America generated 35.02% of 2025 revenue, reaffirming its position as the largest regional contributor to the sustainability market. Federal disclosure rules that cover investment advisers and government contractors have extended compliance obligations into sectors that previously treated sustainability as peripheral. State mandates in California and New York reinforce momentum, compelling multi-state corporations to consolidate reporting under unified platforms. The region already owns extensive cloud infrastructure and hosts leading software vendors, shortening deployment lead times. Strategic initiatives, such as hyperscaler data centers powered by renewable energy, highlight how domestic technology ecosystems accelerate positive feedback between policy and innovation. Venture-funded start-ups focusing on methane-capture analytics and grid-scale storage further enrich local solution diversity.
Asia-Pacific is forecast to record a 21.05% CAGR to 2031, making it the fastest-growing region within the sustainability market. National industrial policies in China, India, and Japan blend pollution control with competitiveness goals, driving factories to instrument production lines with IoT and AI. Singapore’s green-finance incentives and Vietnam’s renewable-energy targets illustrate how fiscal measures and regulatory roadmaps converge to stimulate enterprise adoption. The region’s manufacturing concentration means even marginal efficiency gains translate into large absolute emissions reductions, reinforcing investment economics. Yet progress is uneven because small factories in Southeast Asia still face skills shortages, prompting regional development agencies to offer subsidized training and cloud credits.
Europe remains a critical pillar in the sustainability market, , propelled by the European Green Deal and the Corporate Sustainability Reporting Directive, both of which institutionalize sustainability across corporate strategy. The EU’s 2024 Omnibus ESG Regulation seeks to cut overlapping disclosure requirements by 25%, catalyzing demand for software that can harmonize datasets across legacy and new frameworks. European enterprises experiment with blockchain traceability for consumer goods, transforming supply-chain audits into marketing differentiators. Utility firms expand smart-grid pilots to absorb growing volumes of distributed renewables, exemplifying systemic approaches that combine environmental targets with energy-security objectives. As regulatory clarity improves, market participants anticipate a second investment wave focused on circular-economy analytics and scope-3 transportation modules.

Competitive Landscape
The sustainability market exhibits moderate fragmentation, with platform strategists, niche innovators, and industrial conglomerates contending for share. Schneider Electric, Microsoft, and IBM integrate hardware sensors, cloud back ends, and AI libraries into unified suites that promise end-to-end coverage from meter to boardroom. Their scale permits global service teams, accelerating rollouts for multinational clients facing simultaneous audit deadlines across continents. Artificial-intelligence roadmaps dominate investor briefings, as providers demonstrate how conversational interfaces and autonomous agents can parse regulatory text or recommend remediation projects. Partnerships with accounting networks and legal publishers help embed continuously updated rule engines inside platforms, strengthening differentiation.
Emerging specialists carve out white-space segments. vorteX-io focuses on hydrological sensing, using low-power microstations for flood early-warning services. Badger Meter targets utility water networks, combining ultrasonic flow meters with cloud dashboards to address overflow-spill mandates. These companies win contracts where incumbents offer broad but shallow functionality, proving that domain depth can outrun portfolio breadth. Targeted acquisitions accelerate capability expansion; recent deals in underwater-sensor and sewer-monitoring niches signal intensified consolidation as demand scales.
Consultancies and systems integrators pivot toward recurring-revenue managed services, recognizing that regulatory churn keeps advisory needs evergreen. They co-create accelerators with software vendors, offering pre-configured disclosure templates and data-quality scorecards. Platform providers reciprocate by embedding consultant marketplaces inside product consoles, lowering client switching friction. In the sustainability market, competitive advantage over the forecast horizon will stem from the ability to convert terabytes of raw data into executive-level insights that guide capital allocation, shifting emphasis from mere data collection to decision intelligence.
Sustainability Industry Leaders
Schneider Electric
NEC Corporation
Microsoft
IBM
Salesforce
- *Disclaimer: Major Players sorted in no particular order

Recent Industry Developments
- May 2025: Schneider Electric began a multi-year program to build an AI-native ecosystem for sustainability and energy management using Agentic AI technology.
- April 2025: Schneider Electric published guidance on modernizing the United States energy grid to handle a projected 50% demand surge linked to AI growth by 2030.
- March 2025: vorteX-io raised EUR 2.9 million to deploy 2,000 hydrological microstations for flood-risk monitoring by 2026.
- February 2025: Badger Meter acquired SmartCover Systems for USD 185 million to enhance real-time sewer-network monitoring.


Research Methodology Framework and Report Scope
Market Definitions and Key Coverage
Our study defines the sustainability market as the total spend on digital solutions and related services that let enterprises monitor, measure, report, and trim environmental footprints across energy, materials, water, and emissions. The scope spans IoT sensors, carbon and ESG software, analytics platforms, and implementation services that convert raw operational data into actionable sustainability outcomes.
Scope Exclusion: Activity limited to pure-play sustainable financing instruments or standalone advisory contracts sits outside this market to avoid overlap with finance and consulting studies.
Segmentation Overview
- By Component
- Solutions
- Services
- By Technology
- Internet of Things (IoT)
- AI & Analytics
- Digital Twin
- Cloud Computing
- Blockchain
- By Application
- Green Building
- Carbon Footprint Management
- Air & Water Pollution Monitoring
- Weather Monitoring & Forecasting
- Fire Detection
- Crop Monitoring
- Soil & Forest Monitoring
- By End-User Industry
- Manufacturing
- Energy & Utilities
- Transport & Logistics
- Consumer Goods & Retail
- Healthcare & Life Sciences
- BFSI
- ICT & Telecom
- Others
- By Organization Size
- Large Enterprises
- Small & Mid-Sized Enterprises
- By Deployment Mode
- Cloud
- On-Premise
- By Geography
- North America
- United States
- Canada
- Mexico
- South America
- Brazil
- Argentina
- Peru
- Rest of South America
- Europe
- United Kingdom
- Germany
- France
- Italy
- Spain
- BENELUX (Belgium, Netherlands, and Luxembourg)
- NORDICS (Denmark, Finland, Iceland, Norway, and Sweden)
- Rest of Europe
- Asia-Pacific
- China
- India
- Japan
- Australia
- South Korea
- ASEAN (Indonesia, Thailand, Philippines, Malaysia, Vietnam)
- Rest of Asia-Pacific
- Middle East and Africa
- Saudi Arabia
- United Arab Emirates
- Qatar
- Kuwait
- Turkey
- Egypt
- South Africa
- Nigeria
- Rest of Middle East and Africa
- North America
Detailed Research Methodology and Data Validation
Primary Research
We spoke with software providers, facility managers, energy auditors, and ESG officers across North America, Europe, and Asia-Pacific. Their insights clarified adoption barriers, typical selling prices, and imminent regulatory triggers, which guided stress testing of secondary assumptions.
Desk Research
Mordor analysts gathered public statistics from sources such as the UN-FCCC, International Energy Agency, US EPA, Eurostat, and China's National Bureau of Statistics, then blended them with customs trade codes and patent filings that reveal technology adoption. Company 10-K reports, investor presentations, trade association yearbooks, and respected business press helped benchmark pricing shifts and rollout timelines. Paid data sets including Dow Jones Factiva and D&B Hoovers supplied vendor revenue splits that grounded roll-ups. This list is illustrative; many additional references informed data collection and validation.
Supplementary evidence came from peer-reviewed journals quantifying decarbonization paybacks and regional policy trackers mapping incoming disclosure rules. These items framed realistic penetration ceilings before being tested in interviews.
Market-Sizing & Forecasting
A top-down construct begins with global ICT spend and industrial energy bills, which are filtered through solution penetration rates revealed by trade data and primary interviews. Supplier roll-ups of sampled contracts and average price points give a bottom-up sense check before totals are finalized. Key variables include smart meter installations, cloud migration rates, carbon price trajectories, electricity intensity of GDP, and counts of enterprises submitting disclosure reports. Forecasts rely on multivariate regression paired with scenario analysis that aligns each variable's outlook with expert consensus.
Data Validation & Update Cycle
Outputs pass anomaly and variance checks against independent indicators, after which senior analysts review outliers. Reports refresh annually, and interim updates follow material policy or technology shifts so clients always receive the latest view.
Why Mordor's Sustainability Baseline Earns Decision Maker Trust
Published estimates often diverge because each provider picks its own scope, currency conversion, and refresh cadence, and totals swing when hardware or compliance costs are handled differently.
Benchmark comparison
| Market Size | Anonymized source | Primary gap driver |
|---|---|---|
| USD 24.40 B | Mordor Intelligence | |
| USD 25.47 B | Global Consultancy A | Treats governance risk tools and advisory fees as part of market |
| USD 28.13 B | Industry Journal B | Adds smart building hardware that our scope excludes |
The comparison shows how scope drift and irregular refresh cycles inflate or compress totals, whereas Mordor's disciplined variable selection and yearly update rhythm give decision makers a balanced, transparent baseline.


Key Questions Answered in the Report
What is the current size of the sustainability market?
The sustainability market stands at USD 29.07 billion in 2026 and is projected to reach USD 69.72 billion by 2031, reflecting a 19.12% CAGR.
Which region leads the sustainability market today?
North America holds the largest share at 35.02% of 2025 revenue, driven by stringent disclosure mandates and advanced technology ecosystems.
Which application area is growing fastest?
Carbon footprint management is expanding at a 21.55% CAGR as enterprises set net-zero targets and require granular emissions data.
How are financial institutions using sustainability data?
Banks and asset managers integrate emissions metrics into loan pricing, portfolio risk assessments, and sustainability-linked financing products, fueling a 19.24% CAGR in BFSI technology spending.
Page last updated on:


