
Printer Market Size and Share
Market Overview
| Study Period | 2020 - 2031 |
|---|---|
| Market Size (2026) | USD 70.06 Billion |
| Market Size (2031) | USD 88.78 Billion |
| Growth Rate (2026 - 2031) | 4.85 % |
| Fastest Growing Market | Asia Pacific |
| Largest Market | Asia Pacific |
| Market Concentration | Medium |
Major Players *Disclaimer: Major Players sorted in no particular order Image © Mordor Intelligence. Reuse requires attribution under CC BY 4.0. | |
Printer Market Analysis by Mordor Intelligence
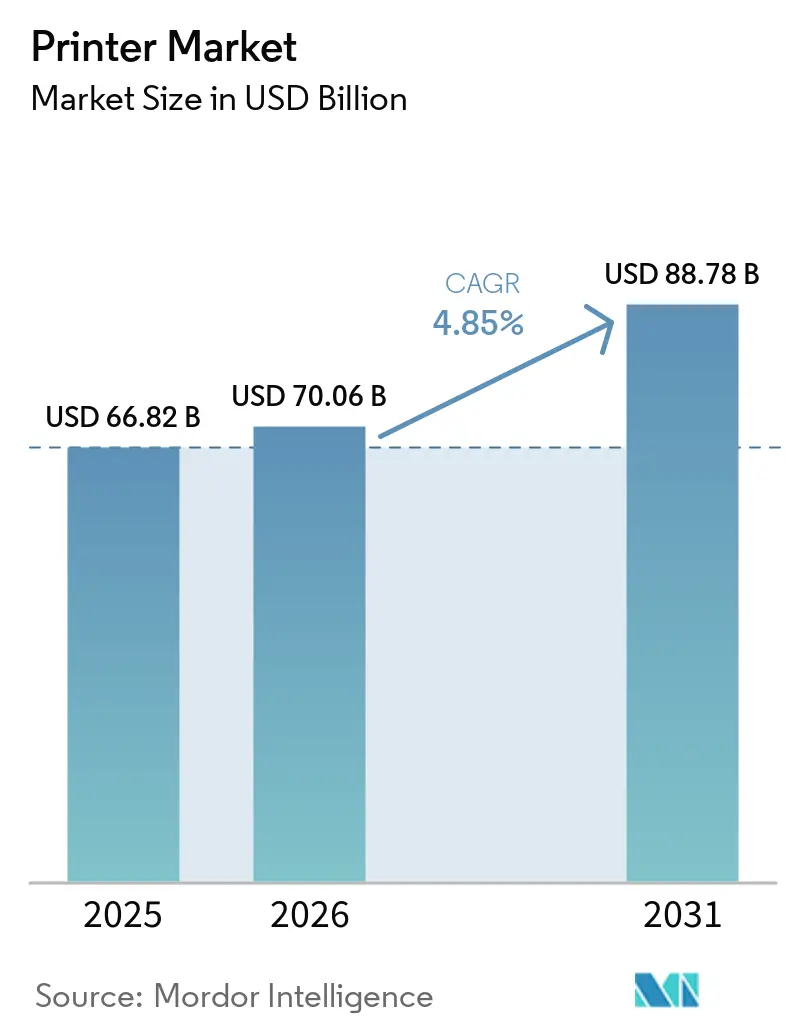
The Printer Market size was valued at USD 66.82 billion in 2025 and estimated to grow from USD 70.06 billion in 2026 to reach USD 88.78 billion by 2031, at a CAGR of 4.85% during the forecast period (2026-2031).
Growth endures as traditional office printing contracts but new demand emerges from e-commerce logistics, packaging premiumization, and sustainability-driven upgrades. Multi-functional devices that consolidate print, scan, copy, and fax functions now dominate procurement decisions in hybrid offices. Ink-tank economics, thermal labeling for last-mile delivery, and color output for brand marketing keep hardware refresh cycles active even as printed office pages fall 20% from pre-pandemic levels. Manufacturers diversify into industrial and healthcare niches, buffering the printer market against digital substitution. Asia-Pacific leads revenue expansion, supported by manufacturing digitization, traceability rules, and expanding small business ecosystems.
Key Report Takeaways
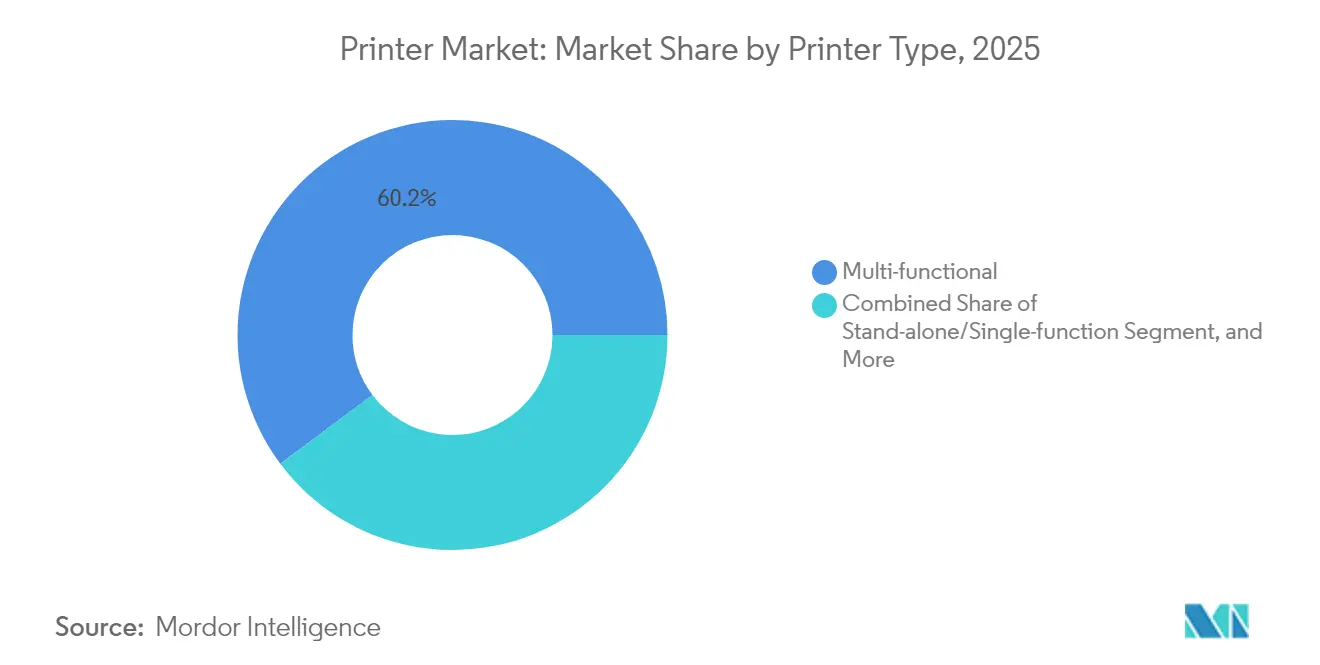
- By printer type, multi-functional models held 60.22% of the printer market share in 2025; large-format units posted the fastest 5.12% CAGR through 2031.
- By technology, inkjet accounted for 48.10% of the printer market size in 2025, while thermal technology registers the highest 5.05% CAGR to 2031.
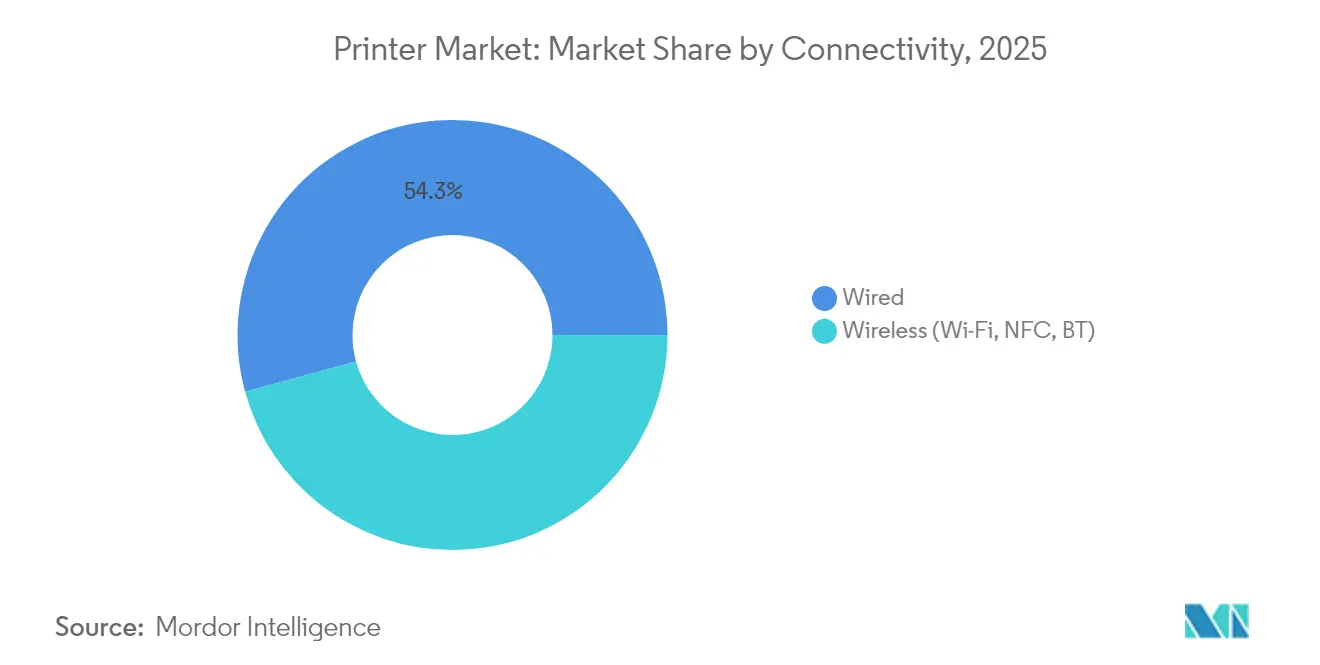
- By connectivity, wired interfaces retained 54.25% share of the printer market size in 2025; wireless options grow at 5.52% CAGR on rising IoT integration.
- By output, color devices captured 58.65% of the printer market size in 2025 and expanded 4.74% annually to 2031.
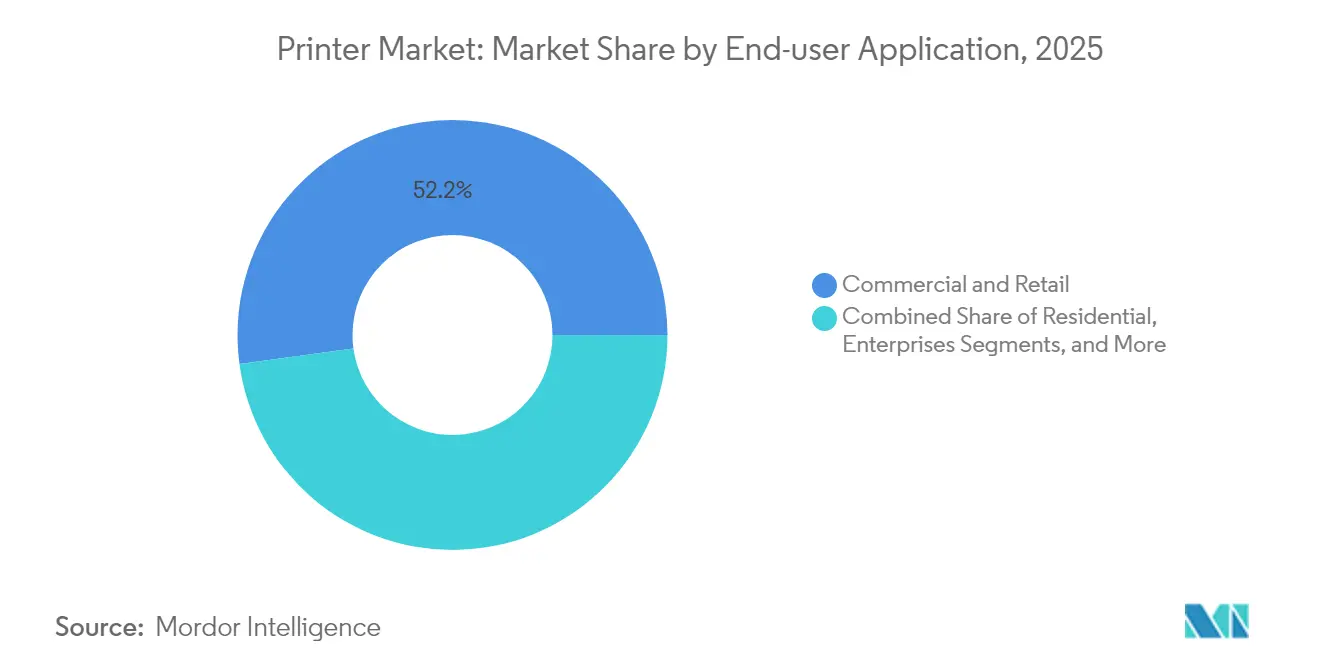
- By end-user, commercial sites contributed 52.15% revenue in 2025; healthcare and logistics adoption led with a 6.25% CAGR.
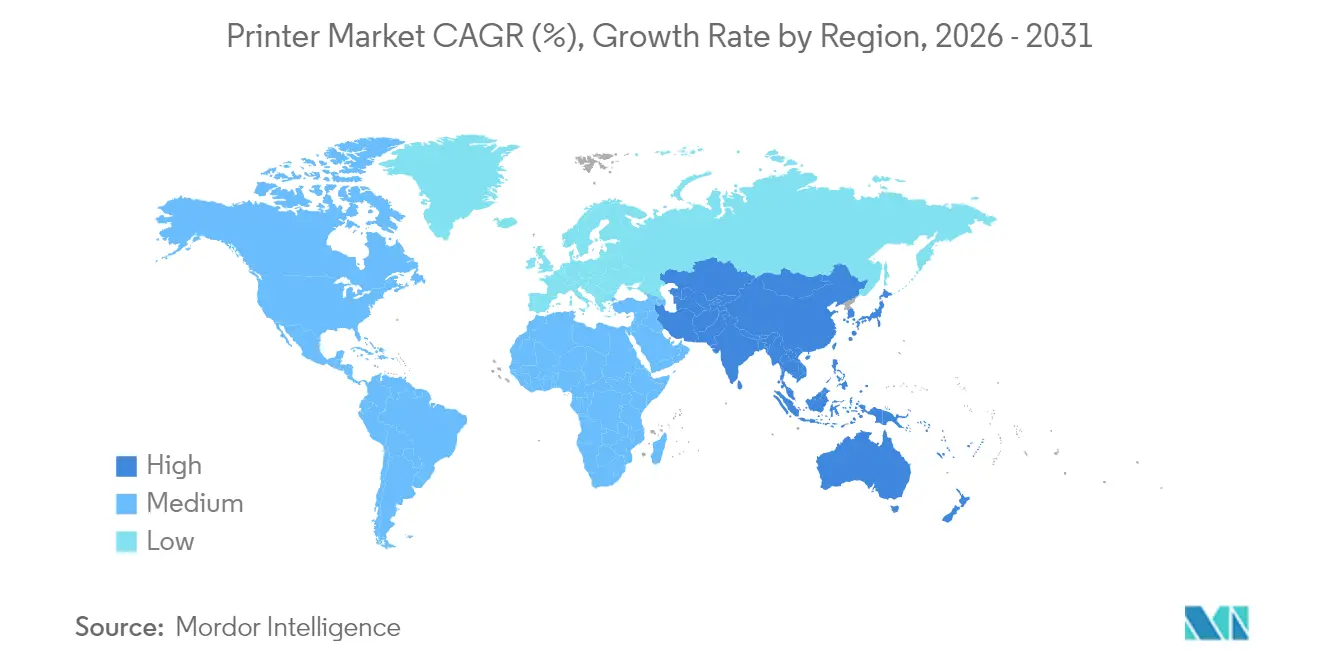
- By region, Asia-Pacific commanded 41.10% revenue in 2025 and is set to post a 5.02% CAGR through 2031.
Note: Market size and forecast figures in this report are generated using Mordor Intelligence’s proprietary estimation framework, updated with the latest available data and insights as of 2026.
Global Printer Market Trends and Insights
Drivers Impact Analysis*
| Driver | (~) % Impact on CAGR Forecast | Geographic Relevance | Impact Timeline |
|---|---|---|---|
| Surge in e-commerce parcel volumes boosting industrial thermal label printer demand | +0.8% | Asia-Pacific core, spill-over to North America | Medium term (2–4 years) |
| Rapid adoption of ink-tank/EcoTank models lowering total cost of ownership | +0.7% | Global, strongest in Asia-Pacific and Latin America | Long term (≥ 4 years) |
| Secure hard-copy archiving of critical documents | +0.5% | Global, notably North America and Europe | Short term (≤ 2 years) |
| Packaging premiumization driving UV-curable inkjet printers | +0.6% | North America and Europe, expanding to Asia-Pacific | Medium term (2–4 years) |
| Sustainability pledges accelerating transition to LED printers | +0.4% | Europe core, expanding globally | Long term (≥ 4 years) |
| Wireless connectivity adoption enabling distributed workflows | +0.3% | Global | Short term (≤ 2 years) |
| Source: Mordor Intelligence | |||
Surge in e-commerce parcel volumes boosting industrial thermal label printer demand in Asia-Pacific
Thermal printers now underpin parcel routing across mega-fulfilment hubs in China, India, and the ASEAN bloc. The equipment’s ribbon-less architecture withstands humidity and dust while supporting millions of scannable labels per shift. Mandates for pharmaceutical and food traceability intensify demand for durable codes that survive bulk transport and cold-chain handling. Logistics operators select high-speed 6-inch models to streamline pick-pack-ship, and regional manufacturing supremacy compounds volume requirements. These fundamentals give thermal technology the strongest pull on the Asia-Pacific printer market growth, apec.org.
Rapid adoption of ink-tank/EcoTank models lowering total cost of ownership in emerging economies
Epson’s shipment of 100 million EcoTank devices confirms latent appetite for cartridge-free printing, particularly among budget-focused micro-businesses.[1]Epson, “Epson High-Capacity Ink Tank Inkjet Printers Surpass 100 Million Units,” corporate.epson Refillable reservoirs slash per-page costs by up to 90% and reduce landfill waste by minimizing single-use plastics. Savings allow family stores, tuition centers, and start-ups to expand outreach materials without steep running expenses. Lower CO₂ emissions strengthen compliance with green-procurement policies rolled out by several Latin American ministries. Together, these factors secure a multi-year boost to the printer market across high-population economies.
Secure hard-copy archiving of critical documents
Hospitals, banks, and ministries uphold physical file rooms as cyber-risk safeguards. Regulations in the United States, Germany, and Japan still require tamper-evident paper copies for audit trails, disaster recovery, and classified material. Vendors respond with embedded watermarking, encrypted job release, and self-erasing solid-state drives. Premium security functions command higher average selling prices, supporting revenue even as page counts taper. This compliance-driven niche preserves value for the printer market among risk-averse enterprises.
Packaging premiumization driving UV-curable inkjet printers for short-run labels
Consumer brands chase shelf appeal with textured, high-definition labels executed in batches of a few hundred meters. HP Indigo V12 reaches 120 linear m/min while delivering 1,600 dpi graphics, replacing multiple flexographic lines and shrinking carbon footprints.[2]HP Inc., “HP Indigo V12 Digital Press,” hp.com The capability to apply spot varnish and white ink in a single pass unlocks differentiated packaging for craft beverages, cosmetics, and nutraceuticals. Short-run agility also benefits e-commerce sellers who tailor seasonal promos, sustaining high-margin hardware demand inside the wider printer market.
Restraints Impact Analysis*
| Restraint | (~) % Impact on CAGR Forecast | Geographic Relevance | Impact Timeline |
|---|---|---|---|
| Corporate cloud migration shrinking transactional print volumes | −1.2% | Global, strongest in North America and Europe | Long term (≥ 4 years) |
| Rising raw-material costs inflating consumable prices | −0.8% | Global, particularly affecting emerging markets | Medium term (2–4 years) |
| RoHS3 compliance costs limiting low-cost laser launches | −0.3% | Europe core, minimal global impact | Short term (≤ 2 years) |
| Digital signature adoption curbing check and form printing | −0.4% | North America & Europe, expanding globally | Medium term (2–4 years) |
| Source: Mordor Intelligence | |||
Corporate cloud migration shrinking transactional print volumes
Enterprise pivot to digital signatures, e-billing, and online forms pushes paper out of everyday workflows. HP confirmed a 20% page decline versus pre-COVID peaks. The shift is structural, supported by CFO mandates for paperless savings and ESG scorecards discouraging print dependence. While specialty verticals still require hard copies, the secular headwind caps overall unit growth in mature territories. Vendors counter by bundling workflow software and managed services, yet core office consumption continues to recede.
Rising raw-material costs inflating consumable prices
Tariffs on metals, plastics, and semiconductors, combined with volatile petrochemical feedstocks, have lifted toner and ink input costs. A 25% duty on several components sourced from Mexico, Canada, and China forced price adjustments across print consumables. Small and medium businesses delay equipment refreshes, stretching current fleets and dampening replacement cycles. Manufacturers explore bio-based toners and local sourcing to cushion shocks, yet pass-through pricing still narrows demand in price-sensitive regions, moderating printer market expansion.
*Our forecasts treat driver/restraint impacts as directional, not additive. The impact forecasts reflect baseline growth, mix effects, and variable interactions.
Segment Analysis
By Printer Type: Multi-functional Devices Reinforce Fleet Consolidation
Multi-functional printers held 60.22% of 2025 revenue, anchoring the printer market where hybrid workers need flexible, compact hardware. Vendors integrate auto-double-siding, voice-activated commands, and cloud connectors so units pivot seamlessly between home and office desks. Stand-alone laser engines persist in banks and government bureaus that lock down functions for security, but volumes decline as enterprises prioritize consolidation.
Large-format systems chart the fastest 5.12% CAGR, propelled by on-demand packaging proofs, wide-banner advertising, and architectural visualization workflows. The segment benefits from print-for-pay shops shifting to digital rolls that minimize substrate waste. Industrial presses serving corrugated and flexible packaging claim premium pricing as brand owners shorten product cycles. These dynamics keep the printer market resilient even while general office volumes soften.



By Technology Type: Inkjet Leads, Thermal Accelerates
Inkjet technology captured 48.10% of 2025 revenue and anchors the printer market via home, office, and light production segments. Breakthrough PrecisionCore and piezo heads raise native speeds and widen media latitude, helping inkjet displace entry laser units in school districts and SOHOs. The printer market size for inkjet installations in production label lines is projected to grow at an overall 4.43% CAGR as the cost per image falls.
Thermal engines, though smaller by value, outpace peers at 5.05% CAGR, lifted by parcel labeling, specimen tracking, and wristband printing. Energy-efficient LED models gain mindshare in Europe, where eco procurement frameworks reward lower power draw. Conversely, laser shipments face a sunset schedule at Epson, which will exit the category by 2026 to prioritize climate goals.
By Connectivity: Wireless Uptake Supports Distributed Offices
Wired interfaces remain essential for data-sensitive networks and own 54.25% of 2025 sales. Finance, defense, and healthcare facilities keep Ethernet lines to ensure deterministic performance and compliance. Yet the wireless cohort grows 5.52% annually as Wi-Fi 6 routers proliferate and zero-trust frameworks mature.
Smartphone-initiated print, NFC tap-to-release, and cloud-queued jobs allow staff to operate anywhere, sustaining demand for firmware that over-the-air patches vulnerabilities. AI-assisted setup unveiled by HP improves out-of-box deployment and noise optimization, encouraging SMB migration. Combined, these forces pivot the printer market toward flexible architectures that align with modern IT policies.
By Output Type: Color Retains Marketing Muscle
Color lines delivered 58.65% of 2025 sales and maintain a 4.74% growth slope as consumer-facing brands refresh signage, menus, and shelf talkers. Retailers harness vivid point-of-sale graphics to lift basket value, while digital print’s variable data lets loyalty campaigns target micro-segments. Resin, latex, and UV inks broaden substrate options, extending color adoption into flooring, décor, and rigid plastics.
Monochrome office printers still dominate bank statements, legal briefs, and judicial filings. Higher-yield toner bottles and duplex defaults curb paper and cartridge costs, locking in relevance. Nonetheless, price compression narrows gaps; when a four-color page costs cents, not dimes, enterprises blend color into everyday communication, injecting incremental growth into the broader printer market.
By End-user Application: Healthcare and Logistics Outperform
Commercial venues, from creative agencies to convenience stores, produced 52.15% of 2025 revenue, backing everyday office tasks and transaction receipts. Meanwhile, healthcare and logistics add the fastest 6.25% CAGR as traceability rules demand barcoded wristbands, specimen labels, and shipping tickets. Hospitals procure disinfectant-resistant casings and antimicrobial plastics, lifting average selling prices.
Residential demand steadies on homework prints and craft projects, though tablet adoption trims page counts. Education orders sync with academic cycles, relying on duty cycles that survive exam season bursts. Government agencies sustain bid opportunities through voter registration drives and passport printing that require tamper-proof inks. Across these settings, specialist needs carve pockets of resilience within the printer market.
Geography Analysis
Asia-Pacific commands 41.10% of 2025 revenue and accelerates at a 5.02% CAGR, driven by factory automation in China and India, plus burgeoning e-commerce. Provincial grants for smart manufacturing subsidize digital label lines and serial-numbered packaging. National ID and healthcare card initiatives mandate secure print infrastructure, adding tailwinds to the printer market in the region.
North America’s mature fleet gradually transitions from legacy toner boxes to energy-sipping ink deposits. Security mandates such as HIPAA sustain hard-copy repositories even as cloud file-sharing rises. Packaging converters deploy digital presses in quick-turn cosmetic and nutraceutical lines, nurturing pockets of growth.
Europe faces cost headwinds from RoHS3 and energy taxes, yet circular-economy rules prompt organizations to adopt repairable chassis and recycled consumables, sustaining replacement momentum. Eastern Europe sees incremental demand tied to near-shoring factories that require in-plant labeling. Overall, geographic spread balances the printer market against macro shocks.

Regulatory Landscape
Sustainability and circular-economy compliance is tightening for imaging equipment and consumables across major regions, shaping printer design, materials, and firmware practices. In the European Union, the Ecodesign for Sustainable Products Regulation (Regulation (EU) 2024/1781, published June 2024) provides the framework that is being operationalized through preparatory work on imaging equipment and its consumables (European Commission JRC study, February 2024). This reinforces requirements around durability, reparability, and resource efficiency that affect both office and production devices.
Asia is also formalizing printer-related green assessment standards. China advanced national standards for green product assessment covering printers and multifunction devices (GB/T 44447-2024 implemented March 2025) and related copying devices (GB/T 45600-2025 implemented August 2025), pushing OEMs and suppliers toward compliant materials and energy performance claims. Procurement and compliance pressures are evolving at the same time: EPEAT 2.0 criteria for imaging equipment were implemented in March 2026 via the Global Electronics Council, tightening expectations that products should not block remanufactured cartridges through circuitry or firmware practices. EU due-diligence rules for deforestation-linked inputs (EUDR) also keep printed packaging and labels in scope, with the revised compliance deadline for large companies set at December 30, 2026.
Value Chain Analysis
The printer value chain spans component suppliers (printheads, imaging chips, motors, plastics, metals), OEM design and assembly (often centralized), consumables (inks, toners, drums, media), and downstream channels including distributors, resellers, e-commerce, and managed print and service partners. Concentration risks persist in specialized inputs, such as thermal printheads and key consumables components concentrated among limited suppliers in Japan and Germany. Parts availability and lead times can also be constrained by semiconductor-dependent imaging chips, contributing to reported 8 to 12 week delivery delays in some supply conditions.
OEMs are actively restructuring procurement and go-to-market linkages to stabilize cost and availability and to expand into higher-value production segments. In January 2025, Fujifilm Business Innovation and Konica Minolta formalized Global Procurement Partners Corp to coordinate procurement of raw materials and parts and collaborate on toner development across MFPs, desktop, and production printers. Channel and OEM sourcing partnerships also shape downstream availability and portfolios, including Fujifilm Business Innovation partnering with SumnerOne in April 2025 to deliver Revoria Press and Acuity wide-format inkjet solutions in North America. Xerox also signed an agreement with Kyocera Document Solutions in July 2025 to source high-speed cut-sheet inkjet production presses, expanding Xeroxs production print offering while leveraging Kyoceras platform capabilities.
Competitive Landscape
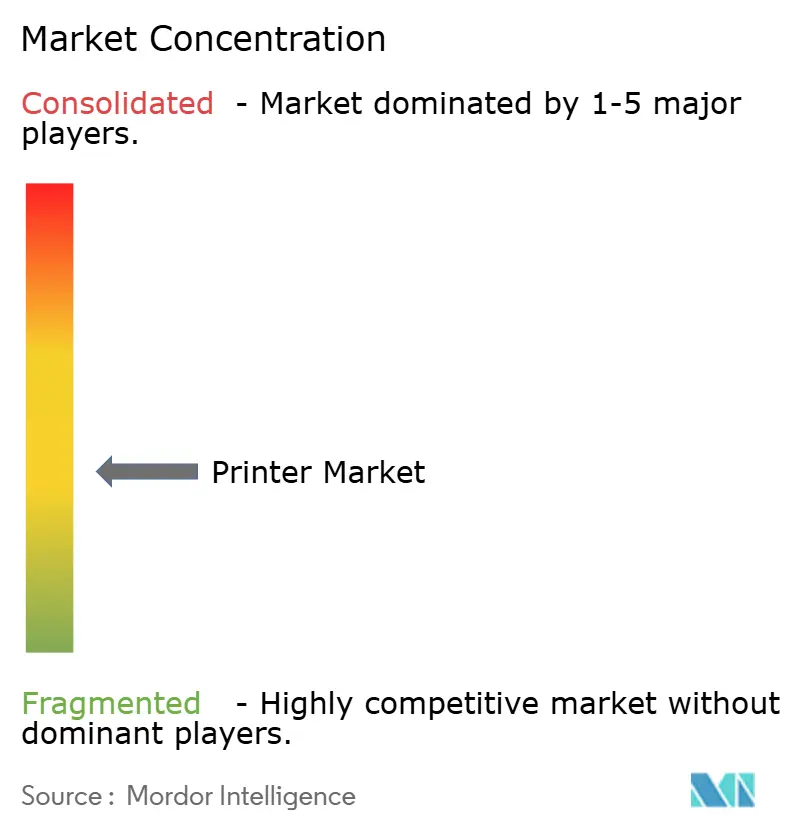
The printer market shows moderate consolidation as diversified conglomerates snap up workflow software and specialty suppliers. Xerox announced a USD 1.5 billion takeover of Lexmark to expand A4 color reach and capture USD 200 million in synergies within two years. Epson spent USD 591 million on Fiery, securing raster image processing assets that elevate print fidelity in high-speed environments.[3]Seiko Epson Corporation, “Notice on the Acquisition of Equity Interest in Fiery,” corporate.epson
Joint ventures also reshape scale economics. Ricoh, Toshiba Tec, and OKI merged device engineering under the ETRIA alliance to share component platforms and shrink costs. Heidelberg reinforces offset heritage with digitally enabled post-press and subscription analytics, leveraging Asia-Pacific momentum for FY 2025/26 growth.
Strategic priorities concentrate on carbon reduction, AI automation, and industrial diversification. Vendors pledge recycled plastics, LED-based fusing, and bio-toners to win enterprise sustainability tenders. Cloud dashboards predict consumable depletion and schedule pre-emptive maintenance, lifting service attach rates. As a result, competition shifts from price points to lifetime value, keeping margins intact for leaders while second-tier brands struggle for visibility in the global printer market.
Printer Industry Leaders
HP Inc.
Canon Inc.
Seiko Epson Corporation
Brother Industries, Ltd.
Xerox Corporation
- *Disclaimer: Major Players sorted in no particular order

Market Opportunities and Future Outlook
Opportunity is expanding where printer hardware is bundled with higher-assurance security, fleet software, and automation that supports hybrid work and regulated document handling. Enterprise and SMB refresh demand is being redirected toward devices and platforms that reduce IT overhead and strengthen compliance posture, supported by vendor moves such as HPs March 2026 LaserJet announcements that emphasized quantum-resistant security and faster digitization features. As multi-functional devices continue to dominate procurement decisions in hybrid offices, competitive differentiation is shifting toward secure firmware, job release, and workflow integration.
Industrial and production print remains a key whitespace for vendors seeking to offset declining transactional office pages, especially in packaging and labels where traceability and sustainability requirements are rising. Canon added the ColorStream 7000 series to its web-fed production inkjet portfolio in June 2026, highlighting AI-enabled maintenance as an operational lever for uptime-sensitive print environments. Sustainability-linked requirements also create openings for compliant materials and verified environmental reporting in print production, supported by ISO 22067-2:2026 on collecting and documenting environmental data for print finishing and by EUDR rules that continue to cover printed packaging and labels even after the EU clarified that products under HS code 49 (books, newspapers, commercial print) are excluded.
Recent Industry Developments
- July 2026: Brother International Corporation launched a next-generation INKvestment all-in-one printer series for small businesses and home offices, emphasizing high in-box ink and a compact footprint. The launch targets total cost of ownership sensitivity in SOHO segments while supporting the broader shift toward ink-efficient platforms that compete with cartridge models.
- March 2026: HP announced new LaserJet Pro 4000/4100 and LaserJet Enterprise 5000/6000 series printers, highlighting quantum-resistant security positioning alongside AI-enabled digitization features. The launch reinforces vendor emphasis on security-led refresh cycles and aligns print hardware roadmaps with zero-trust and regulated-document workflows.
- January 2026: Canon finalized the acquisition of the remaining 44.99% stake in Canon Electronics Inc. via a tender offer, making it a wholly owned subsidiary. Full ownership tightens control over a key group entity and supports deeper operational integration across hardware, components, and adjacent capabilities that influence Canons imaging and printing portfolio execution.


Research Methodology Framework and Report Scope
Market Definition and Coverage
For this study, the printer market covers revenue earned from hardware printers sold to home, office, and institutional buyers across major geographies. It includes common printer technologies and form factors used for document, label, and photo output, counted when a device is sold as a printer.
Scope exclusions: We exclude inks, toners, paper, printer servicing contracts, and pure scanning devices when they are not sold as printers.
Segmentation Overview
- By Printer Type
- Multi-functional
- Stand-alone/Single-function
- Large-format
- Industrial/Production
- By Technology Type
- Inkjet
- Laser
- LED
- Thermal (Direct and Transfer)
- Dot-Matrix
- By Connectivity/Interface
- Wired
- Wireless (Wi-Fi, NFC, BT)
- By Output Type
- Color
- Monochrome
- By End-user Application
- Residential
- Commercial and Retail
- Educational Institutions
- Enterprises
- Government
- Healthcare and Logistics
- By Geography
- North America
- United States
- Canada
- Mexico
- Europe
- Germany
- United Kingdom
- France
- Nordics
- Rest of Europe
- South America
- Brazil
- Rest of South America
- Asia-Pacific
- China
- Japan
- India
- Southeast Asia
- Rest of Asia-Pacific
- Middle East and Africa
- Middle East
- GCC
- Turkey
- Rest of Middle East
- Africa
- South Africa
- Rest of Africa
- Middle East
- North America
Data Sources, Market Sizing, and Validation
Desk Research
Desk work started with mapping demand and supply signals that can be checked in public records, and then aligning definitions so the same product scope is carried through the model. We used sources such as UN Comtrade for trade flows, the USITC DataWeb for US imports and exports, and national statistics portals (for example, the US Census Bureau) for broader electronics indicators that help explain printer demand swings.
To understand technology adoption and operating conditions, we also referenced sources such as IEEE and other peer reviewed journals for print technology trends, WIPO for patent activity around printing and imaging, and customs tariff schedules that help separate printer equipment from consumables. These were complemented with company filings, earnings notes, investor presentations, and trusted press coverage for pricing direction, channel commentary, and mix changes. We also leaned on an approved paid subscription for company financials and another for shipment level trade records to cross-check volumes where HS splits were clear. This source list is not exhaustive, and many other public materials were reviewed to collect, validate, and clarify data points.
Primary Interviews and Surveys
Primary discussions were run with printer OEM side teams, component suppliers, channel participants, and large buyer groups such as enterprise IT and commercial print operators. We used these inputs to confirm which device classes are actively being bought, how ASPs move by technology and output class, and what replacement cycles look like across APAC, EMEA, and the Americas.
Distribution of primary research fieldwork respondents
| Company type | Respondent position | Region |
|---|---|---|
| Top tier: 26% | CXOs: 12% | APAC: 37% |
| Mid tier: 58% | Functional/Unit leaders: 31% | EMEA: 36% |
| Smaller Players: 16% | Managers: 57% | Americas: 27% |
Market-Sizing & Forecasting
Sizing starts with a top-down build where we reconstruct addressable printer hardware revenue by combining demand pools and supply signals, such as office worker base trends, device replacement timing, and trade and production direction for printer equipment. Those totals are then pressure tested using selective bottom-up approximations, including sampled ASP times shipments by major technology groups and channel checks on unit mix, which helps us adjust totals when one data series appears distorted.
Inputs that mattered for this market include unit shipment direction by technology (inkjet, laser, thermal, and dot matrix), split between multifunction and single function devices, color versus monochrome mix, and wired versus wireless adoption that can shift pricing. We also track enterprise digitization intensity, education and government procurement patterns, and retail and logistics label printing demand, since these can move volumes even when home printing is flat. Forecasting is done using scenario analysis supported by light multivariate regression. Core variables like replacement cycle, ASP progression, and regional demand drivers are projected, then reviewed with an interview-based consensus. When a clean bottom-up roll-up is not possible for a niche device class, we handle the gap by applying conservative shipment shares and verified price bands, and then re-checking the result against trade and channel indicators.
Data Validation & Update Cycle
Validation is done in several passes so the final numbers stay internally consistent and also make sense against external signals. We compare the model output with independent checks such as trade direction, category shipment commentary, and the implied average selling price range, and then investigate any sharp year to year jumps before sign-off.
A second analyst review is used to test assumptions, redo key calculations, and confirm that scope exclusions were kept consistent across regions and years. Reports are refreshed annually, and interim updates are made when there are material events that can move pricing, availability, or demand. Before delivery, a final review pass is completed so clients receive the most current view that can be supported with clear working steps.
Mordor Intelligence's Printer Market Estimate Compared With Other Published Estimates
It is normal to see different printer market values in the public domain because not everyone counts the same things or uses the same timing for currencies, ASPs, and refreshes. The biggest differences usually come from product scope, whether the number is hardware only or a wider printing ecosystem, and how replacement demand is estimated when digital workflows change print volumes.
For this market, one common gap driver is that some estimates bundle in non-hardware categories like consumables or print services, which can lift the value even when device shipments are steady. Another driver is the inclusion of adjacent equipment like offset and flexographic presses, or even 3D printers, which changes the addressable set and the pricing structure. Differences also show up when older base years are carried forward without re-checking regional unit mix, or when aggressive versus conservative scenarios are presented as a single point number, which is why the scope and checks matter for comparability.
Benchmark comparison
| Source | Market Size | Gaps in Research Methodology |
|---|---|---|
| Mordor Intelligence | USD 70.06 B (2026) | |
| Industry Publisher A | USD 78.90 B (2025) | Uses a broader definition that can include adjacent printer categories such as offset, flexographic, and 3D printing equipment, which raises the total versus hardware printer devices only. |
| Industry Analytics B | USD 85.31 B (2031) | Reported year and scope structure differ, with revenue and unit modeling anchored on a 2024 base and a narrower split by inkjet and laser, which can shift ASP assumptions and mix timing versus a multi-technology device view. |
The table indicates that the spread mainly comes from what is counted as a printer and the year being referenced, not just from calculation differences. By keeping the number tied to printer hardware sales and checking it against trade signals, device mix, and realistic ASP ranges, a like-for-like view is produced, which explains the level used by Mordor Intelligence.


Key Questions Answered in the Report
What is the current value of the global printer market?
The printer market stands at USD 70.06 billion in 2026 and is projected to reach USD 88.78 billion by 2031.
Which printer type holds the largest share today?
Multi-functional printers lead with 60.22% revenue share in 2025 thanks to space-saving and cost consolidation benefits.
Why is Asia-Pacific the fastest-growing region for printers?
Manufacturing digitization, booming e-commerce logistics, and government traceability mandates lift printer demand, driving a 5.02% regional CAGR through 2031.
How are sustainability goals shaping printer technology?
Vendors pivot toward LED and inkjet architectures, bio-based toners, and recyclable parts to meet corporate carbon commitments and regulatory standards.
What impact does cloud adoption have on print volumes?
Enterprise migration to digital workflows reduces transactional printing, contributing a -1.2% impact on the overall CAGR, though specialty niches keep demand stable.
Which connectivity option is gaining traction in modern offices?
Wireless printing grows at 5.52% CAGR as Wi-Fi 6 and zero-trust security make distributed printing both convenient and compliant.
Page last updated on:


 Your data is secure and never sold or shared.


