Managed Print Services Market Size and Share
Market Overview
| Study Period | 2020 - 2031 |
|---|---|
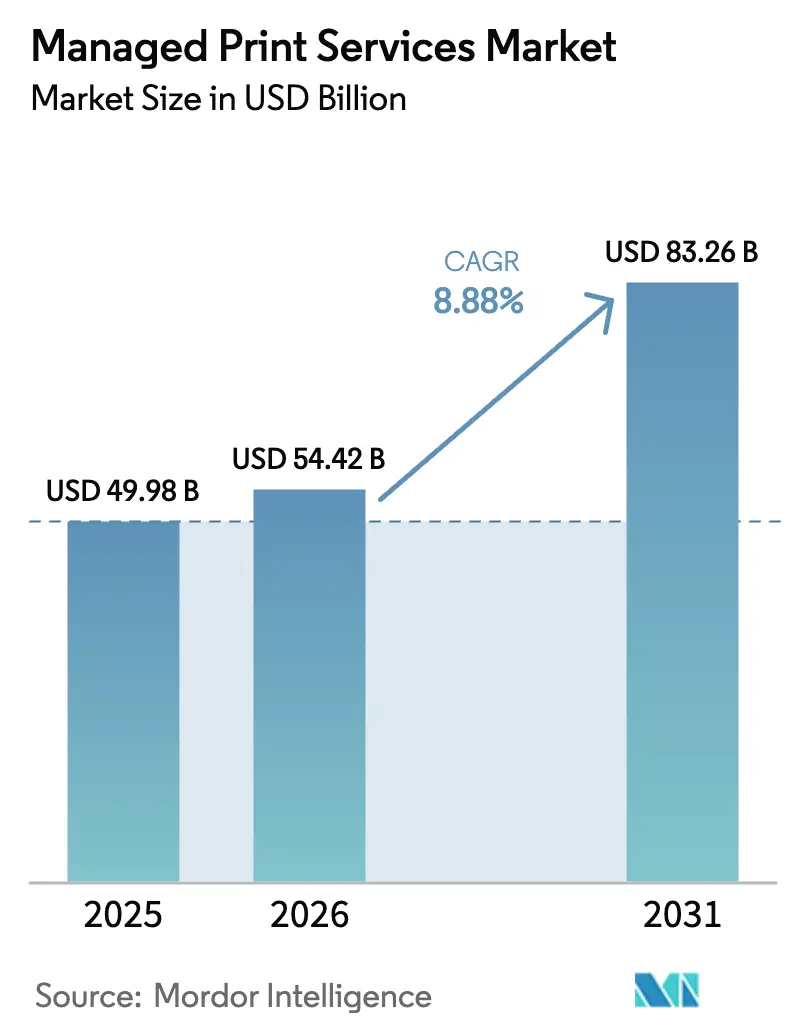
| Market Size (2026) | USD 54.42 Billion |
| Market Size (2031) | USD 83.26 Billion |
| Growth Rate (2026 - 2031) | 8.88% CAGR |
| Fastest Growing Market | Asia Pacific |
| Largest Market | North America |
| Market Concentration | Medium |
Major Players *Disclaimer: Major Players sorted in no particular order Image © Mordor Intelligence. Reuse requires attribution under CC BY 4.0. | |
Managed Print Services Market Analysis by Mordor Intelligence
The Managed Print Services market size reached USD 54.42 billion in 2026 and is forecast to advance to USD 83.26 billion by 2031, registering an 8.88% CAGR over 2026-2031. The headline expansion reflects the shift from capital-intensive device ownership toward subscription models that blend predictive analytics, zero-trust security, carbon accounting, and real-time fleet orchestration. Growth momentum stems from higher per-seat spending on compliance automation, anywhere-access printing, and usage-based provisioning rather than from rising page counts, which remain on a structural decline. Cloud-native architectures now dominate new installations because they let IT leaders extend secure print to hybrid workforces without on-premise servers, while analytics-driven uptime guarantees reduce unplanned outages. Competitive dynamics are changing as independent software vendors (ISVs) disaggregate OEM-centric value chains, and sustainability mandates create premium demand for page-level emissions tracking.
Key Report Takeaways
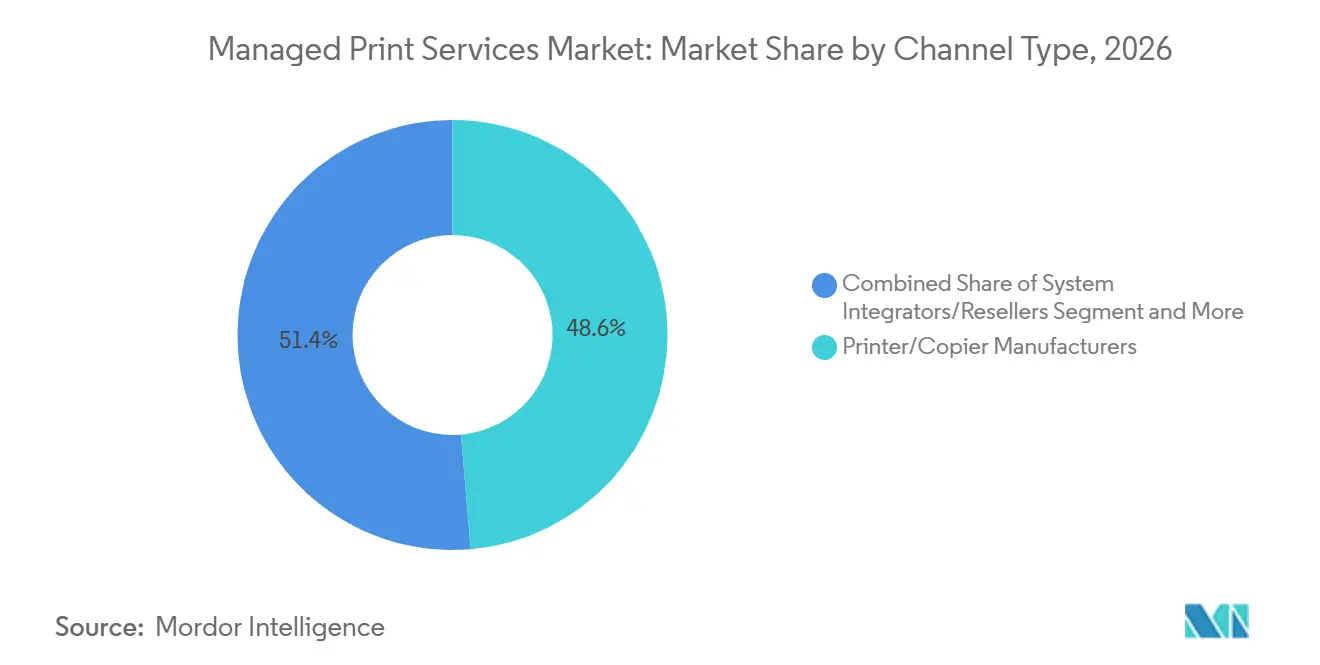
- By channel type, printer and copier manufacturers accounted for 48.64% of 2025 channel revenue, whereas independent software vendors are expanding at a 10.24% CAGR through 2031.
- By service type, managed print operations contributed 35.54% of 2025 service-type revenue, yet cloud print services post the fastest trajectory at a 9.22% CAGR to 2031.
- By deployment mode, cloud-based deployment models represented 64.78% of 2025 installations and are projected to grow at 10.56% annually through 2031.
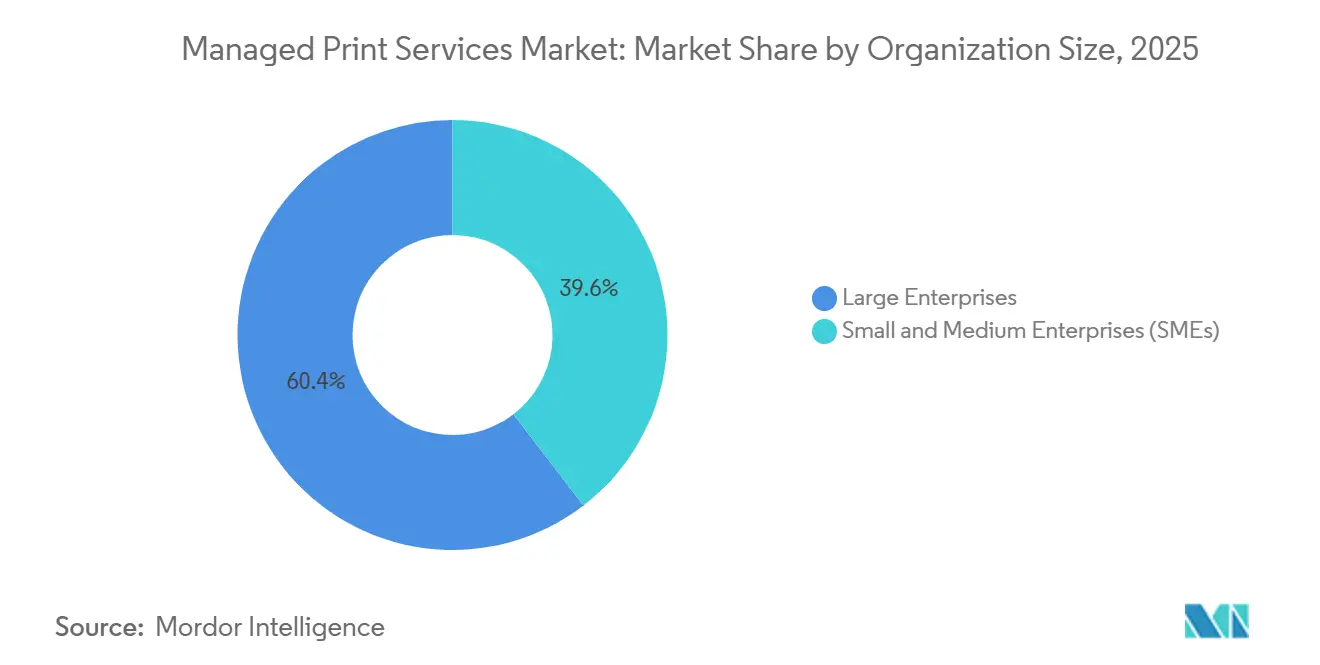
- By organization size, large enterprises captured 60.42% of 2025 spending, but small and medium enterprises are forecast to grow at a 9.56% CAGR over the outlook period.
- By vertical, healthcare generated 24.44% of 2025 vertical revenue, while education is advancing at a 9.02% CAGR to 2031.
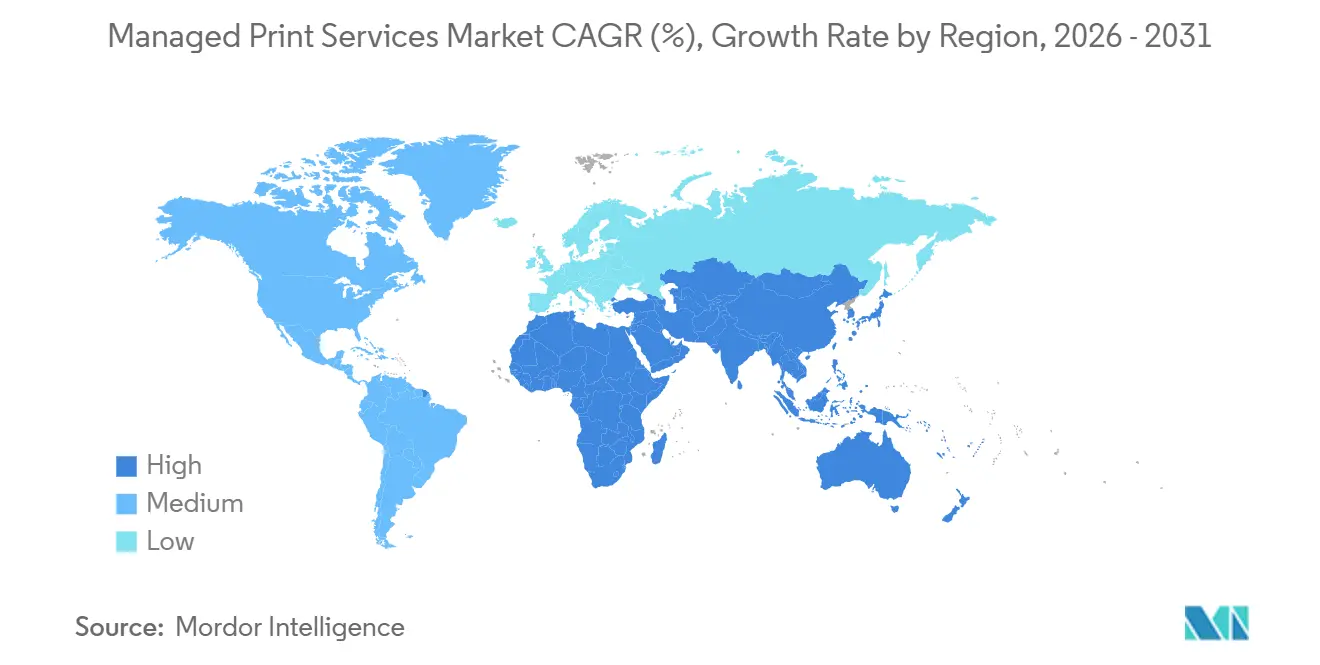
- By geography, North America held 40.78% of 2025 geographic revenue, whereas Asia Pacific is on track for a 10.48% CAGR through 2031.
Note: Market size and forecast figures in this report are generated using Mordor Intelligence’s proprietary estimation framework, updated with the latest available data and insights as of January 2026.
Global Managed Print Services Market Trends and Insights
Drivers Impact Analysis*
| Driver | (~) % Impact on CAGR Forecast | Geographic Relevance | Impact Timeline |
|---|---|---|---|
| Remote Work Print Infrastructure Optimisation Driving MPS Adoption in North America | +1.8% | North America, Europe | Medium term (2-4 years) |
| Sustainability and Carbon Footprint Mandates Accelerating EU Corporate MPS | +1.5% | Europe, Global spillover | Long term (≥ 4 years) |
| Subscription-Based Everything-as-a-Service Adoption Among SMEs | +1.6% | Global, with concentration in North America and Asia Pacific | Short term (≤ 2 years) |
| Print-Device Security and Compliance Requirements in Regulated Sectors | +1.4% | Global, especially North America and Europe | Medium term (2-4 years) |
| IoT-Enabled Fleet Analytics Reducing Downtime in Large Asian Enterprises | +1.2% | Asia Pacific core, spillover to Middle East and Africa | Medium term (2-4 years) |
| Generative-AI-Driven Predictive Maintenance and Auto-Replenishment | +1.0% | Global, early adoption in North America and Europe | Long term (≥ 4 years) |
| Source: Mordor Intelligence | |||
Remote Work Print Infrastructure Optimisation Driving MPS Adoption In North America
Hybrid work models fragmented device footprints across homes, co-working sites, and partially occupied headquarters, forcing IT departments to swap static fleets for usage-based provisioning. Secure print release, identity-aware access, and VPN-free job submission became baseline requirements, repositioning the Managed Print Services market as a security solution rather than a cost-center. Xerox’s Virtual Print Management service allows workers to send a job from any location and collect it at the nearest authenticated device, eliminating on-premise servers and bespoke VPN tunnels.[1]Source: Xerox Corporation, “Virtual Print Management,” xerox.com Enterprises now value zero-trust print architecture and on-demand capacity rightsizing, which explains why cloud-based contracts command premium seat fees while still outpacing the overall growth curve.
Sustainability And Carbon Footprint Mandates Accelerating EU Corporate MPS
The European Union’s Corporate Sustainability Reporting Directive compels companies with over 250 employees to disclose Scope 3 emissions, including those from printing, starting in 2025.[2]European Commission, “Corporate Sustainability Reporting Directive,” europa.eu Print fleet management therefore shifted into the compliance domain. Ricoh reported that 36% of its Office Services clients subscribed to carbon-accounting modules in 2025, a 10-point leap year-over-year, and expects sustainability-linked contracts to exceed 50% of new European bookings by 2027.[3]Ricoh Company, “Integrated Report 2025,” ricoh.com Procurement guidelines in Germany, France, and the Nordic region now prefer providers that supply page-level emissions data, effectively sidelining vendors lacking granular telemetry.
Subscription-Based Everything-As-A-Service Adoption Among SMEs
Small and medium enterprises lack dedicated IT staff, so they prioritize turnkey subscriptions that bundle hardware, software, security, and auto-replenishment. PaperCut’s Hive platform scales per active user and eliminates on-premise servers, expanding to 70,000 organizations by 2025 with SMEs as the fastest cohort.[4]PaperCut Software, “About PaperCut,” papercut.com For these firms, value resides less in per-page cost savings and more in outsourcing complexity. Vendors that offer frictionless onboarding, user-friendly interfaces, and month-to-month pricing are capturing disproportionate share of the Managed Print Services market.
Print-Device Security And Compliance Requirements In Regulated Sectors
Healthcare, finance, and government agencies face steep fines for data breaches involving printed documents. The U.S. Department of Health and Human Services recorded 133 HIPAA enforcement actions in 2025, some linked to unsecured printer hard drives. HP embeds biometric authentication, data-in-transit encryption, and automatic memory wiping into its Managed Print Services package, aligning with HIPAA, GDPR, and ISO 27001 mandates. Heightened regulatory scrutiny means secure-by-design fleets are now non-negotiable, positioning security as a growth catalyst across the Managed Print Services market.
Restraints Impact Analysis*
| Restraint | (~) % Impact on CAGR Forecast | Geographic Relevance | Impact Timeline |
|---|---|---|---|
| Declining Office Print Volumes Amid Digital Transformation | -1.2% | Global, most pronounced in North America and Europe | Long term (≥ 4 years) |
| Data Sovereignty Concerns Hindering Cloud-Based MPS | -0.8% | Asia Pacific, Middle East, selective European markets | Medium term (2-4 years) |
| Vendor Lock-In Perception and Contract Complexity Discouraging SMEs | -0.6% | Global, particularly acute in SME segment | Short term (≤ 2 years) |
| Complexity of Edge Zero-Trust Print Architectures | -0.5% | North America and Europe | Medium term (2-4 years) |
| Source: Mordor Intelligence | |||
Declining Office Print Volumes Amid Digital Transformation
Companies in mature economies cut office print usage by up to 20% between 2020 and 2025 as e-signatures, electronic invoicing, and cloud collaboration displaced paper workflows. Lower page counts erode per-click revenue models embedded in legacy contracts, forcing providers to pivot toward value-added modules such as workflow automation and compliance dashboards. Vendors that cling to volume-based billing risk margin compression even as the need for secure fleet oversight increases across the Managed Print Services market.
Data Sovereignty Concerns Hindering Cloud-Based MPS
National data-localization statutes in China, India, and parts of the Middle East require that print-job metadata stay within borders, limiting adoption of hyperscaler-hosted services. Global providers must either fund regional data centers or partner with domestic infrastructure firms, extending payback periods and complicating go-to-market plans. Until these sovereignty hurdles ease, a sizable share of Asia Pacific customers will retain on-premise or hybrid deployments, tempering growth in the region’s otherwise high-velocity Managed Print Services market.
*Our forecasts treat driver/restraint impacts as directional, not additive. The impact forecasts reflect baseline growth, mix effects, and variable interactions.
Segment Analysis
By Channel Type: ISVs Disrupt OEM Dominance
Independent software vendors erode incumbent share by selling cloud-first, vendor-agnostic platforms that manage fleets spanning HP, Canon, Xerox, Ricoh, and more. Printer and copier makers still generated the largest 2025 channel contribution, but the ISV cohort is outgrowing the total Managed Print Services market by more than one percentage point annually. The Xerox-Lexmark acquisition underscored OEM urgency to acquire software muscle, while Canon’s subscription-bundled imageFORCE suite tries to lock mid-market buyers into vertically integrated stacks. Still, large enterprises with heterogeneous fleets gravitate toward ISVs that reduce switching costs and accelerate feature rollouts. As a result, OEM service attach rates are slipping, and channel alliances between resellers and ISVs are proliferating to defend relevance.
ISVs differentiate through rapid cloud releases, open APIs, and analytics that benchmark utilization across mixed fleets, feeding continuous improvement loops. OEMs counter with device-embedded telemetry and hardware-software bundles, but price-to-value gaps remain. Enterprises recognize that renewal flexibility outweighs vendor homogeneity, pushing the Managed Print Services market toward a bifurcated structure. Vendor-agnostic orchestration appeals to global corporations that centralize governance, while integrated OEM suites still resonate with single-brand midsize operations seeking one-throat-to-choke accountability. Competitive intensity will deepen as hyperscaler marketplaces make independent print-management apps discoverable to IT buyers worldwide.


By Service Type: Cloud Print Services Outpace Traditional Operations
Cloud Print Services are expanding faster than the overall Managed Print Services market, bolstered by Microsoft Universal Print becoming the de facto enterprise standard. Managed Print Operations retain sizeable share because they encompass device monitoring and break-fix support, but cloud delivery models remove on-premise server costs and shrink deployment cycles from weeks to hours. Universal Print integration cuts driver management overhead for IT departments and unlocks secure printing for remote employees without VPN configurations.
Document workflow optimization, though the smallest current revenue pool, unlocks structural savings by automating capture, routing, and archiving. Konica Minolta’s AI-enabled Workplace Hub trims redundant prints and reduces processing time for HR and finance documents, illustrating the pivot from device management to process transformation. Providers that marry fleet analytics with workflow re-engineering can decouple earnings from declining page volumes and defend margins, a critical maneuver as print counts fall yet complexity rises across the Managed Print Services market size.
By Deployment Mode: Cloud-Based Models Dominate New Installations
Cloud-based deployments already constitute nearly two-thirds of active contracts and are outgrowing on-premise counterparts by two full percentage points annually. Elastic consumption converts fixed capital outlays into variable expenses, aligning spend with headcount fluctuations and remote-work patterns. SMEs embrace per-user pricing that sidesteps server acquisition and maintenance, while global enterprises value centralized policy enforcement and real-time analytics.
On-premise and hybrid models persist where data-localization or ultra-low-latency mandates apply, especially in banking and government. Even in those sectors, analytics dashboards and reporting layers commonly run in the cloud, creating mixed environments. Vendors that lack native multi-tenant architectures face upgrade headwinds, as customers reject lift-and-shift retrofits. Consequently, cloud-ready platforms increasingly win competitive tenders, reinforcing the Managed Print Services market share advantage of early movers.
By Organization Size: SMEs Accelerate Adoption Via Subscription Models
Large enterprises still drive absolute revenue because of massive, multisite fleets, but SMEs represent the fastest incremental dollar growth. Subscription bundles reduce procurement friction and sidestep multiyear commitments, so adoption accelerates even when per-page pricing exceeds self-managed alternatives. Brother’s compact MFC-L9670CDN, paired with optional cloud fleet management, embodies this SME-targeted value proposition.
Enterprise buyers focus on economies of scale, central governance, and global SLAs, while SMEs covet simplicity and predictable monthly bills. ISVs fine-tune onboarding wizards and self-service portals that require no training and deliver near-instant fleet visibility. As SME word of mouth spreads, the Managed Print Services market size for the segment is forecast to expand at a 9.56% CAGR, outpacing the corporate tier even as absolute dollars remain lower.
By End-User Vertical: Healthcare Leads, Education Accelerates
Healthcare’s strict HIPAA environment drives adoption of encrypted print workflows, secure release, and audit trails that track every page. HP, Xerox, and Ricoh market specialized offerings with built-in compliance dashboards, helping hospitals avoid regulatory penalties. Healthcare’s share leadership anchors the Managed Print Services market size in regulated sectors, while document-intensive workflows keep page volumes relatively resilient.
Education’s nine-percent CAGR stems from mobile student populations and tight budgets that favor cloud-hosted print servers. Universities deploy pull-print solutions so students release jobs at any campus device, trimming abandoned print waste. BFSI, government, manufacturing, and retail add steady demand but with distinct drivers: zero-trust security for banks, data localization for public agencies, IoT uptime guarantees for factories, and cost control for retailers. Providers tailoring vertical modules enjoy higher renewal rates and cross-sell margins across the Managed Print Services market.
Geography Analysis
North America generated the largest 2025 revenue thanks to early hybrid-work adoption and stringent cybersecurity mandates. Enterprises value zero-trust prints and advanced analytics, lifting average revenue per user above the global mean. Canada mirrors U.S. patterns, while Mexican corporations modernize fleets as part of near-shoring manufacturing expansions.
Asia Pacific, however, is the fastest-growing region with a 10.48% CAGR. Chinese, Indian, Japanese, and South Korean manufacturers integrate IoT telemetry to minimize downtime, directly linking printer availability to production throughput. Local data-sovereignty laws slow pure cloud adoption but boost hybrid deployments supported by regionally hosted analytics. Government digitization agendas in India and smart-factory incentives in China further elevate demand, solidifying the region’s outsized contribution to Managed Print Services market growth.
Europe’s trajectory hinges on carbon-accounting regulations. German, French, and Nordic enterprises embed lifecycle emissions tracking into vendor scorecards, rapidly expanding contracts that include sustainability dashboards. The Middle East and South America log steady, mid-single-digit expansion as digital government programs and corporate modernization projects unfold. Africa remains nascent yet opportunity-rich for vendors willing to offer low-capex subscription bundles that accommodate infrastructure variability. Collectively, these dynamics diversify revenue sources and hedge currency exposure for global providers in the Managed Print Services market.

Competitive Landscape
Competition remains moderate, with the top five OEMs capturing roughly 55-60% of 2025 revenue, yet share is slipping as ISVs and system integrators offer vendor-agnostic cloud platforms. Xerox’s USD 1.5 billion Lexmark acquisition added the Optra Edge software stack, highlighting the strategic pivot toward platform capabilities over hardware scale. HP, Canon, Ricoh, and Konica Minolta respond by bundling analytics, security, and workflow add-ons to defend accounts.
ISVs such as PaperCut, PrintFleet, and Vasion innovate at cloud cadence, releasing quarterly features that span mixed fleets and integrate with Microsoft 365 ecosystems. Their open APIs let enterprises consolidate governance and analytics across multibrand environments, shrinking OEM lock-in. Partnerships between resellers and ISVs flourish, delivering turnkey solutions and heightening service differentiation within the Managed Print Services market.
Technology moats now rely on generative AI, fleet-wide IoT telemetry, and carbon-accounting engines. Xerox’s Intelligent Document Processing predicts component failures 30 days ahead, cutting customer downtime and inventory costs. Ricoh’s data-driven maintenance reduced Asia Pacific fleet outages by 18%, proving operational ROI. As software value eclipses hardware specs, market leaders accelerate R&D budgets for cloud platforms, while late adopters risk relegation to commodity device suppliers.
Managed Print Services Industry Leaders
Xerox Corporation
Ricoh Company Ltd.
HP Inc.
Brother Industries, Ltd.
Canon Inc.
- *Disclaimer: Major Players sorted in no particular order

Recent Industry Developments
- August 2025: Xerox launched an AI-powered Intelligent Document Processing solution that predicts failures 30 days in advance and integrates into its MPS suite.
- July 2025: Xerox partnered with Kyocera Document Solutions to embed inkjet technology into Xerox’s managed print portfolio.
- June 2025: Brother debuted the MFC-L9670CDN multifunction printer aimed at SMEs with optional cloud fleet management.
- May 2025: Epson expanded the WorkForce Enterprise inkjet line featuring heat-free technology for lower energy consumption.


Research Methodology Framework and Report Scope
Market Definitions and Key Coverage
Our study defines the managed print services (MPS) market as the total annual value of outsourced contracts through which a third-party provider monitors, optimizes, and maintains an enterprise's networked printers, copiers, scanners, and related software while bundling consumables, maintenance, remote analytics, and security features into a single fee. According to Mordor Intelligence, the market reached USD 49.8 billion in 2025 and is tracked across channel type, deployment mode, organization size, vertical, and all major regions.
Scope Exclusion: Stand-alone hardware sales to home consumers without an accompanying service contract are excluded.
Segmentation Overview
- By Channel Type
- Printer/Copier Manufacturers
- System Integrators/Resellers
- Independent Software Vendors (ISVs)
- By Service Type
- Print Infrastructure Assessment
- Managed Print Operations
- Device and Fleet Management
- Document Workflow Optimisation
- Cloud Print Services
- By Deployment Mode
- On-Premise
- Cloud-Based
- By Organisation Size
- Small and Medium Enterprises (SMEs)
- Large Enterprises
- By End-User Vertical
- BFSI
- Healthcare
- IT and Telecom
- Government
- Education
- Other End-User Verticals
- By Geography
- North America
- United States
- Canada
- Mexico
- South America
- Brazil
- Argentina
- Rest of South America
- Europe
- Germany
- United Kingdom
- France
- Nordics
- Rest of Europe
- Asia Pacific
- China
- Japan
- India
- South Korea
- Rest of Asia Pacific
- Middle East
- GCC (Saudi Arabia, United Arab Emirates, Qatar)
- Turkey
- Rest of Middle East
- Africa
- South Africa
- Nigeria
- Rest of Africa
- North America
Detailed Research Methodology and Data Validation
Primary Research
To refine assumptions, our team completed interviews and surveys with OEM service heads, independent software vendors, system-integrator account managers, and large-account procurement leads across North America, Europe, and Asia Pacific. These conversations clarified real-world fleet refresh cycles, cloud-based contract uptake, and emerging security requirements, helping us calibrate adoption rates and price erosion inputs.
Desk Research
Mordor analysts began with structured desk research, reviewing freely accessible tier-1 sources such as the US International Trade Commission trade data, Eurostat's ICT usage reports, the International Telecommunication Union's digital adoption statistics, and UN Comtrade shipment codes that isolate multifunction peripherals. White papers from trade bodies (e.g., the Imaging Supplies Coalition) and public company 10-Ks added context on fleet sizes, page volumes, and cost-per-page trends. Select proprietary datasets, including D&B Hoovers for vendor revenue splits and Dow Jones Factiva for contract announcements, provided further granularity. The sources cited above are illustrative; many additional publications were consulted to validate figures and close information gaps.
Market-Sizing & Forecasting
A top-down model rebuilt global enterprise print spend from IT budget line items, employee headcount, and average monthly page volumes; results were cross-checked through a bottom-up roll-up of the disclosed MPS revenues of leading suppliers and channel partners. Key variables feeding the model include installed printer base, MPS penetration by organization size, average cost per printed page, remote-worker share of the labor force, and regional GDP-adjusted IT spending. Forecasts to 2030 employ multivariate regression that links those drivers with historical MPS growth, while scenario analysis tests alternative digitization speeds. Gaps in bottom-up data (for private vendors or bundled contracts) were bridged using median margins and ASPs verified in primary calls.
Data Validation & Update Cycle
We triangulate model outputs against independent shipment, consumables, and cloud-migration indicators before peer review. Any variances beyond predefined thresholds trigger re-contact of experts. Reports refresh annually; material market events prompt interim updates, and every release undergoes a final analyst check to ensure clients receive the freshest view.
Why Mordor's Managed Print Services Baseline Commands Reliability
Published estimates often diverge because firms differ on contract inclusions, baseline years, and refresh cadences.
Our disciplined scope selection, dual-approach modeling, and yearly update cycle anchor a dependable baseline for decision makers.
Benchmark comparison
| Market Size | Anonymized source | Primary gap driver |
|---|---|---|
| USD 49.8 bn (2025) | Mordor Intelligence | - |
| USD 50.2 bn (2024) | Global Consultancy A | Includes hardware sales tied to break-fix contracts, inflating size |
| USD 44.9 bn (2024) | Industry Association B | Excludes device management and SME contracts, underreporting demand |
| USD 41.3 bn (2023) | Regional Consultancy A | Uses earlier baseline and conservative penetration assumptions |
The comparison shows that numbers swing when scope, base year, or validation steps shift.
Mordor's balanced mix of public data, direct market feedback, and iterative checks yields a transparent, reproducible figure clients can trust.


Key Questions Answered in the Report
How big is the Managed Print Services market in 2026 and what growth rate is expected?
The Managed Print Services market size reached USD 54.42 billion in 2026 and is projected to grow at an 8.88% CAGR to USD 83.26 billion by 2031.
Which service category is growing the fastest?
Cloud Print Services post the highest expansion at a 9.22% CAGR because cloud platforms remove on-premise servers and enable secure hybrid-work printing.
Why are SMEs adopting managed print services rapidly?
Subscription pricing converts capex to opex, while cloud portals provide enterprise-grade security and automated supplies without internal IT overhead.
Why are independent software vendors gaining share against printer OEMs?
ISVs deliver vendor-agnostic, cloud-native platforms that manage mixed fleets and integrate quickly with Microsoft 365, reducing switching costs for enterprises.
What role does sustainability play in Managed Print Services adoption?
EU carbon-reporting regulations require page-level emissions data, so enterprises subscribe to MPS modules that automate tracking and help meet disclosure mandates.
Which region offers the highest growth opportunity?
Asia Pacific leads with a 10.48% CAGR, driven by manufacturing digitization, IoT-enabled fleet analytics, and government modernization programs.
How are SMEs benefiting from Managed Print Services?
Subscription bundles eliminate capital expenditure, offload IT complexity, and allow per-user scaling, making MPS attractive even when per-page costs are higher than self-management.
Page last updated on:


