Enterprise Network Equipment Market Size and Share
Market Overview
| Study Period | 2020 - 2031 |
|---|---|
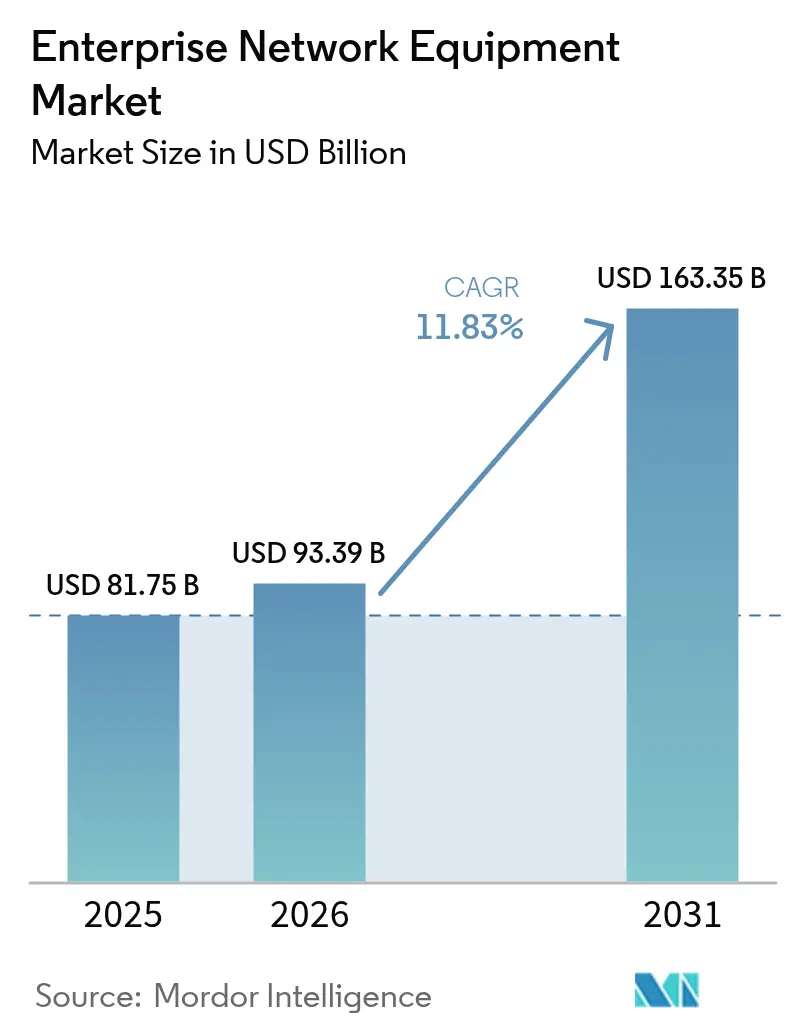
| Market Size (2026) | USD 93.39 Billion |
| Market Size (2031) | USD 163.35 Billion |
| Growth Rate (2026 - 2031) | 11.83% CAGR |
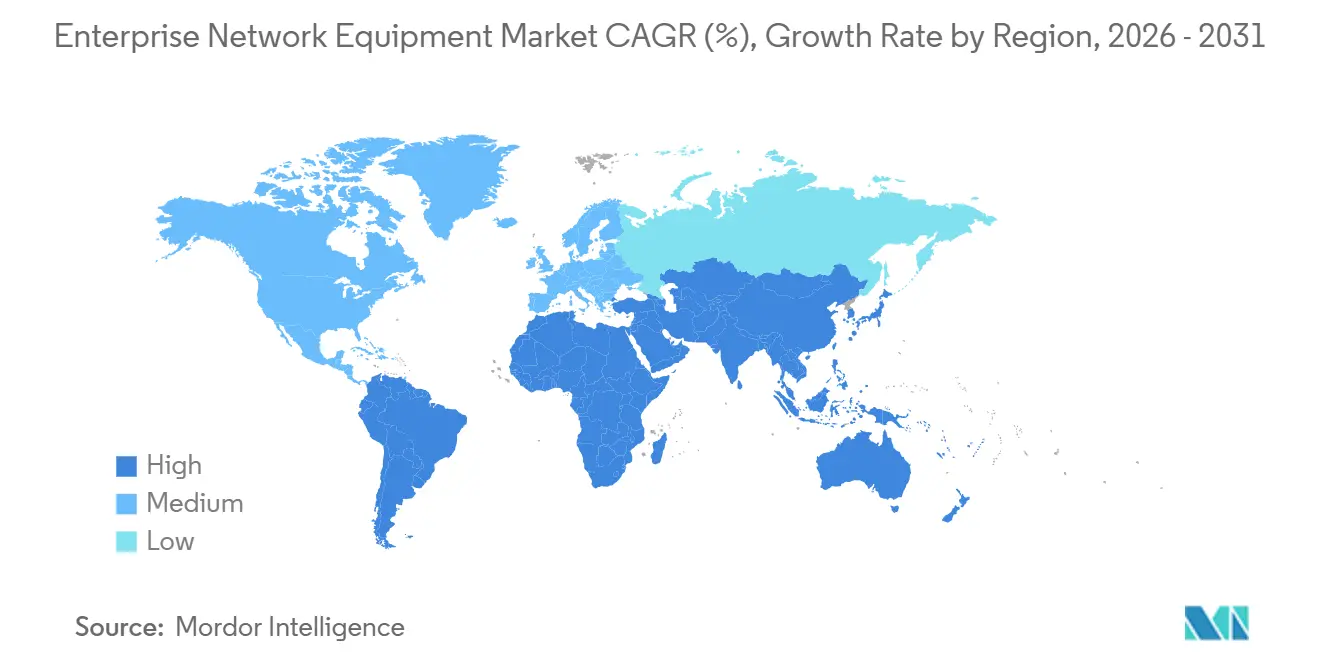
| Fastest Growing Market | Asia Pacific |
| Largest Market | North America |
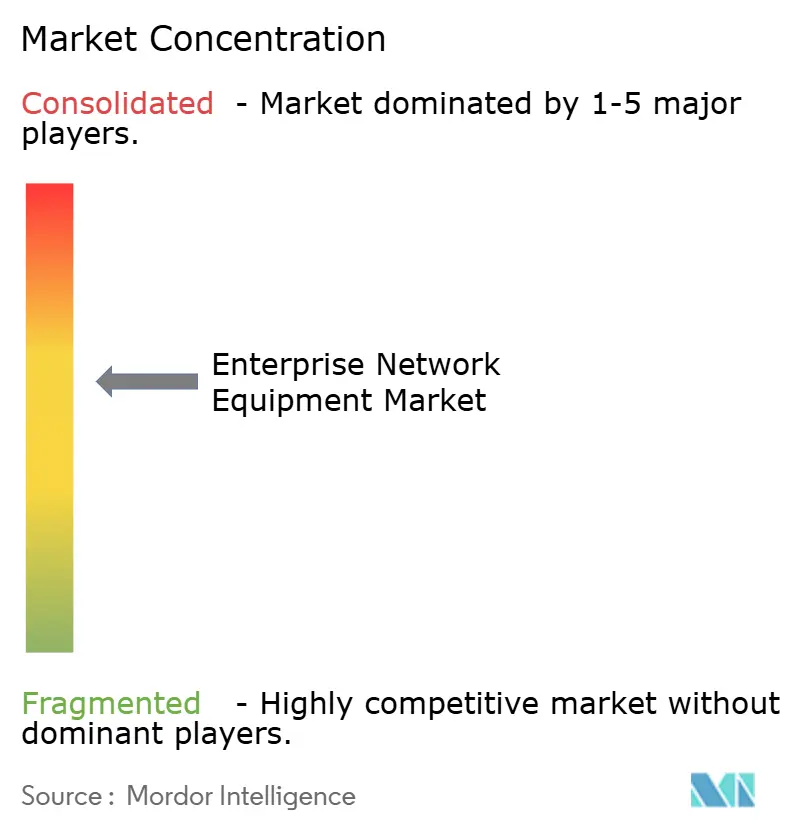
| Market Concentration | Medium |
Major Players *Disclaimer: Major Players sorted in no particular order Image © Mordor Intelligence. Reuse requires attribution under CC BY 4.0. | |
Enterprise Network Equipment Market Analysis by Mordor Intelligence
The Enterprise network equipment market size is projected to be USD 81.75 billion in 2025, USD 93.39 billion in 2026, and reach USD 163.35 billion by 2031, growing at a CAGR of 11.83% from 2026 to 2031. Enterprises are accelerating refresh cycles to absorb rising IoT telemetry, embed AI-native orchestration, and satisfy Scope-3 emissions reporting. Switches retained dominance in 2025 but security appliances are advancing more quickly as zero-trust frameworks replace perimeter defense. Cloud-managed architectures still lead, yet hybrid models are expanding because on-premises latency needs must coexist with cloud-based policy engines. Semiconductor shortages linger, pushing buyers toward multi-vendor sourcing and open-source network operating systems that blunt traditional vendor lock-in.
Key Report Takeaways
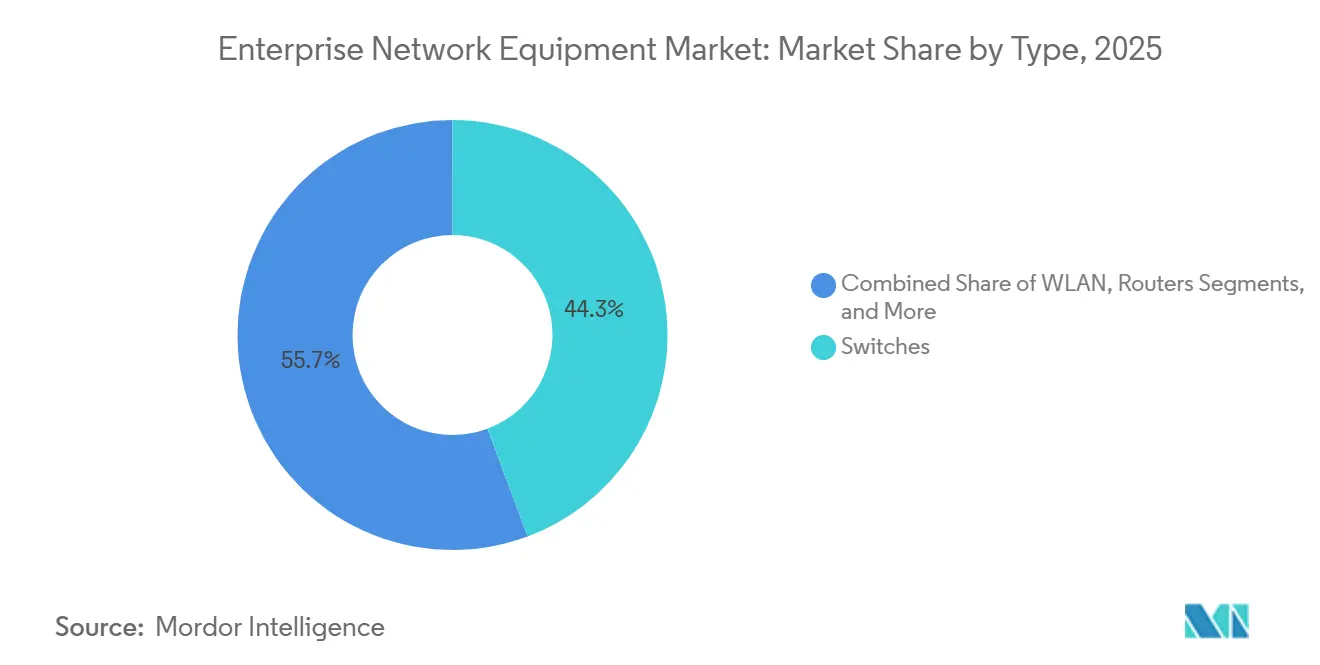
- By type, switches captured 44.31% of Enterprise network equipment market share in 2025, while security appliances are forecast to pace the segment with a 12.02% CAGR to 2031.
- By deployment model, cloud-managed solutions held a 51.12% revenue share in 2025, but hybrid deployments are projected to accelerate at a 12.89% CAGR through 2031.
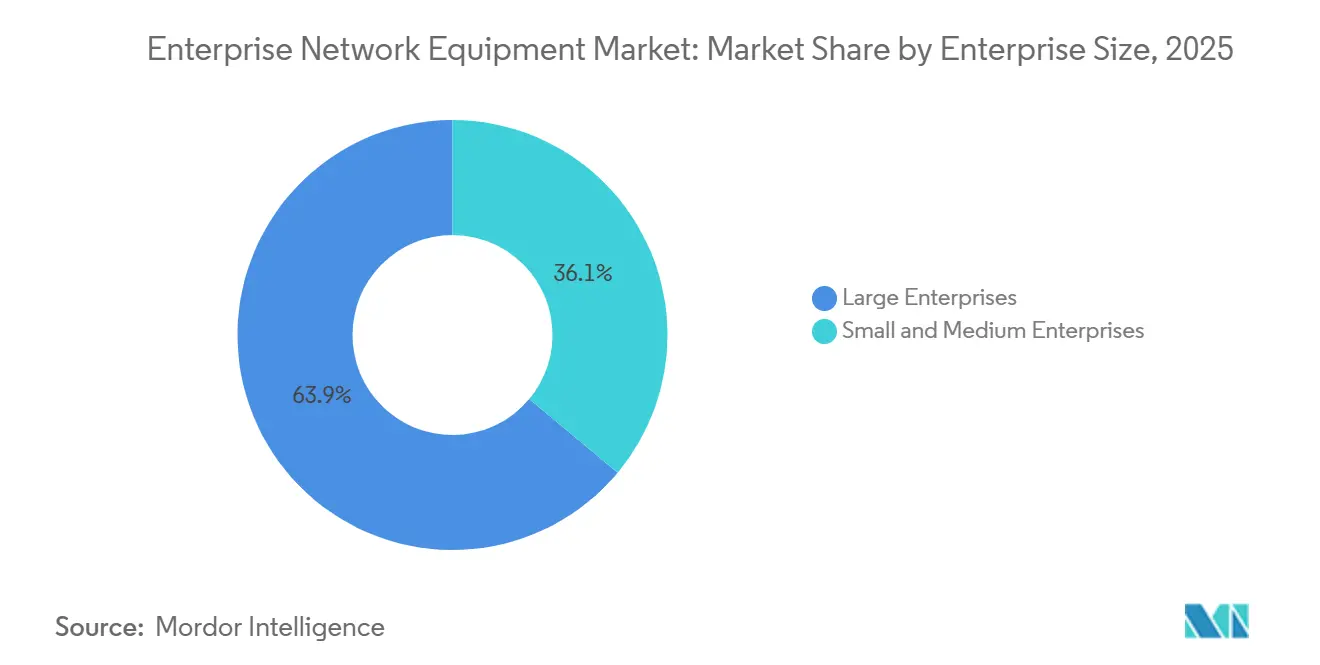
- By enterprise size, large companies represented 63.94% spending in 2025; small and medium enterprises are tracking an 11.98% CAGR as subscription SD-WAN and pay-as-you-go cloud management remove up-front costs.
- By end-user vertical, IT and telecom led at 28.87% share in 2025, whereas healthcare is projected to expand at a 13.67% CAGR on growing telemedicine and IoMT traffic.
- By geography, North America commanded 38.69% revenue in 2025, yet Asia–Pacific is forecast to grow at 13.23% CAGR on data-center buildouts and state-backed digital programs.
Note: Market size and forecast figures in this report are generated using Mordor Intelligence’s proprietary estimation framework, updated with the latest available data and insights as of 2026.
Global Enterprise Network Equipment Market Trends and Insights
Drivers Impact Analysis*
| Driver | (~) % Impact on CAGR Forecast | Geographic Relevance | Impact Timeline |
|---|---|---|---|
| Surging bandwidth demand from IoT and edge computing | +2.1% | Global, with APAC and North America leading edge deployments | Medium term (2-4 years) |
| Cloud-managed networking and SD-WAN adoption | +2.4% | Global, with North America and Europe early adopters | Short term (≤ 2 years) |
| Rapid enterprise upgrades to Wi-Fi 7 campus LANs | +1.8% | North America and Europe core, APAC following | Short term (≤ 2 years) |
| Enterprise shift to open-source NOS and disaggregated switches | +1.5% | Global, with North America and Europe leading adoption | Medium term (2-4 years) |
| Scope-3 emission accounting pushing PoE++ energy optimisation | +1.3% | Europe and North America, with regulatory spillover to APAC | Long term (≥ 4 years) |
| AI-native network digital twins accelerating refresh budgets | +1.9% | Global, with early adoption in North America and APAC | Medium term (2-4 years) |
| Source: Mordor Intelligence | |||
Surging Bandwidth Demand From IoT and Edge Computing
IoT proliferation is forcing upgrades to campus switches and access points so that telemetry packets do not congest legacy links.[1]Cisco Systems, “Cisco Catalyst 9000 Series Switches,” CISCO.COM Edge computing reduces backhaul latency but increases the port-density and PoE budget required at aggregation layers. Georgetown University’s 2025 deployment of Catalyst 9000 switches delivered 30 Gbps throughput for sensor analytics, illustrating how research campuses shape early demand. Manufacturing plants are rolling out Time-Sensitive Networking (TSN) switches to blend operational tech and IT, guaranteeing deterministic latency for industrial robots.[2]IEEE Standards Association, “IEEE 802.11be Wi-Fi 7 Standard,” IEEE.ORG Retailers are standardizing on managed PoE switches that support inventory sensors and in-store video analytics.
Cloud-Managed Networking and SD-WAN Adoption
Removing on-premises controllers lowers capital budgets and centralizes policy across distributed branches. Aruba updated its Central platform in 2025 with AI that predicts failures and automates remediation. Financial firms now steer trading traffic over broadband while reserving MPLS for settlement, maintaining sub-10 ms latency without overspending. Hybrid patterns are rising because enterprises keep local controllers for voice and OT workloads yet move analytics to the cloud, a key factor behind the 12.89% CAGR for hybrid deployments.
Rapid Enterprise Upgrades to Wi-Fi 7 Campus LANs
Wi-Fi 7 introduces 320 MHz channels and multi-link operation, delivering headline 30 Gbps rates that support VR training, 4K streaming, and bulk telemetry transfer. Georgetown’s 2025 rollout of Wi-Fi 7 access points spans 104 buildings and leverages Meraki cloud controls for real-time QoS. European universities in Hungary and Spain mirrored these upgrades, demonstrating cross-regional momentum. Healthcare campuses rely on the 6 GHz spectrum to connect telemedicine carts and wireless monitoring devices, though industrial zones with limited 6 GHz rights must deploy hybrid Wi-Fi 6E/7 topologies.
Enterprise Shift to Open-Source NOS and Disaggregated Switches
Open-source software like SONiC and OcNOS decouples network features from hardware, allowing buyers to mix merchant-silicon white-box switches without losing functionality. Dell PowerSwitch models ship with SONiC images and RESTful APIs that integrate with any orchestration layer. Broadcom’s Tomahawk 5 ASIC sits inside multiple ODM chassis, further commoditizing hardware. Financial institutions are adopting these designs to shorten feature rollouts, and Cisco added optional SONiC images on select Nexus lines in 2025.
Restraints Impact Analysis*
| Restraint | (~) % Impact on CAGR Forecast | Geographic Relevance | Impact Timeline |
|---|---|---|---|
| High maintenance and compliance-driven security costs | -1.6% | Global, with Europe and North America facing stricter regulations | Short term (≤ 2 years) |
| Persistent semiconductor supply-chain fragility | -1.4% | Global, with APAC manufacturing hubs most exposed | Medium term (2-4 years) |
| 6 GHz spectrum availability limits in industrial campuses | -0.9% | Europe and APAC, with North America less constrained | Short term (≤ 2 years) |
| OEM-neutral orchestration eroding vendor lock-in margins | -1.2% | Global, with North America and Europe leading adoption | Medium term (2-4 years) |
| Source: Mordor Intelligence | |||
High Maintenance and Compliance-Driven Security Costs
Zero-trust demands micro-segmentation, always-on encryption, and granular identity checks, multiplying appliance counts and license fees. GDPR, HIPAA, and PCI-DSS further require continuous audit logging and vulnerability scanning, prompting switch and router replacements that embed secure boot and hardware trust anchors. A single FortiGate appliance with sandboxing can exceed USD 50,000 in annual subscriptions, and healthcare campuses must add NAC platforms to isolate IoMT devices.
Persistent Semiconductor Supply-Chain Fragility
Custom switch ASICs still face lead times north of 12 months despite TSMC’s capacity expansions in Arizona and Japan.[3]TSMC, “Advanced Semiconductor Manufacturing,” TSMC.COM Cisco’s 5 nm Silicon One chips combine routing and switching on a single die but scale-up has been gated by wafer allocations since 2024. Enterprises hedge by qualifying multiple vendors and leaning on SONiC so that software images remain portable across alternate silicon.
*Our forecasts treat driver/restraint impacts as directional, not additive. The impact forecasts reflect baseline growth, mix effects, and variable interactions.
Segment Analysis
By Type: Security Appliances Outpace Switch Growth
Network security appliances are forecast to grow at 12.02% CAGR through 2031 even though switches owned 44.31% Enterprise network equipment market share in 2025. The divergence reflects the pivot to zero-trust, requiring next-generation firewalls, intrusion prevention, and SASE gateways for granular access. Switches remain essential for campus LAN and data-center fabrics, with Cisco Catalyst 9000 and Nexus 9000 lines anchoring refresh budgets.
Routers are expanding more slowly because SD-WAN tunnels sit atop broadband and LTE, reducing the count of dedicated branch routers, although core routers still anchor service-provider edges. WLAN gear is buoyed by Wi-Fi 7 upgrades, and Fortinet’s converged firewall-SD-WAN appliances fold routing and security to lower device sprawl. Arista’s 7060X6 switch brings 800 GbE to AI clusters, underscoring how high-end port speeds stay relevant even as security devices grab faster growth.


By Deployment Model: Hybrid Architectures Balance Latency and Flexibility
Hybrid installations are projected to expand at a 12.89% CAGR, overtaking purely cloud-managed growth even though the latter held 51.12% share in 2025. Enterprises retain on-premises controllers for thin-latency apps such as voice, SCADA, and VR, yet shift policy engines and analytics into SaaS consoles. Aruba Central synchronizes rules between local and remote control planes, ensuring continuity when WAN links fail.
SMEs prefer fully cloud-managed systems that convert CapEx into subscription OpEx. Government and defense remain committed to on-premises due to classified traffic segregation. Cisco Meraki now offers hybrid mode that caches configs locally, addressing objections about WAN dependence, while Juniper Mist Edge lets enterprises preserve autonomy during internet outages.
By Enterprise Size: SME Growth Fueled by Accessible SD-WAN
Large enterprises generated 63.94% of 2025 spending on the Enterprise network equipment market. Yet SMEs are catching up with an 11.98% CAGR, armed with cloud-managed switches from Ubiquiti that cost under USD 500 and ship without license fees. TP-Link’s Omada platform delivers controllerless SDN with pay-as-you-grow access points, trimming ownership burdens.
Large corporations are installing AI-native assurance to cut mean-time-to-resolution, while investing in 400 GbE and 800 GbE fabric upgrades for AI training clusters. SMEs instead prioritize SD-WAN that slashes WAN costs by up to 60%, routing over standard broadband without MPLS fees.
By End-User Vertical: Healthcare Leads Growth Amid Telemedicine Surge
Healthcare is projected to post a 13.67% CAGR through 2031, the fastest among verticals, as bandwidth-hungry telemedicine and continuous patient monitoring stress older LANs. IT and telecom retained a 28.87% slice of 2025 revenue because carriers are simultaneously buyers and sellers of network gear.
Banks adopt micro-segmentation to ring-fence trading engines and customer records. Manufacturing plants converge OT and IT on TSN switches to synchronize robots with millisecond precision. Government agencies modernize LANs for citizen portals under rules favoring domestic suppliers in certain regions.
Geography Analysis
North America maintained 38.69% share in 2025 on the back of Fortune 500 campus refreshes, federal modernization, and hyperscale data-center expansions. Georgetown University’s Wi-Fi 7 deployment exemplifies the region’s early adoption curve. U.S. corporations are embracing zero-trust using PA-7500 firewalls that inspect 1 Tbps of encrypted traffic. Canada is bolstering 5 G backhaul with Juniper edge routers, while Mexico outfits TSN switches to accommodate near-shoring assembly lines.
Asia–Pacific is poised for the fastest trajectory at 13.23% CAGR as China ramps 800 GbE data-center fabrics for AI inference and India’s Production-Linked Incentive scheme stimulates domestic switch output. Japan’s smart-city pilots in Tokyo and Osaka blend IoT sensors with autonomous shuttles, intensifying demand for edge aggregation switches. South Korea densifies 5 G macro cells, while Australia deploys SD-WAN to mines and farms where fiber is scarce.
Europe’s stringent data-sovereignty laws push agencies toward on-premises security appliances, with German factories integrating Industrial Ethernet switches for Industry 4.0. The United Kingdom finances ultra-low-latency upgrades for trading venues using Arista’s sub-microsecond switches. France favors European-headquartered suppliers such as Nokia for public-sector rollouts. South America, the Middle East, and Africa each post single-digit slices today yet display healthy demand in smart-city and e-government projects.

Competitive Landscape
The Enterprise network equipment market demonstrates moderate concentration. Cisco, Huawei, and Hewlett Packard Enterprise collectively hold a notable portion, but their combined grip is being chipped away by open-source NOS adoption and sub-USD 500 white-box alternatives. Cisco’s 2025 release of Silicon One G200 ASIC continued its vertical-integration defense. Arista leverages 800 GbE hardware and CloudVision automation to court AI cluster builders. Juniper’s Mist AI raises the bar on automated troubleshooting after its minority stake in Pluribus accelerated SONiC options.
Emerging disruptors such as Ubiquiti and TP-Link target SMEs with license-free cloud controls. Dell and Edgecore sell SONiC-ready switches that let buyers mix hardware without rewriting operational playbooks. Differentiation is drifting toward AI-powered digital twins; Nokia’s Network Digital Twin simulates capacity squeezes before rollout, while Cisco Modeling Labs mirrors production topologies for what-if testing.
Hyperscale cloud builders design custom silicon and may fully bypass legacy vendors, compelling incumbents to pair software innovation with hardware road-maps. The pending Juniper-HPE combination, announced in 2024, hints at further consolidation designed to aggregate R&D scale and fend off ODM competition.
Enterprise Network Equipment Industry Leaders
Cisco Systems Inc.
Huawei Technologies Co. Ltd.
Hewlett Packard Enterprise Company
Aruba Networks LLC
Juniper Networks Inc.
- *Disclaimer: Major Players sorted in no particular order

Recent Industry Developments
- February 2026: Cisco unveiled the Silicon One G200 ASIC, a 25.6 Tbps chip for AI fabrics that bundles deep buffers and congestion controls.
- January 2026: Arista launched the 7700R4 modular router delivering 115.2 Tbps throughput with 800 GbE ports for edge aggregation.
- December 2025: Fortinet partnered with Microsoft Azure to embed FortiGate NGFW in Azure Virtual WAN for unified policy governance.
- November 2025: Huawei released CloudEngine 16800 switches offering 768 × 400 GbE ports and lossless Ethernet for AI training.


Global Enterprise Network Equipment Market Report Scope
Enterprise networking is traditionally centered on LAN standards with hardware switches, router devices, ethernet cabling, WIFI connections, and integrated firewall software all commonly used to create a Local Area Network.
The Enterprise Network Equipment Market Report is Segmented by Type (Switches, Routers, WLAN, Network Security Appliances, Access Points and Controllers), Deployment Model (On-Premises, Cloud-Managed, Hybrid), Enterprise Size (Small and Medium Enterprises, Large Enterprises), End-User Vertical (IT and Telecom, BFSI, Healthcare, Manufacturing, Government, Retail and E-commerce, Other Verticals), and Geography (North America, South America, Europe, Asia-Pacific, Middle East, Africa). The Market Forecasts are Provided in Terms of Value (USD).
| Switches |
| Routers |
| WLAN |
| Network Security Appliances |
| Access Points and Controllers |
| On-Premises |
| Cloud-Managed |
| Hybrid |
| Small and Medium Enterprises |
| Large Enterprises |
| IT and Telecom |
| BFSI |
| Healthcare |
| Manufacturing |
| Government |
| Retail and E-commerce |
| Other Verticals |
| North America | United States |
| Canada | |
| Mexico | |
| South America | Brazil |
| Argentina | |
| Rest of South America | |
| Europe | Germany |
| United Kingdom | |
| France | |
| Italy | |
| Spain | |
| Rest of Europe | |
| Asia-Pacific | China |
| India | |
| Japan | |
| South Korea | |
| Australia and New Zealand | |
| Rest of Asia-Pacific | |
| Middle East | Saudi Arabia |
| United Arab Emirates | |
| Turkey | |
| Rest of Middle East | |
| Africa | South Africa |
| Nigeria | |
| Egypt | |
| Rest of Africa |
| By Type | Switches | |
| Routers | ||
| WLAN | ||
| Network Security Appliances | ||
| Access Points and Controllers | ||
| By Deployment Model | On-Premises | |
| Cloud-Managed | ||
| Hybrid | ||
| By Enterprise Size | Small and Medium Enterprises | |
| Large Enterprises | ||
| By End-User Vertical | IT and Telecom | |
| BFSI | ||
| Healthcare | ||
| Manufacturing | ||
| Government | ||
| Retail and E-commerce | ||
| Other Verticals | ||
| By Geography | North America | United States |
| Canada | ||
| Mexico | ||
| South America | Brazil | |
| Argentina | ||
| Rest of South America | ||
| Europe | Germany | |
| United Kingdom | ||
| France | ||
| Italy | ||
| Spain | ||
| Rest of Europe | ||
| Asia-Pacific | China | |
| India | ||
| Japan | ||
| South Korea | ||
| Australia and New Zealand | ||
| Rest of Asia-Pacific | ||
| Middle East | Saudi Arabia | |
| United Arab Emirates | ||
| Turkey | ||
| Rest of Middle East | ||
| Africa | South Africa | |
| Nigeria | ||
| Egypt | ||
| Rest of Africa | ||


Key Questions Answered in the Report
How large will the Enterprise network equipment market be by 2031?
It is forecast to reach USD 163.35 billion by 2031, expanding at an 11.83% CAGR from 2026 to 2031.
Which equipment type is growing fastest within Enterprise networking?
Network security appliances are projected to post a 12.02% CAGR to 2031 as firms adopt zero-trust and SASE frameworks.
Why are hybrid deployments gaining momentum?
Hybrid architectures blend on-premises controllers for latency-sensitive traffic with cloud policy engines, supporting a 12.89% CAGR forecast.
What drives the sharp growth in healthcare spending on Enterprise gear?
Telemedicine, IoMT expansion, and EHR migrations are lifting healthcare demand, resulting in a 13.67% CAGR through 2031.
Which region will record the quickest growth pace?
Asia–Pacific is expected to rise at a 13.23% CAGR, propelled by data-center buildouts in China and India’s digital programs.
How are open-source NOS platforms affecting vendor strategies?
SONiC and other options let buyers mix white-box switches, pressuring incumbents to differentiate with AI-native software rather than proprietary hardware.
Page last updated on:


