
Market Overview
| Study Period | 2020 - 2031 |
|---|---|
| Forecast Data Period | 2026 - 2031 |
| Base Year Market Size (2025) | USD 49.99 Billion |
| Market Size (2026) | USD 54.83 Billion |
| Market Size (2031) | USD 86.98 Billion |
| Growth Rate (2026 - 2031) | 9.68 % |
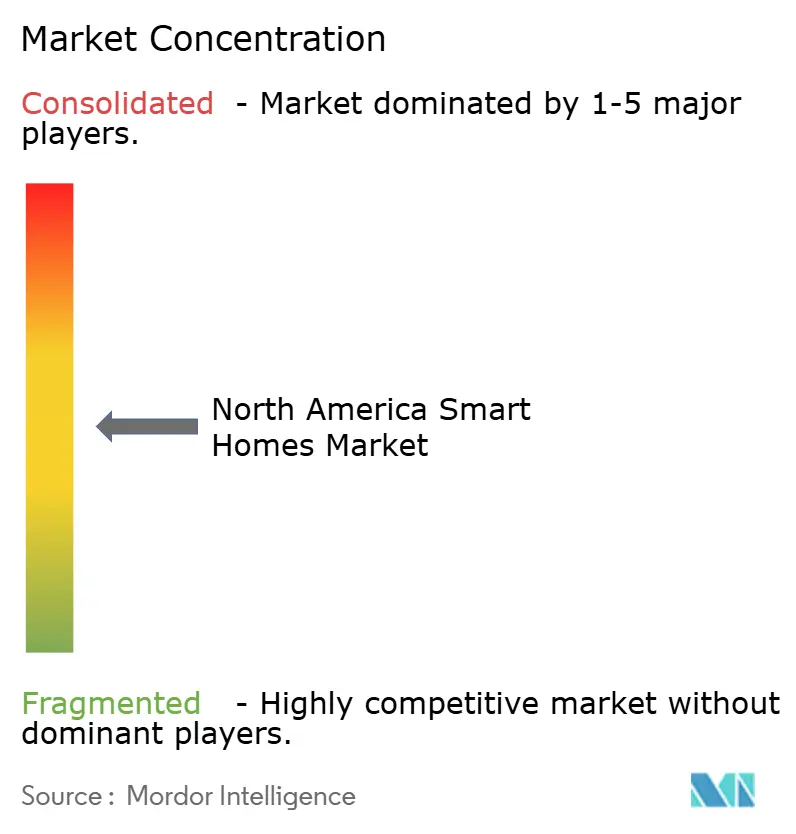
| Market Concentration | Medium |
Major Players *Disclaimer: Major Players sorted in no particular order Image © Mordor Intelligence. Reuse requires attribution under CC BY 4.0. | |
North America Smart Homes Market Analysis by Mordor Intelligence
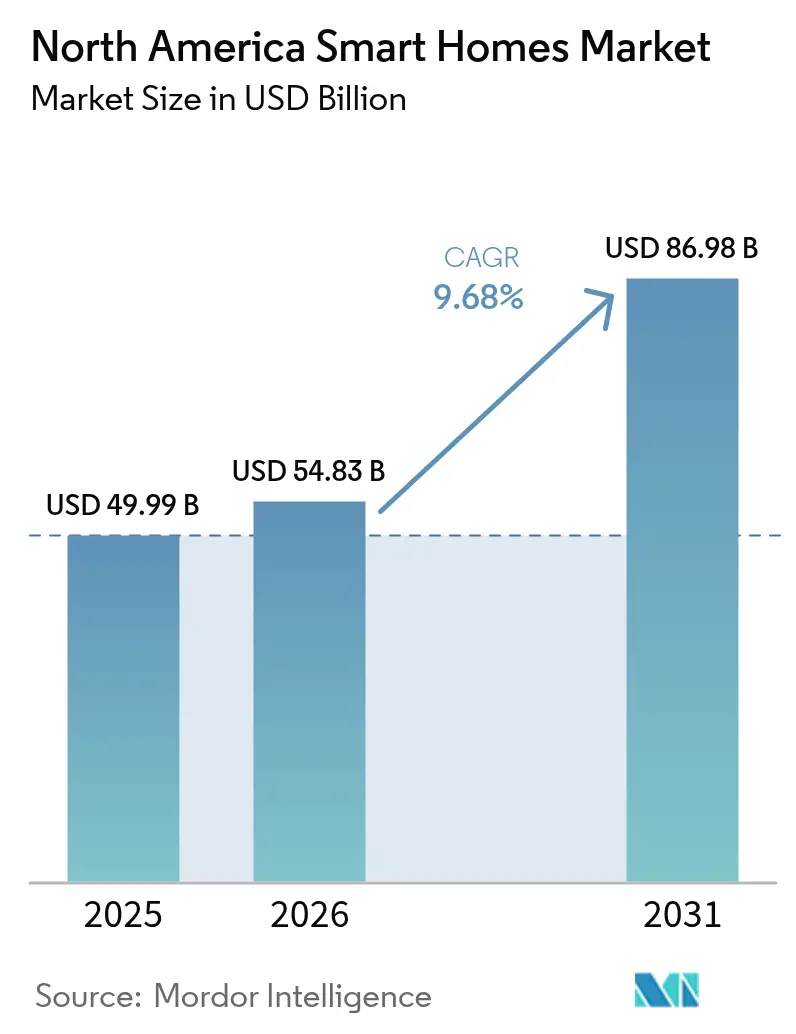
North America smart homes market size in 2026 is estimated at USD 54.83 billion, growing from 2025 value of USD 49.99 billion with 2031 projections showing USD 86.98 billion, growing at 9.68% CAGR over 2026-2031. Robust utility-led demand-response programs, mandatory building decarbonization codes, and post-pandemic hybrid work patterns continue to accelerate connected-device adoption across the region.[1] Insurance premium discounts, declining device prices, and the Matter interoperability standard further lower entry barriers, while privacy regulations help rebuild consumer trust. Competitive intensity remains moderate as platform leaders, including Amazon, Google, Apple, and Samsung, vie with specialized device makers for market share. Headwinds persist from retrofit costs and data-security concerns, yet long-term growth prospects remain intact as utilities, insurers, and builders integrate connectivity into mainstream offerings. Collectively, these forces keep the North America smart homes market on a durable upward trajectory through 2030.
Key Report Takeaways
- By technology, Wi-Fi commanded 43.15% of the 2025 North America smart homes market share, while the Matter protocol is expanding at a 13.05% CAGR through 2031.
- By product type, security and surveillance systems led the North America smart homes market with a 32.35% revenue share in 2025; energy management systems posted the fastest 12.74% CAGR from 2025 to 2031.
- By end user, single-family homes captured a 64.35% share of the North America smart homes market in 2025, whereas multi-family residential adoption is growing at a 11.69% CAGR.
- By distribution channel, online retail accounted for 44.55% of shipments in the North America smart homes market in 2025; however, utility programs are scaling at a 11.98% CAGR.
- By country, the United States retained an 81.85% share of the North America smart homes market in 2025; Mexico is expected to record the highest 10.97% CAGR through 2031.
Note: Market size and forecast figures in this report are generated using Mordor Intelligence’s proprietary estimation framework, updated with the latest available data and insights as of 2026.
North America Smart Homes Market Trends and Insights
Drivers Impact Analysis*
| Driver | (~) % Impact on CAGR Forecast | Geographic Relevance | Impact Timeline |
|---|---|---|---|
| Rising adoption of energy-efficient smart HVAC controls | +2.1% | Global; strongest in California and northeastern states | Medium term (2-4 years) |
| Mandatory building decarbonization codes | +1.8% | CA, NY, WA, select Canadian provinces | Long term (≥4 years) |
| Surge in insurance premium discounts | +1.4% | United States and Canada, expanding to Mexico | Short term (≤2 years) |
| Post-pandemic hybrid work culture | +1.7% | North America core, spillover to urban centers | Medium term (2-4 years) |
| Utility-led demand-response programs | +1.9% | United States and Canada, pilots in Mexico | Medium term (2-4 years) |
| Matter interoperability standard | +1.3% | Global; North America as early-adopter region | Long term (≥4 years) |
| Source: Mordor Intelligence | |||
Rising Adoption of Energy-Efficient Smart HVAC Controls
Utilities now embed smart thermostats into demand-response portfolios, with Pacific Gas and Electric enrolling more than 400,000 devices since 2024.[2] Algorithms that learn occupancy patterns cut household energy use by 10-15%, and cold-climate heat pumps rated to –30 °C open addressable markets in northern latitudes. ENERGY STAR certification, coupled with rebates up to USD 85 per thermostat, keeps momentum strong. Builders adopt connected HVAC systems to meet stretch-code requirements, while renters gain access through bulk purchases made by property managers. Together, these factors position HVAC controls as a prime growth engine for the North America smart homes market.
Mandatory Building Decarbonization Codes in Key States
California’s 2025 Energy Code obligates smart thermostats in all new homes, and fifteen states have already adopted the stricter 2024 International Energy Conservation Code. Canada aims to retrofit 3% of its building stock annually until 2050 under its Green Buildings Strategy, with federal funding exceeding CAD 20 billion (USD 15.2 billion) since 2016. New York targets a 40% reduction in emissions by 2030, spurring municipal rebates for connected lighting and HVAC systems. These policies lock in long-term demand for smart devices as compliance tools rather than optional upgrades, sustaining the North America smart homes market well beyond initial adoption waves.
Surge in Insurance Premium Discounts for Connected Devices
State Farm, Liberty Mutual, and Allstate now offer policy discounts of 5-20% for customers who install qualified security, leak-detection, and monitoring equipment.[3] Claims incidence falls 13% among connected households, delivering actuarial justification for incentives. Canadian insurers Intact and Aviva are piloting comparable programs, although regulatory approvals vary by province. Subsidized hardware and tangible payback via premium savings directly counter affordability barriers, expanding the North America smart homes market into price-sensitive demographics.
Post-Pandemic Hybrid Work Culture Boosting Spend
With 61% of adopters now using entertainment devices as their gateway to broader automation, home offices drive demand for adaptive lighting, noise management, and climate optimization. Video-conferencing-ready lighting systems and automated blinds support productivity, while property managers introduce keyless entry to enhance the tenant experience. These lifestyle shifts keep the North America smart homes market firmly intertwined with future workplace models.
Restraints Impact Analysis*
| Restraints | (~) % Impact on CAGR Forecast | Geographic Relevance | Impact Timeline |
|---|---|---|---|
| High upfront installation and retrofit costs | –1.6% | North America; older housing stock | Medium term (2-4 years) |
| Data privacy and cybersecurity concerns | –1.2% | Global; heightened in Canada and California | Short term (≤2 years) |
| Fragmented connectivity for legacy devices | –0.9% | North America; homes with existing proprietary systems | Long term (≥4 years) |
| Saturation of early-adopter segment | –0.8% | Mature U.S. and Canadian markets | Medium term (2-4 years) |
| Source: Mordor Intelligence | |||
High Upfront Installation and Retrofit Costs
Whole-house automation typically costs USD 15,000-25,000, excluding the additional USD 2,000-5,000 for professional labor, while panel upgrades can add USD 3,000-8,000. Consumers often benchmark smart devices against cheaper non-connected alternatives, overlooking lifetime savings. Retrofit complexity fluctuates by protocol; Wi-Fi gear tends to be plug-and-play, whereas Zigbee and Z-Wave require hub configuration and interference management. Canadian buyers also contend with currency conversion costs and sparse installer networks outside major cities, although Greener Homes grants help mitigate some of the pain. The capital hurdle remains the single largest drag on the North America smart homes market.
Data Privacy and Cybersecurity Concerns
Sixty-five percent of Canadian households fear that hackers will access their appliances, and 62% distrust data collection practices. NIST released baseline IoT security guidelines in 2024, and California’s CCPA sets stringent disclosure rules; yet, adoption lags as consumers weigh convenience against perceived surveillance risks. Amazon and Google’s public backing of global security standards marks progress, but voluntary adherence still leaves gaps. Until certified security labels become ubiquitous, privacy worries will temper the expansion of the North America smart homes market.
*Our forecasts treat driver/restraint impacts as directional, not additive. The impact forecasts reflect baseline growth, mix effects, and variable interactions.
Segment Analysis
By Technology: Wi-Fi Dominance Meets Matter’s Rapid Emergence
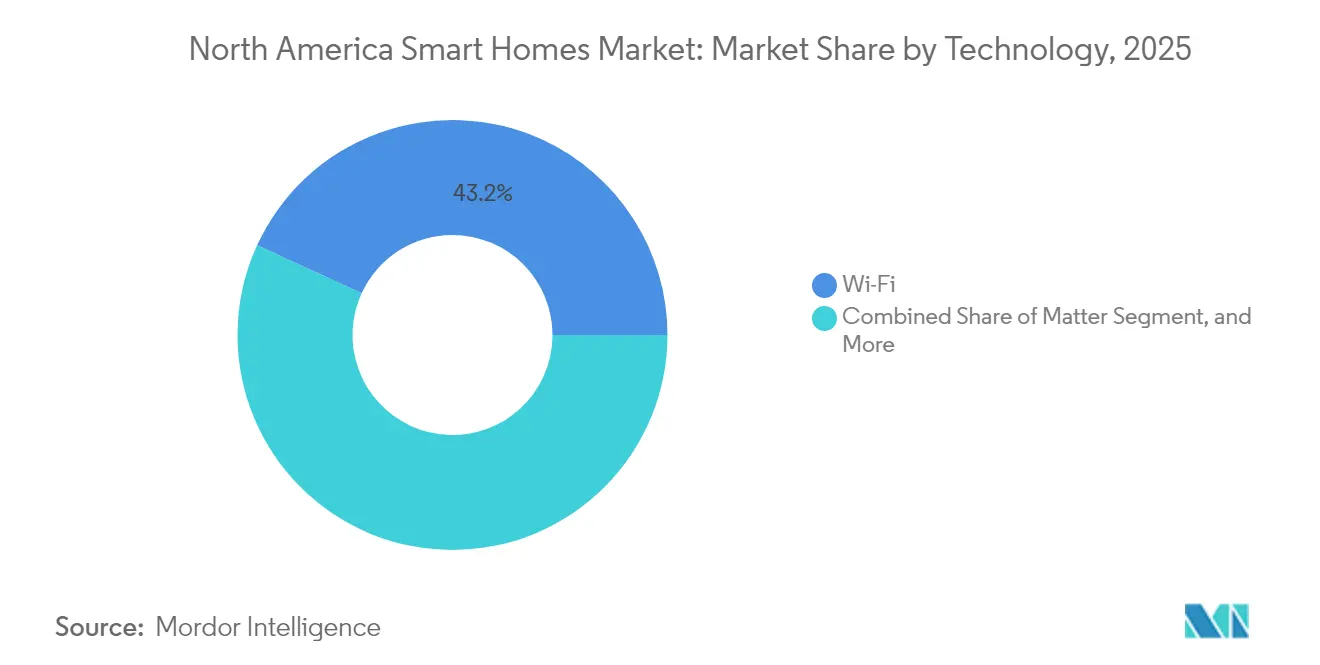
Wi-Fi retained a 43.15% market share in the 2025 North America smart homes market, thanks to ubiquitous household broadband and cloud-direct control pathways. Matter, however, posts a 13.05% CAGR to 2031, absorbing momentum from vendors seeking one-and-done certification. Thread’s low-power mesh supports dense sensor deployments, while Zigbee remains favored by professional installers for its device catalog. Despite 2.4 GHz congestion, Z-Wave’s sub-GHz spectrum carves out a niche for large homes requiring extended range. GSM and RFID target rural or battery-free applications, ensuring protocol pluralism persists even as interoperability improves.
Continued declines in Wi-Fi chip costs keep entry prices low, sustaining high lead volumes, but the open-standard allure of Matter accelerates ecosystem expansion. Vendors aligning firmware roadmaps to this standard reduce engineering overhead, quicken launch cycles, and unlock broader channel distribution. Consequently, the North America smart homes market size for emerging protocols is expected to increase through 2031, ultimately balancing the share between legacy and next-generation stacks.

By Product Type: Security Leadership Yields to Energy-Management Growth
Security and surveillance systems delivered 32.35% of 2025 revenue, bolstered by insurer discounts and professionally monitored packages. Yet energy-management solutions outpace all other categories with a 12.74% CAGR, anchored by smart-thermostat mandates and time-of-use utility tariffs. Lighting remains mainstream as LED prices continue to fall and video-call-friendly, tunable bulbs gain favor among remote workers. HVAC controls benefit from the proliferation of heat pumps in cold climates, while entertainment devices plateau amid saturation. Smart appliances are growing modestly due to long replacement cycles, although embedded connectivity is becoming the default on premium SKUs. Taken together, shifting category momentum signals an evolution from safety-centric demand to efficiency-centric demand inside the North America smart homes market.
Energy-management platforms increasingly integrate machine-learning analytics that deliver verifiable kilowatt-hour savings, unlocking double-dip incentives from utilities and state programs. As payback periods compress to sub-three-year horizons, adoption spreads beyond affluent homeowners into mainstream customer segments, raising the overall North America smart homes market size contributed by this product class.
By End User: Single-Family Dominance Challenged by Multi-Family Expansion
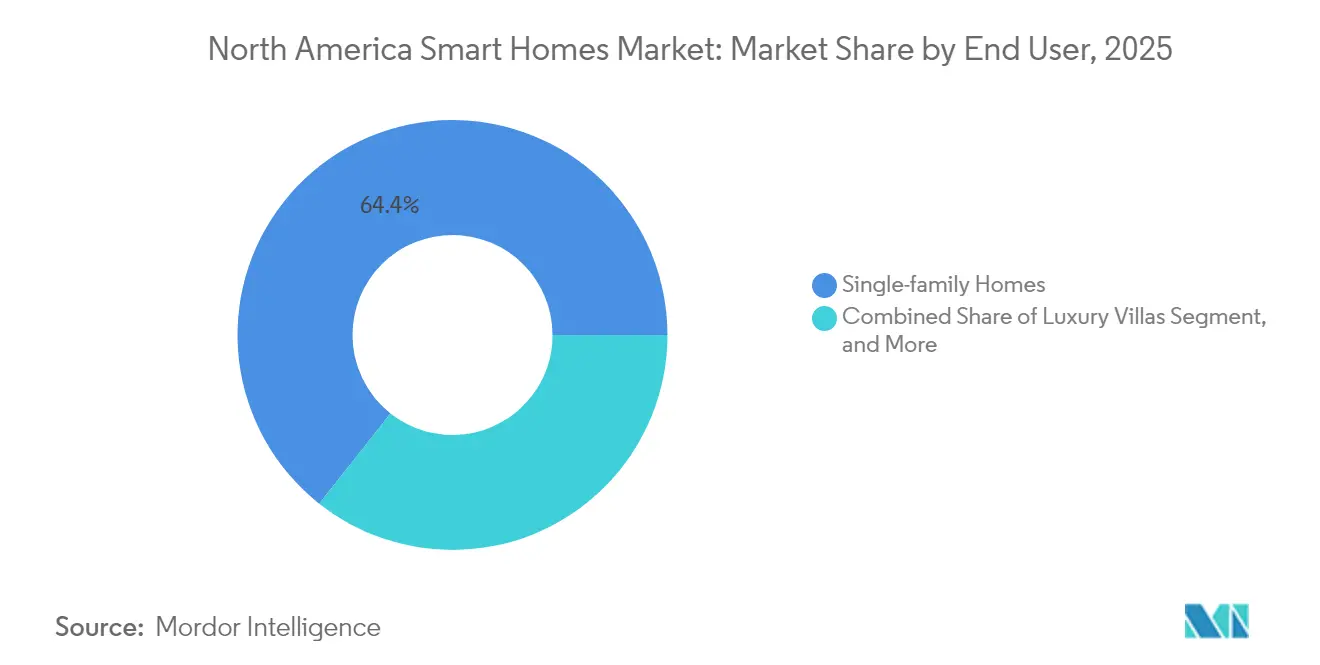
Single-family residences held a 64.35% share in 2025, reflecting higher per-unit disposable income and easier retrofitting options. Multi-family complexes, however, post a swift 11.69% CAGR on the back of property management efficiency gains, remote access, leak detection, and tenant apps, which consolidate operational savings. Condo associations leverage bulk purchasing to lower unit costs, while luxury villas opt for whole-home bespoke suites.
As builders integrate smart infrastructure at the shell stage, per-door hardware costs drop, flattening the adoption curve across income tiers. In parallel, renter-focused subscription models bypass landlord cap-ex constraints, bringing previously inaccessible demographics into the North America smart homes market.
By Distribution Channel: Online Retail Strength Meets Utility Program Innovation
Digital storefronts accounted for 44.55% 2025 volume, capitalizing on comparison tools and rapid fulfillment. Utility marketplaces are now growing at the fastest rate, with a 11.98% CAGR, by bundling rebates, installation, and energy-savings guarantees into single-click-through flows. Professional installers remain essential for complex integrations, while self-install Wi-Fi kits and video tutorials reduce the need for service calls. Offline big-box retailers maintain experiential showrooms but cede share to web-native players. Ongoing channel innovation ensures wide consumer access, sustaining the North America smart homes market even as individual channels mature.
Utility participation also stabilizes demand during economic downturns; customers view subsidized devices as low-risk investments that yield immediate bill credits. Consequently, the North America smart homes market size tied to utility channels will likely double by 2030, diversifying revenue away from pure e-commerce dependency.
Geography Analysis
The United States accounted for 81.85% of 2025 spending, underpinned by 95% household internet penetration, over two million utility-enrolled thermostats, and a dense technology-provider ecosystem. California exemplifies policy-driven acceleration, mandating connected HVAC in new builds, while northeastern states multiply adoption through insurer rebates. Market maturity moderates U.S. growth to high single digits, yet absolute expansion remains sizable, keeping the United States the anchor of the North America smart homes market.
Canada accounts for roughly 15.35% of the regional value. Federal retrofit grants and provincial efficiency codes are projected to sustain an 7-8% CAGR, yet rural installer scarcity and currency-exchange headwinds temper the velocity. Consumer security concerns surpass U.S. averages, prompting vendors to prioritize privacy features. Even so, aggressive cold-climate heat-pump rollouts and eco-conscious homeowner sentiment preserve a healthy contribution to the North America smart homes market size.
Mexico, although smaller in absolute terms, delivers the region’s quickest 10.97% CAGR. Rising middle-class incomes, falling broadband costs, and urban apartment construction unleash pent-up demand. Lower labor rates shrink professional-install surcharges, while growing smartphone adoption eases technical onboarding. Infrastructure gaps outside city centers remain a constraint; yet, metropolitan momentum positions Mexico as a bright spot in the broader North America smart homes market.
Regulatory Landscape
The North America smart homes market is influenced by tighter cybersecurity and consumer-facing transparency requirements for connected devices. In the United States, the FCC's IoT cybersecurity labeling framework was formalized in July 2024 and progressed into the Cyber Trust Mark program in April 2026, giving device makers and retailers a more defined compliance anchor for security assurances.
In Canada, interoperability and radio compliance still shape go-to-market readiness. The Standards Council of Canada confirmed adoption of ISO/IEC 21823-1 as a National Standard of Canada in August 2024, while Innovation, Science and Economic Development Canada (ISED) continues to require equipment certification for Wi-Fi class devices, including 6 GHz RLAN, under applicable radio standards (for example RSS-248), reinforcing certification, testing, and labeling obligations for smart home connectivity products.
Value Chain Analysis
The smart home value chain in North America starts with semiconductor and module suppliers (Wi-Fi/BLE/Thread/Zigbee/Z-Wave chipsets and radio modules), moves into OEM/ODM device manufacturing (cameras, thermostats, sensors, hubs, speakers), then runs through firmware and cloud-service layers, before reaching platform ecosystems (Amazon, Google, Apple, Samsung) that provide identity, automation, voice, and app distribution. Downstream, products flow through online retail, big-box/offline channels, professional installers, builders, and utility program marketplaces that bundle rebates and demand-response enrollment, while after-sales support and subscription monitoring services (security, leak detection, and energy insights) extend lifetime value.
In 2026, two bottlenecks became more visible: interoperability qualification and cross-border documentation. The Connectivity Standards Alliance released Matter 1.6 in June 2026, adding capabilities such as NFC commissioning and Joint Fabric that change how OEMs validate multi-ecosystem behavior. At the same time, U.S. import and filing requirements for certain connected devices increased the operational burden for firmware and protocol traceability. This has made compliance documentation, certification testing, and platform validation cycles more tightly linked to production planning and channel commitments, particularly for vendors shipping hubs/gateways and multi-protocol devices into the United States.
Competitive Landscape
Competition stays moderate as platform titans vie with device specialists. Amazon leverages Alexa’s first-mover advantage and an extensive third-party catalog to cement ecosystem lock-in. Google’s open Home API unlocks over 600 million devices for developers, spurring app-layer innovation.[4] Apple courts privacy-minded buyers through end-to-end encryption, but faces tighter accessory availability compared to its rivals. Samsung integrates SmartThings with its appliance and television lines, recently incorporating Google’s Gemini AI into its Ballie home robot to enhance multimodal control.
Vertical integration sparks M&A: Samsung’s USD 1.4 billion acquisition of Resideo’s ADI unit deepens installer reach, while Google’s Nest division continues to refine Matter-compliant thermostats. White-space pursuits target multi-family portfolios, rural LTE gateways, and AI-driven predictive maintenance. As cybersecurity standards tighten, capital-rich incumbents enjoy compliance cost advantages, nudging smaller challengers into niche specializations. Overall, balanced power dynamics foster steady product differentiation without tipping the North America smart homes market into high concentration.
North America Smart Homes Industry Leaders
-
Amazon.com Inc.
-
Google LLC
-
Apple Inc.
-
Samsung Electronics Co. Ltd.
-
Honeywell International Inc.
- *Disclaimer: Major Players sorted in no particular order
Market Opportunities and Future Outlook
Interoperability and security labeling are creating a clearer commercialization lane for multi-brand installations, especially in energy management and multi-family deployments where property managers and utilities tend to standardize procurement. Matter 1.6 (June 2026, Connectivity Standards Alliance) adds Joint Fabric and NFC commissioning, lowering setup friction and supporting shared control across platforms. CSA Product Security 1.1 broadens system-level security certification (devices, apps, and gateways), aligning with the direction of government-led cybersecurity labeling such as the FCC Cyber Trust Mark program initiated in April 2026. Together, these updates support opportunities for device makers and installers that can deliver repeatable, cross-platform packages (thermostats, sensors, cameras, and hubs) with auditable security posture.
A second opportunity is in platform-led AI experiences and services that improve attach rates beyond initial hardware purchases. Google expanded Gemini for Home access for service providers and hardware partners in May 2026 and followed with additional Gemini-enabled home hardware and software updates in mid-2026, while Samsung extended SmartThings into family care and home security experiences on Galaxy devices. For vendors and service providers, this creates more room for bundled subscriptions (monitoring, preventive maintenance, and energy insights) and retrofit programs that pair utility demand-response enrollment (for example, PG&E reporting more than 400,000 enrolled smart thermostats since 2024) with simplified provisioning and security-certified device stacks.
Recent Industry Developments
- July 2026: Google rolled out version 4.20 of the Google Home app, adding Suggested Automations and improving support for third-party smart cameras. The update tightens app-layer orchestration for mixed-brand homes, helping reduce configuration friction that often limits broader device expansion beyond an initial purchase.
- June 2026: Google introduced a Gemini for Home-enabled Google Home Speaker with Matter support and Thread Border Router capability. By pairing generative-AI voice experiences with interoperability and local-network enablement, the launch pushes the market toward higher-function hubs that can normalize setup and control across device categories.
- July 2024: The FCC cybersecurity labeling program for Internet of Things devices was formalized via a Federal Register action that incorporated the U.S. Cyber Trust Mark concept and QR-code-based consumer information. This accelerated the shift toward security disclosures and comparable labeling in retail channels, raising compliance expectations for vendors selling smart home products in the United States.
Research Methodology Framework and Report Scope
Market Definition and Coverage
For this study, the market is defined as revenue generated from smart home hardware and related solutions that automate, monitor, or control residential functions across North America, including connected security, lighting, HVAC controls, energy management, and home entertainment controls.
Scope exclusions: We exclude non-residential smart building deployments and standalone consumer electronics that do not enable home monitoring or automation use cases.
Segmentation Overview
- By Technology
- Bluetooth
- Wi-Fi
- ZigBee
- Z-Wave
- GSM / GPRS
- RFID
- EnOcean
- Thread
- Matter
- By Product Type
- Security and Surveillance Systems
- Lighting Systems
- HVAC Controls
- Energy Management
- Entertainment Controls
- Smart Appliances
- Smart Speakers
- By End User
- Single-family Homes
- Multi-family Residential
- Condominiums
- Luxury Villas
- By Distribution Channel
- Offline Retail
- Online Retail
- Professional Installers
- Utility Programs
- Builder / Contractor Channels
- By Country
- United States
- Canada
- Mexico
Data Sources, Market Sizing, and Validation
Desk Research
Desk research was used to set the base structure of the market and to anchor inputs that are hard to estimate from interviews alone. We relied on public sources such as US Census housing and household indicators, US Energy Information Administration data for residential electricity use patterns, and FCC materials that help explain connectivity readiness.
To pressure-test adoption and category mix, we also reviewed sources such as Statistics Canada household and dwelling tables, customs and trade statistics for relevant electronics categories, and standards and protocol documentation from industry bodies (for example, interoperability and wireless protocol updates). Company filings, earnings decks, and reputable press were used to track product launches, pricing direction, and channel shifts. We then cross-checked with licensed databases for company financials, news, and patent activity where needed. The sources listed here are only illustrative, and many other references were also consulted for data collection, validation, and clarification.
Primary Interviews and Surveys
Primary work focused on validating what is actually being sold into homes and how category mix is changing by country and channel. We spoke with a balanced set of device brands, connectivity and platform stakeholders, installers and integrators, and large retail and online channel participants across the United States and Canada. We used these inputs to confirm adoption rates, typical bundle sizes, and pricing ranges.
The final model assumptions were tightened through follow-ups where responses diverged, especially on smart security attach rates, DIY versus professionally installed splits, and the speed of new protocol uptake.
Distribution of primary research fieldwork respondents
| Company type | Respondent position |
|---|---|
| Top tier: 34% | CXOs: 16% |
| Mid tier: 49% | Functional/Unit leaders: 25% |
| Smaller Players: 17% | Managers: 59% |
Market-Sizing & Forecasting
Sizing started with a top-down build where the addressable home base was reconstructed by country using household counts, broadband and smartphone penetration, and smart device adoption indicators, followed by category-level splits for security, lighting, HVAC controls, energy management, and entertainment controls. Once the demand pool was set, average revenue per active smart home was applied using category-specific price bands, replacement cycles, and channel mix, and then aggregated to a total market value.
To keep totals realistic, we corroborated results with selective bottom-up approximations, including sampled product pricing across major channels, installer feedback on typical project sizes, and supplier-side revenue disclosures where they were detailed enough to tie back to residential smart home lines. Inputs that mattered most in this market included the installed base of connected devices per household, attach rates for smart speakers and hubs, shift between DIY kits and professional installs, interoperability adoption (for example, Matter readiness), and observed price compression in mature device categories. For forecasting, scenario analysis was used, where the baseline trajectory was shaped by expected housing activity, replacement demand, and connectivity upgrades, then adjusted using expert consensus on adoption speed and mix shifts.
Data Validation & Update Cycle
Estimates were validated through multiple checks, where model outputs were compared against independent signals such as household device penetration ranges, category growth patterns, and country-level splits seen in interviews. Outliers were reviewed in detail, and when a gap could not be explained by a clear variable like price, adoption, or channel structure, we re-checked the underlying assumptions and revisited primary contacts.
Before sign-off, the work goes through stepwise analyst review so that calculation logic, units, and currency handling are consistent across years. The report is refreshed annually, and material events that can shift demand, pricing, or category definitions trigger interim review and updates. Right before delivery, a fresh pass is completed so clients receive the most current view available.
Mordor Intelligence's North America Smart Homes Market Market Size Measured Against Other Published Estimates
Published market sizes for North America smart homes often do not match because the underlying inclusions, base years, and pricing assumptions are not the same. Differences also show up when one source emphasizes device-only revenue while another folds in adjacent services, or when currency timing and inflation treatment are handled differently.
Professional installation fees and ongoing monitoring subscriptions are common add-ons in some estimates, and those items alone can move the total by several billions. Professional monitoring subscriptions sit outside Mordor Intelligence's scope unless they are directly bundled and priced as part of the smart home product revenue being measured, which keeps the total tied to trackable device and solution sales signals and repeatable pricing checks.
Benchmark comparison
| Source | Market Size | Gaps in Research Methodology |
|---|---|---|
| Mordor Intelligence | USD 49.99 B (2025) | |
| Global Consultancy A | USD 32.79 B (2024) | Uses a 2024 base year and a device-category revenue frame with a faster growth curve, which can shift totals versus a 2025 base year and different price update timing. |
| Industry Publisher B | USD 49.00 B (2024) | Anchors the market at 2024 and applies broader category groupings, which can blur device-only revenue with add-on value and create timing differences in currency conversion and pricing refresh. |
The comparison shows that year selection and what gets counted as smart home revenue explain most of the spread across published figures. By keeping the model anchored to household demand signals and category-level pricing that can be re-checked, the final number stays transparent and easier to reproduce when assumptions are updated.
Key Questions Answered in the Report
How big is the North America smart homes market in 2026?
It stands at USD 54.83 billion, with forecasts calling for USD 86.98 billion by 2031.
Which technology leads adoption?
Wi-Fi holds 43.15% of 2025 share, though Matter is expanding fastest at a 13.05% CAGR.
What segment is growing most quickly?
Energy-management systems, driven by utility rebates and building codes, post a 12.74% CAGR.
Why are utilities important to smart-home growth?
They subsidize thermostats, enroll devices in demand-response, and now represent the fastest-growing 11.98% channel.
How do privacy concerns affect adoption?
Sixty-five percent of Canadian households cite hacking fears, slowing uptake until certified security standards mature.
Which country is the regional growth hotspot?
Mexico leads with an 10.97% CAGR through 2031, propelled by urbanization and rising middle-class incomes.