
Market Overview
| Study Period | 2020 - 2031 |
|---|---|
| Market Size (2026) | USD 351.22 Billion |
| Market Size (2031) | USD 432.74 Billion |
| Growth Rate (2026 - 2031) | 4.26 % |
| Fastest Growing Market | Middle East and Africa |
| Largest Market | Asia Pacific |
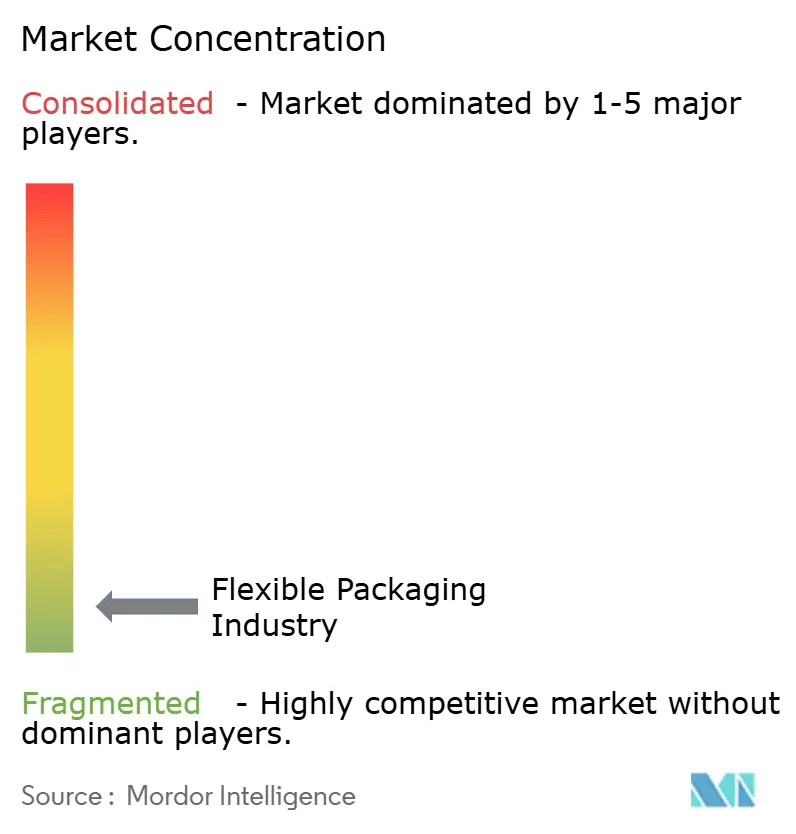
| Market Concentration | Low |
Major Players *Disclaimer: Major Players sorted in no particular order Image © Mordor Intelligence. Reuse requires attribution under CC BY 4.0. | |
Flexible Packaging Market Analysis by Mordor Intelligence
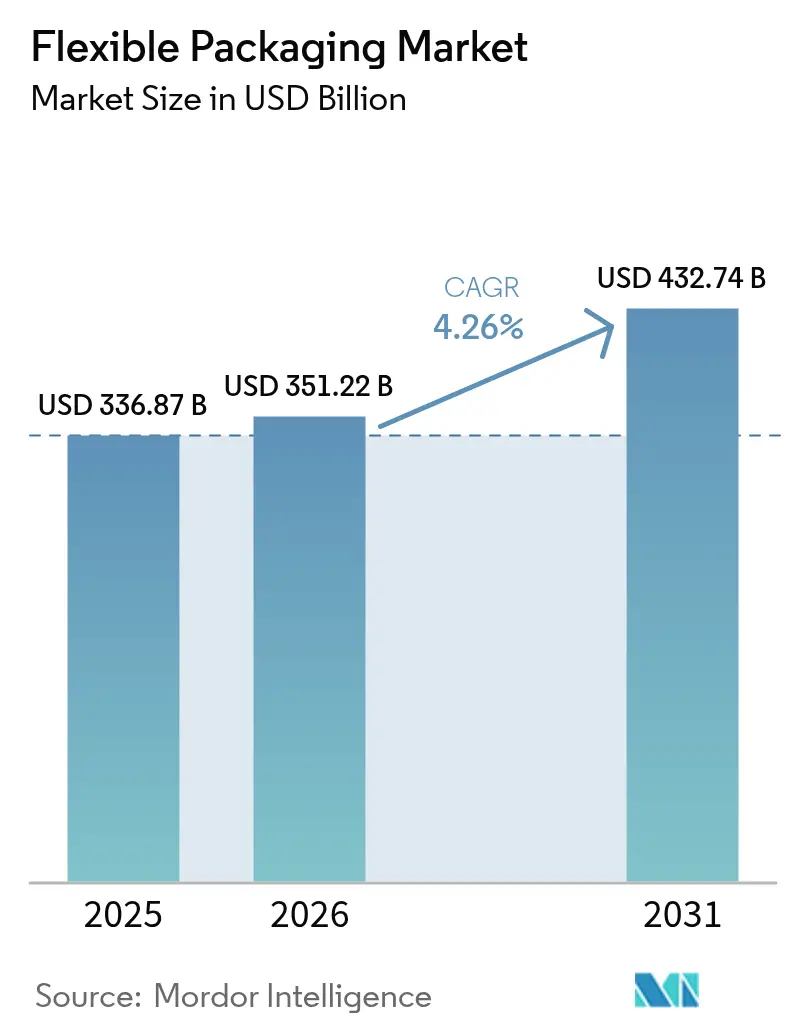
The Flexible Packaging market size is expected to grow from USD 336.87 billion in 2025 to USD 351.22 billion in 2026 and is forecast to reach USD 432.74 billion by 2031 at 4.26% CAGR over 2026-2031.
Rising sustainability mandates, rapid e-commerce expansion, and brand demand for lightweight, high-barrier formats are widening the flexible packaging industry opportunity. Material science breakthroughs, particularly in mono-material structures, are reducing landfill pressure and unlocking new circular revenue streams for converters. Digital printing is compressing launch cycles for niche products, while just-in-time workflows mitigate the earnings volatility caused by polyolefin price swings. Regionally, Asia Pacific’s expanding middle class and manufacturing scale underpin its leadership, whereas the Middle East and Africa’s packaging infrastructure boom is accelerating its catch-up growth.
Key Report Takeaways
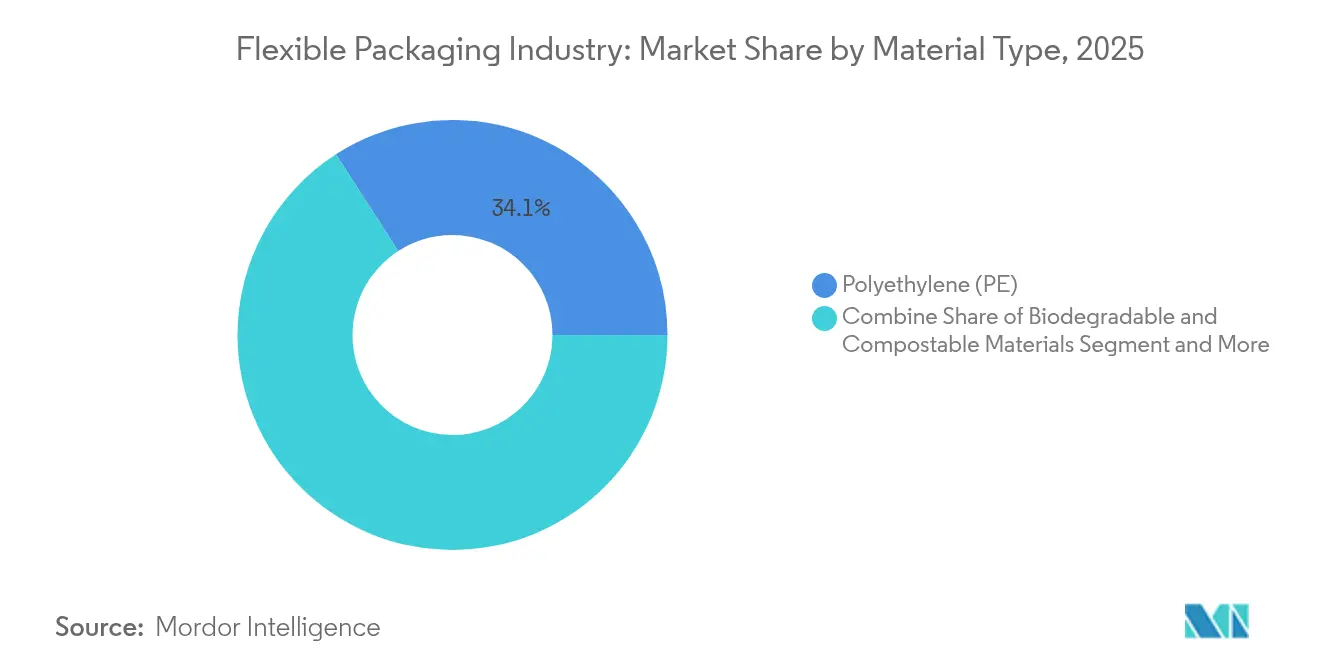
- By material type, polyethylene led with 34.12% of flexible packaging industry share in 2025; biodegradable and compostable materials are projected to post the fastest 7.65% CAGR through 2031.
- By product type, pouches captured 46.05% revenue share of the flexible packaging industry size in 2025, while films and wraps are poised for the quickest 5.61% CAGR to 2031.
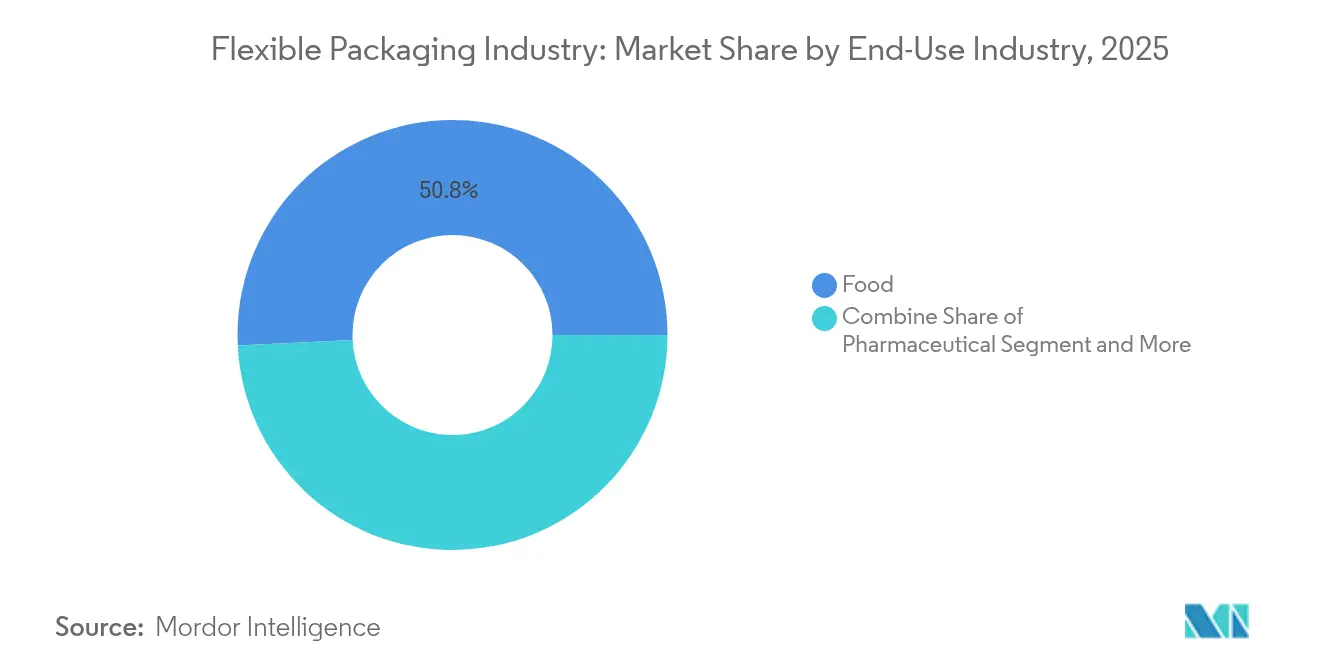
- By end-use industry, food accounted for 50.78% of the flexible packaging industry size in 2025; pharmaceuticals are forecast to grow at a 6.47% CAGR between 2026-2031.
- By distribution channel, direct sales dominated with 65.10% of the flexible packaging industry share in 2025, whereas indirect channels are expanding at a 5.76% CAGR.
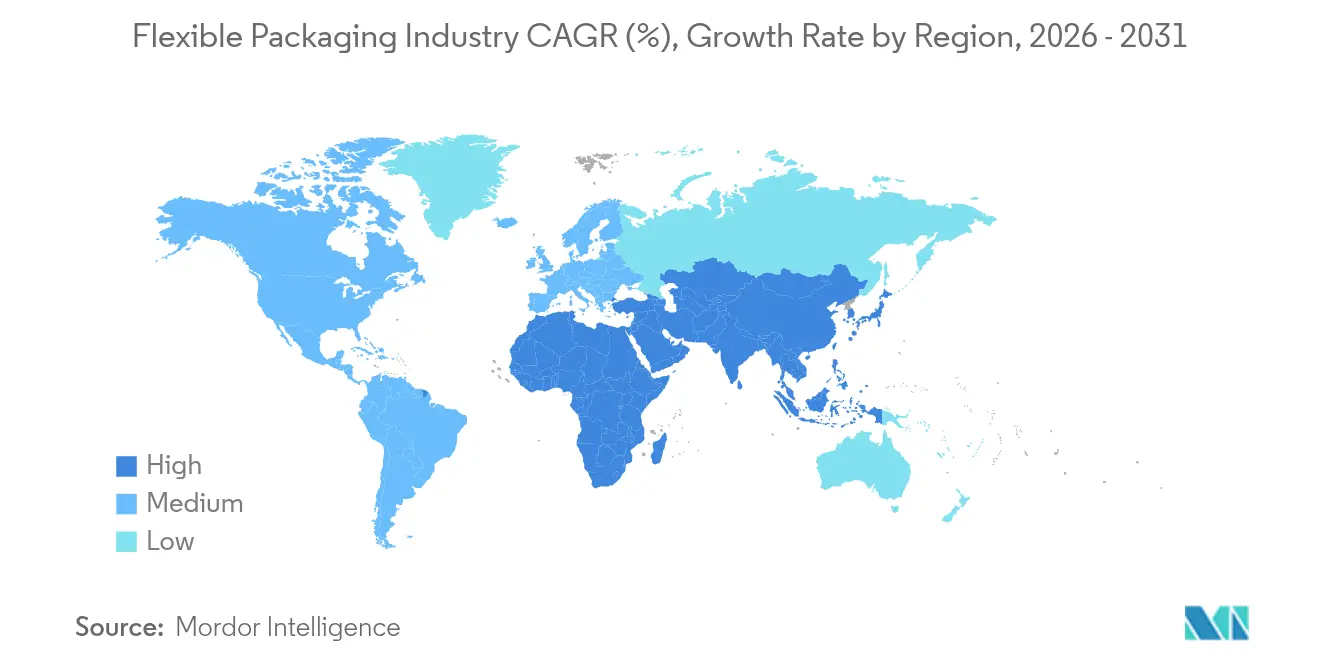
- Asia Pacific held 44.70% of the flexible packaging industry share in 2025, and the Middle East and Africa region is expected to register the highest 6.03% CAGR to 2031.
Note: Market size and forecast figures in this report are generated using Mordor Intelligence’s proprietary estimation framework, updated with the latest available data and insights as of 2026.
Market Trends and Insights
Drivers Impact Analysis of Flexible Packaging Market*
| Driver | (~) % Impact on CAGR Forecast | Geographic Relevance | Impact Timeline |
|---|---|---|---|
| Surge in e-commerce demand for lightweight protective mailers in North America | +0.8% | North America, with spillover to Europe and Asia Pacific | Medium term (2-4 years) |
| Shift of Asian FMCG brands toward mono-material recyclable films to meet EPR mandates | +1.0% | Asia Pacific, particularly India, China, and ASEAN | Long term (≥ 4 years) |
| Rapid adoption of retort pouches for ready-to-eat meals in Europe | +0.6% | Europe, with growing adoption in North America | Medium term (2-4 years) |
| Coffee & specialty-drink brands' switch to high-barrier films in South America | +0.4% | South America, particularly Brazil and Colombia | Short term (≤ 2 years) |
| Investments in digital printing enabling mass customization for cosmetics packs | +0.7% | Global, with concentration in Europe and North America | Medium term (2-4 years) |
| Growth in cold-chain biologics blister demand boosting pharma flexible packaging | +0.5% | North America, Europe, and developed Asia Pacific | Long term (≥ 4 years) |
| Source: Mordor Intelligence | |||
Surge in e-commerce demand for lightweight protective mailers
North American online sales expanded by 15.4% in 2024, pushing retailers to adopt flexible bubble mailers that cut dimensional-weight fees up to 30%. Amazon’s removal of 9,100 metric tons of plastic in India and its wider rollout of recyclable paper padded bags illustrate how corporate carbon pledges are steering procurement toward fiber-and-film hybrids[1]Converter order books now favor curbside-recyclable mailers with high recycled-content films, spawning capacity additions across the United States and Mexico. Volumes are also spilling into Europe as right-sizing mandates tighten, while Asian parcel networks replicate these cost-efficient formats. The net effect is a sustained uplift in poly-coated mailer demand that lifts the flexible packaging industry beyond traditional FMCG end uses.
Shift of Asian FMCG brands toward mono-material recyclable films
India’s Plastic Waste Management Rules in FY 2025 require brand owners to demonstrate quantifiable recycling of their packaging footprints, compelling leading food and oral-care players to replace multilayer laminates with polyolefin-only films. Solutions such as PP-based WICOFILM from Wipf AG preserve oxygen and aroma barriers yet flow seamlessly through existing recycling streams. [2]ASEAN personal-care brands echo this switch, leveraging mono-material pouches to secure shelf appeal while satisfying retailer take-back schemes. Supply-side innovation is spreading across Asia Pacific, helping the region reinforce its 45.24% hold on the flexible packaging industry. With most EPR fees escalating annually, converters that scale mono-material capacity are positioned to secure premium contracts and margin resilience.
Rapid adoption of retort pouches for ready-to-eat meals
European households are gravitating toward shelf-stable convenience food, accelerating retort pouch conversions for sauces, soups, and rice dishes. Mondi’s RetortPouch Recyclable eliminates aluminum foil while tolerating 121 °C sterilization, meeting 2030 EU recyclability targets. Co-packers report downtime reductions owing to faster heat transfer versus cans, and brand owners cite logistics savings of up to 60% on inbound transport. Retail merchandising benefits from improved facing counts, further boosting retort penetration. Emerging North American processors now pilot the same technology, indicating a widening addressable base and reinforcing growth momentum inside the flexible packaging industry.
Coffee and specialty-drink brands’ switch to high-barrier films
Brazilian and Colombian roasters increasingly specify aluminum-free, EVOH-enhanced laminates that protect volatile flavor compounds. Constantia Flexibles’ PERPETUA laminate and AluKpod capsule illustrate how barrier optimization coexists with recyclability. Market feedback shows specialty coffee SKUs extending shelf life by three months, allowing exporters to access premium markets without nitrogen flushing. The development reshapes pouch, stick-pack, and capsule designs, fueling a 0.4% positive lift to the global flexible packaging market CAGR.
Restraints Impact Analysis of Flexible Packaging Market*
| Restraint | (~) % Impact on CAGR Forecast | Geographic Relevance | Impact Timeline |
|---|---|---|---|
| Volatile polyolefin prices squeezing converter margins | -0.6% | Global, with higher impact in Asia Pacific and Europe | Short term (≤ 2 years) |
| Fragmented recycling infrastructure for multilayer laminates in EU & US | -0.5% | Europe and North America | Medium term (2-4 years) |
| Stricter single-use plastic bans in key emerging economies (e.g., India, Kenya) | -0.4% | Asia Pacific and Africa | Long term (≥ 4 years) |
| Rigid PET bottles limiting stand-up pouch penetration in Middle-East CSD segment | -0.3% | Middle East | Medium term (2-4 years) |
| Source: Mordor Intelligence | |||
Volatile polyolefin prices squeezing converter margins
Feedstock volatility reached double-digit spreads in 2024, eroding EBITDA for converters locked into quarterly price agreements. Asian PE and PP oversupply and shipping disruptions amplify the swings. To blunt margin shocks, leading converters deploy thinner gauge films, digitalize inventory planning, and explore biomass-based naphtha contracts to diversify risk exposure. This restraint remains transitory yet accelerates the shift toward materials that provide price stability and recycled content, indirectly modernizing the flexible packaging industry supply base.
Fragmented recycling infrastructure for multilayer laminates
Only 7% of flexible plastic packaging collected in the United Kingdom is recycled, revealing a structural lag versus ambitious EU PPWR goals.[3]The CEFLEX Quality Recycling Process pilot indicates material yield gains through advanced sortation, but nationwide rollouts require capex of USD 36–43 billion in the United States alone. Until scaled, brand owners curb multilayer usage, constraining certain high-barrier applications and moderating near-term growth in the flexible packaging industry.
*Our forecasts treat driver/restraint impacts as directional, not additive. The impact forecasts reflect baseline growth, mix effects, and variable interactions.
Flexible Packaging Market Segment Analysis
By Material Type:
Biodegradables Disrupt Traditional DominancePolyethylene underpinned 34.12% of flexible packaging industry share in 2025, leveraging its low cost and moisture barrier attributes to anchor core food applications. Its wide resin availability and established recycling streams keep it the default choice for cereal liners, frozen food films, and detergent pouches. However, biodegradable and compostable polymers exhibit the fastest 7.65% CAGR from 2026-2031 as retailers introduce home-compostable private-label lines and municipalities upgrade organic waste programs. This momentum realigns R&D budgets toward PLA- and PHA-based coextrusions that mimic LDPE toughness yet break down within industrial composting cycles. Paper laminates also resurge where water vapor requirements are moderate, while aluminum foil defends niche roles that demand near-zero oxygen transmission. EVOH, albeit used in microlayer form, remains critical for aseptic broths and nutraceutical gels. Collectively, the material portfolio is pivoting toward solutions that reduce Scope 3 emissions without forfeiting machinability, reinforcing the flexible packaging market’s pivot to circularity.
The flexible packaging industry size for biodegradable materials is projected to climb from USD 33.6 billion in 2026 to USD 48.6 billion in 2031, fueled by FMCG decarbonization roadmaps and landfill diversion fees. Polyethylene still commands the volume crown, yet its dominance is expected to edge down as consumer-facing categories impose minimum recycled-content thresholds. BOPP’s clarity and stiffness uphold its presence in snack foods, while CPP’s heat-seal reliability ensures its inclusion in retort and twist-wrap packs. Resin makers are investing in chemical recycling to recapture PP and PE monomers, enabling true polymer-to-polymer loops that preserve material performance. As these initiatives scale, converters foresee a blended portfolio where mechanical, chemical, and bio-degradation pathways coexist, each serving distinct channel needs within the flexible packaging industry.

By Product Type:
Digital Printing Transforms Pouch EconomicsPouches generated 46.05% of 2025 revenue, spotlighting their ability to replace glass jars and tins with 70% lighter formats that lower freight emissions. Stand-up pouches enhance billboard space, driving impulse purchases in condiments and pet food. The advent of high-definition inkjet presses slashes make-ready waste and enables SKU proliferation for seasonal flavors, supporting D2C brands and private-label refreshes. Films and wraps, while less visible on shelf, register the sharpest 5.61% CAGR by trimming gauge thicknesses without sacrificing puncture resistance. Nanoclay and silicon oxide barrier coatings now substitute aluminum layers, improving sortability and stream recyclability.
Meanwhile, the flexible packaging industry size for bags and sacks holds steady, buoyed by fertilizer, cement, and dog-food demand. Sachets and stick packs continue to penetrate single-serve nutraceuticals and instant beverages, particularly in Southeast Asia where on-the-go consumption is rising. Over the next five years the interplay between digital press uptime, solvent-less lamination, and e-beam curing is expected to compress lead times from weeks to days, pushing converters to rethink plant layouts. The end result is a product mix that rewards agile operations able to toggle between long food-service runs and micro batches for influencer collaborations.
By End-use Industry:
Pharmaceuticals Lead Growth Through Cold-Chain InnovationFood maintained 50.78% dominance in 2025, reflecting the category’s sheer volume across bakery, dairy, and produce. Antifog PE/PP blends and resealable zippers are now standard, aligning with consumer preference for multi-portion pouches that cut food waste. Meat, seafood, and cheese packaging increasingly deploys vacuum skin and high-barrier shrink films to prolong freshness by up to 25 days, underpinning stable replacement cycles.
Pharmaceuticals, however, are the velocity engine, expanding at a 6.47% CAGR on the back of biologics and personalized medicine. Unit-dose blister strips and low-temperature pouches protect temperature-sensitive injectables in last-mile delivery. Compatibility with cryogenic storage drives demand for COC/CPP laminates, while UV-blocking additives secure photostability for gene therapies. Cosmetics follow as the next bright spot, using dielectric inkjet embossing to deliver tactile finishes without lamination. Industrial and chemical segments emphasize chemically resistant liners and UN-certified ADR pouches, ensuring the flexible packaging market retains a diversified demand base.
By Distribution Channels:
E-commerce Reshapes Supply Chain DynamicsDirect sales controlled 65.10% of industry revenue in 2025, a testament to converters’ long-standing co-development partnerships with global CPG majors. In these arrangements, joint R&D cycles and onsite technical service ensure early troubleshooting and rapid scale-up. Yet indirect channels—spanning distributors, online procurement platforms, and secondary converters—are gaining traction at 5.76% CAGR. Marketplaces now curate catalogues of stock pouch formats, enabling SMEs to purchase MOQ-free quantities and customize graphics digitally. This democratization widens the addressable customer pool for mid-sized converters, particularly in nutraceuticals and gourmet food startups.
Hybrid fulfillment models are emerging, where converters hold blank inventory and overlay graphics in regional hubs within 72 hours of order receipt. Such agility satisfies influencer-driven limited-edition drops and subscription meal kits. Further, blockchain-enabled portals share live resin prices and carbon metrics, letting procurement teams benchmark offers transparently. Combined, these trends embed omnichannel flexibility into the flexible packaging industry, recalibrating production planning and replenishment logic for a post-pandemic commerce ecosystem.
Geography Analysis
APAC Flexible Packaging Market
Asia Pacific retained a commanding 44.70% share of the flexible packaging industry in 2025 due to urbanization, rising disposable incomes, and pro-manufacturing policies. China’s smart-factory investments and India’s Production Linked Incentive scheme for food processing underpin domestic resin and film capacity. UFlex doubled polyester chip output and commissioned a PCR plant to integrate post-consumer feedstock, fortifying a circular supply proposition. Local converters also spearhead mono-material rollouts to comply with forthcoming EPR fees, reinforcing the region’s trajectory. Meanwhile, Southeast Asian nations leverage duty-free trade clusters to export stand-up pouches, lifting intraregional trade flows.
North America and Europe Flexible Packaging Market
North America is the second-largest node, propelled by e-commerce mailer adoption and pharmaceutical cold-chain growth. Retailers press for How2Recycle-certified pouches, prompting PE film recyclability upgrades. OEMs integrate digital inspection to guarantee FDA-grade traceability, reinforcing market integrity. Europe anchors its strategy around the EU PPWR, channeling funds into chemical-recycling pilot plants and fiber-based flexibles. Mondi and Huhtamaki expand recyclable retort lines and blueloop portfolios, respectively, embedding design-for-recycling principles at scale.
MEA and South America Flexible Packaging Market
The Middle East & Africa is forecast to post the fastest 6.03% CAGR to 2031, aided by FDI-backed food hubs in Saudi Arabia and Egypt. Africa’s packaging sector is on course to hit USD 56.02 billion by 2031, of which flexible formats could surpass USD 3.38 billion by 2033. Modern retail chains require extended-shelf-life pouches for arid climates, stimulating imports of high-barrier films. South America’s specialty coffee boom strengthens demand for degassing valve pouches, while currency volatility makes the lighter flexible packaging industry more attractive than rigid glass or metal. Across regions, a common thread is regulatory-driven recycling targets that unify converter R&D roadmaps toward mono-materials.
Regulatory Landscape
Flexible packaging regulation tightens around recyclability, labeling, and substantiation of sustainability claims, so compliance increasingly becomes a design-and-data requirement. In the European Union, Regulation (EU) 2025/40 (Packaging and Packaging Waste Regulation, PPWR) entered into force on 11 February 2025, shifting the region from a directive-based approach to a directly applicable regulation, with general application starting 12 August 2026.
Competitive Landscape
The flexible packaging market hosts a fragmented hierarchy. Market leaders such as Amcor, Mondi, Huhtamaki, and Constantia Flexibles channel capex into recyclable laminates and digital printing assets to capture premium margins. Amcor’s planned USD 8.4 billion acquisition of Berry Global would vault it to the apex of flexible packaging capacity, especially in healthcare formats. Huhtamaki’s 2024 EBIT uptick stems from portfolio realignment toward blueloop mono-materials and North American egg-carton debottlenecking.
Strategic alliances revolve around chemical-recycling joint ventures and end-to-end circular pilots with brand owners. White-space entrants include biopolymer innovators scaling PHA resins and cloud-native print-on-demand platforms that sidestep large-volume economics. Private-equity backed roll-ups concentrate on mid-tier converters with region-specific barrier know-how, seeking synergies through shared prepress and resin procurement. Competitive intensity remains highest in retort pouches and medical films where qualification barriers deter new entrants. As a result, incumbents focus on cradle-to-grave sustainability credentials and geographic adjacency, shaping a battlefield where technology and ESG metrics decide contract wins.
Flexible Packaging Industry Leaders
-
Mondi PLC
-
Sealed Air Corporation
-
Huhtamaki Oyj
-
Amcor plc
-
Sonoco Products Company
- *Disclaimer: Major Players sorted in no particular order
Flexible Packaging Market Companies Covered in this Report
- Amcor plc
- Sealed Air Corporation
- Mondi plc
- Huhtamaki Oyj
- Constantia Flexibles Group GmbH
- Sonoco Products Company
- ProAmpac LLC
- Coveris Management GmbH
- Uflex Ltd.
- Sigma Plastics Group
- Schur Flexibles Holding
- Wipf AG
- Glenroy Inc.
- Printpack Inc.
- Clondalkin Flexible Packaging
- American Packaging Corporation
- FlexPak Services LLC
- Arabian Flexible Packaging LLC
- Gulf East Paper & Plastic Industries LLC
- Plastipak Packaging Inc.
Market Opportunities and Future Outlook
Under the PPWR framework, design-for-recycling, packaging minimisation, and harmonised labeling move into core market access criteria for flexible formats. The European Commission is required to adopt implementing acts by 12 August 2026 establishing harmonised labels and digital labeling specifications for packaging, which will affect artwork governance and the way flexible pack data is managed.
In the United States, FTC Green Guides (16 CFR Part 260) set the anchor for environmental marketing claims. The guidance also indicates that recyclable claims depend on facility availability to at least 60 percent of consumers or communities where the product is sold, shaping how converters and brand owners structure recyclability evidence for flexible packs.
Recent Industry Developments in Flexible Packaging Market
- June 2026: Mondi launched re/loop FlowWrap for wet wipes packaging with 35% post-consumer recycled (PCR) content. The rollout extends PCR integration into performance-sensitive flexible formats as brands tighten recycled-content specifications.
- November 2025: Sealed Air introduced Cryovac VPP MonoPro, a monomaterial, recycle-ready vertical form-fill-seal (VFFS) pack for fluid and pumpable foods. The launch adds a recycle-ready option for high-throughput food applications where conventional multilayer structures have been harder to replace.
- April 2024: Amcor launched Eco Protect diaper packaging with 30% recycled content in Peru in partnership with Kimberly-Clark. The collaboration highlights scaled adoption of recycled-content flexible packaging in hygiene and provides reference designs that other brand owners can use to support qualification and rollout.
Flexible Packaging Market Report Scope and Research Methodology
Market Definition and Coverage
For this study, the flexible packaging market covers packaging products that can be bent or molded, and that are used to protect, carry, and display goods across end users, measured in revenue terms.
Scope exclusions: We exclude the value of the packed product itself and focus only on the packaging material and conversion value.
Segments Covered in This Report
- By Material Type
- Plastic
- Polyethylene (PE)
- Biaxially Oriented Polypropylene (BOPP)
- Cast Polypropylene (CPP)
- Polyvinyl Chloride (PVC)
- Ethylene-Vinyl Alcohol (EVOH)
- Other Flexible Plastic
- Paper
- Aluminum Foil
- Biodegradable and Compostable Materials
- Plastic
- By Product Type
- Pouches
- Bags and Sacks
- Films and Wraps
- Other Product Types
- By End-use Industry
- Food
- Frozen Food
- Dairy Based Products
- Meat and Seafood
- Baked Snacks and Confectionery
- Fresh Produce
- Other Food Products
- Beverage
- Juice and Nectare
- Dairy Based Drinks
- Other Beverages
- Pharmaceutical
- Cosmetics and Personal Care
- Industrial
- Other End -Use Industry
- Food
- By Distribution Channels
- Direct Sales Channel
- Indirect Sales Channel
- By Geography
- North America
- United States
- Canada
- Mexico
- Europe
- United Kingdom
- Germany
- France
- Italy
- Spain
- Nordics
- Asia Pacific
- China
- Japan
- India
- ASEAN
- South Korea
- Australia
- New Zealand
- South America
- Brazil
- Argentina
- Chile
- Middle East and Africa
- Middle East
- United Arab Emirates
- Saudi Arabia
- Turkey
- Rest of Middle East
- Africa
- South Africa
- Kenya
- Rest of Africa
- Middle East
- North America
Data Sources, Market Sizing, and Validation
Desk Research
Desk research helped us set the market boundaries and build reliable anchors for demand and supply signals before any modeling started. We used public sources such as UN Comtrade trade statistics, national statistics offices, and customs releases to understand material flows for key substrates like plastics, paper, and aluminum foil. We also referred to packaging association publications and conference notes, along with peer-reviewed papers on barrier films and recyclability, to keep the definitions practical.
On the company side, annual reports, investor presentations, and press releases were used to map capacity additions, plant utilization commentary, and major end market exposure. For cross-checks, we selectively used paid subscriptions for company financials and intelligence, patent databases, and shipment level trade databases when public splits were missing or outdated. The sources listed here are illustrative only, and many other public documents and data points were reviewed for collection, validation, and clarification.
Primary Interviews and Surveys
Primary work was used to pressure test the desk assumptions, especially where pricing and mix shift change totals quickly. We spoke with converters, material suppliers, distributors, and large packaging buyers across APAC, EMEA, and the Americas, and then we clarified how volumes move across pouches, wraps, and rollstock under different end use demand conditions. Where answers differed, we re-checked definitions with respondents and aligned the final model inputs to what is actually billed and shipped in the market.
Distribution of primary research fieldwork respondents
| Company type | Respondent position | Region |
|---|---|---|
| Top tier: 38% | CXOs: 12% | APAC: 46% |
| Mid tier: 44% | Functional/Unit leaders: 37% | EMEA: 36% |
| Smaller Players: 18% | Managers: 51% | Americas: 18% |
Market-Sizing & Forecasting
Sizing started with a top-down build where packaging demand was reconstructed from end use output and consumption signals, and then translated into flexible packaging needs through adoption and format intensity assumptions. We used value based logic that ties together packaged food volumes, pharmaceutical unit packs, personal care output, and e-commerce shipment trends, followed by packaging per unit indicators that were confirmed during interviews. To keep the inputs realistic, we tracked substrate level price movement, resin and foil cost direction, typical conversion margins, and the share shift toward high barrier and recyclable structures (which changes average selling price).
The totals were corroborated with selective bottom-up approximations, such as sampled converter revenue checks, format level volume estimates multiplied by realistic ASP ranges, and channel discussions on contracted versus spot pricing. When a data gap appeared, we used conservative interpolation based on nearby markets with similar material mix, and then re validated the implied per capita packaging spend with experts. Forecasts were prepared using scenario analysis, where base case growth was linked to the expected path of packaged food demand, lightweighting, and regulatory driven material substitution, and then moderated by realistic pricing pass through and capacity addition timing.
Data Validation & Update Cycle
Model outputs were cross-checked against independent signals, including trade flows, resin price movements, and stated capacity utilization trends, so the final value does not rely on a single indicator. Outliers were flagged and reviewed in steps, first by checking units and currency conversions, and then by re-checking the underlying assumption with at least one additional source. When a change in resin pricing, regulation, or end use demand looked material, respondents were re contacted so the assumption could be corrected before sign off.
The report is refreshed on an annual cycle, and interim updates are made when major events could shift pricing or demand patterns. Before delivery, we do a final pass to confirm that the latest public releases and market signals are reflected in the numbers.
Mordor Intelligence's Flexible Packaging Market Size Measured Against Other Published Estimates
Published market sizes for flexible packaging often look different because the timing of price assumptions and currency conversion choices can move the total even when volumes are similar. Another common reason is that some studies treat flexible films, laminates, and printed structures differently, which changes the average selling price that gets applied.
In our work, the biggest swings were usually traced to how often input prices are refreshed and whether the value is normalized to a consistent exchange rate window, and then checked against trade and capacity signals to avoid overstating short term spikes, a discipline applied by Mordor Intelligence.
Benchmark comparison
| Source | Market Size | Gaps in Research Methodology |
|---|---|---|
| Mordor Intelligence | USD 351.22 B (2026) | |
| Industry Publisher A | USD 281.81 B (2024) | Uses an earlier base year, and the value can sit lower when resin and conversion price updates are not rolled forward to the same timing window used in later year studies. |
| Industry Publisher B | USD 282.15 B (2024) | Reports a 2024 snapshot with broad application splits, and differences can come from how pouch and rollstock mix is priced, plus whether recycled content and high barrier structures are counted at premium ASP levels. |
The spread in the table largely comes from year selection and the way pricing is updated, rather than a disagreement that flexible packaging demand is growing. By tying the value build to clear demand pools, using realistic ASP ranges, and re-checking results against trade and capacity signals, the final number stays traceable and repeatable for decision making.
Key Questions Answered in the Report
What is the current flexible packaging market size?
The flexible packaging industry size stands at USD 351.22 billion in 2026 and is projected to reach USD 432.74 billion by 2031.
Which region leads the flexible packaging industry?
Asia Pacific leads with a 44.70% share, supported by urbanization, manufacturing scale, and proactive sustainability regulations.
Which material is growing fastest in flexible packaging?
Biodegradable and compostable polymers show the quickest 7.65% CAGR from 2026-2031 as brands pursue compostable and bio-based options.
How is e-commerce influencing flexible packaging demand?
Online retail growth drives adoption of lightweight, curbside-recyclable mailers and fuels investment in digital printing for personalized packs.
Why are pharmaceuticals important for flexible packaging growth?
Cold-chain biologics and unit-dose formats require high-barrier films, propelling a 6.47% CAGR in pharmaceutical flexible packaging through 2031.
What role does digital printing play in flexible packaging?
Digital presses lower minimum order quantities and enable mass customization, accelerating product launches and reducing inventory waste.