
Market Overview
| Study Period | 2020 - 2031 |
|---|---|
| Market Size (2026) | USD 205.74 Billion |
| Market Size (2031) | USD 247.10 Billion |
| Growth Rate (2026 - 2031) | 3.73 % |
| Fastest Growing Market | South America |
| Largest Market | Asia-Pacific |
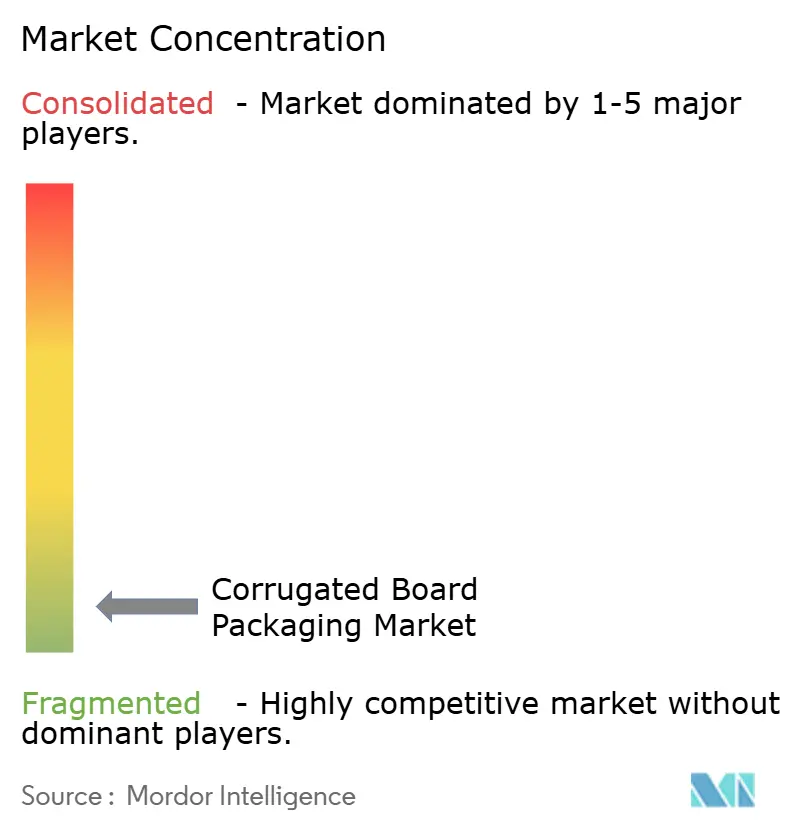
| Market Concentration | Low |
Major Players *Disclaimer: Major Players sorted in no particular order Image © Mordor Intelligence. Reuse requires attribution under CC BY 4.0. | |
Corrugated Board Packaging Market Analysis by Mordor Intelligence
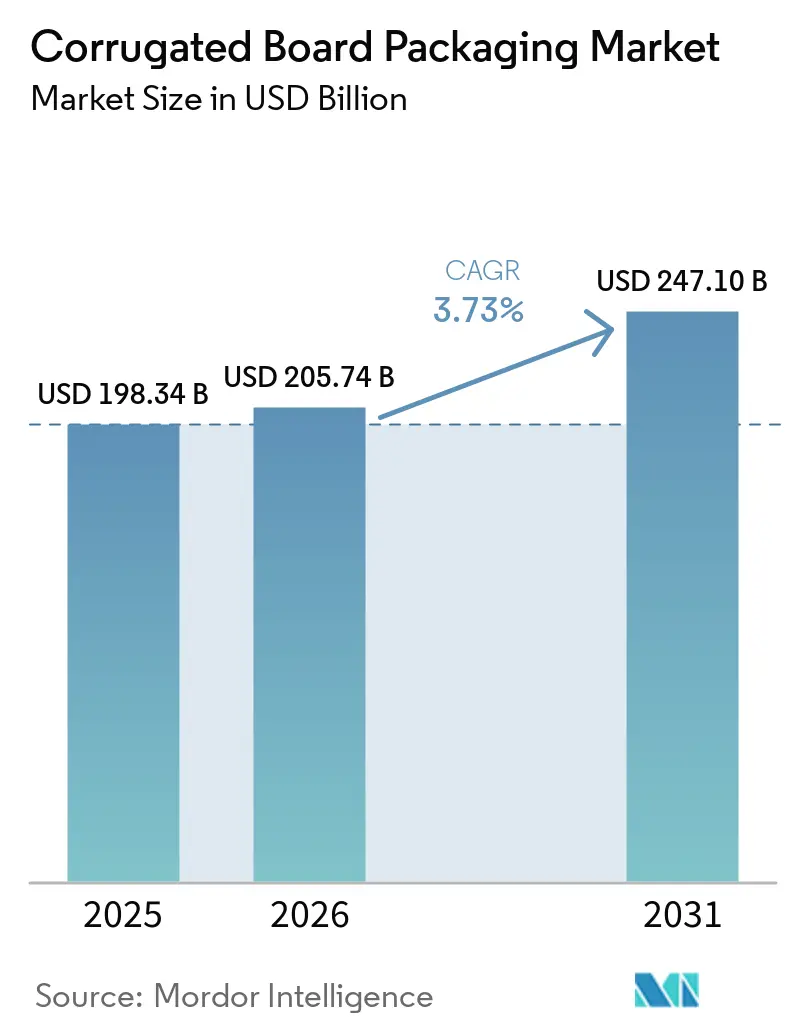
The Corrugated Board Packaging Market size in 2026 is estimated at USD 205.74 billion, growing from 2025 value of USD 198.34 billion with 2031 projections showing USD 247.1 billion, growing at 3.73% CAGR over 2026-2031.
The measured expansion reflects policy-driven substitution of plastics, fast-growing e-commerce volumes, and rapid adoption of digital and AI manufacturing tools. Regulatory pressure, led by the European Union’s Packaging and Packaging Waste Regulation and five U.S. state Extended Producer Responsibility laws, is accelerating fiber demand as brand owners pivot toward readily recyclable formats. Supply-side tightness—caused by volatile old-corrugated-cardboard (OCC) prices and energy costs—supports pricing discipline, while downstream technology such as hybrid digital-flexo presses unlocks mass customization opportunities. Competitive advantage is shifting toward vertically integrated producers able to secure raw fiber, invest in energy-efficient mills, and deploy AI-enabled box-design optimization.
Key Report Takeaways
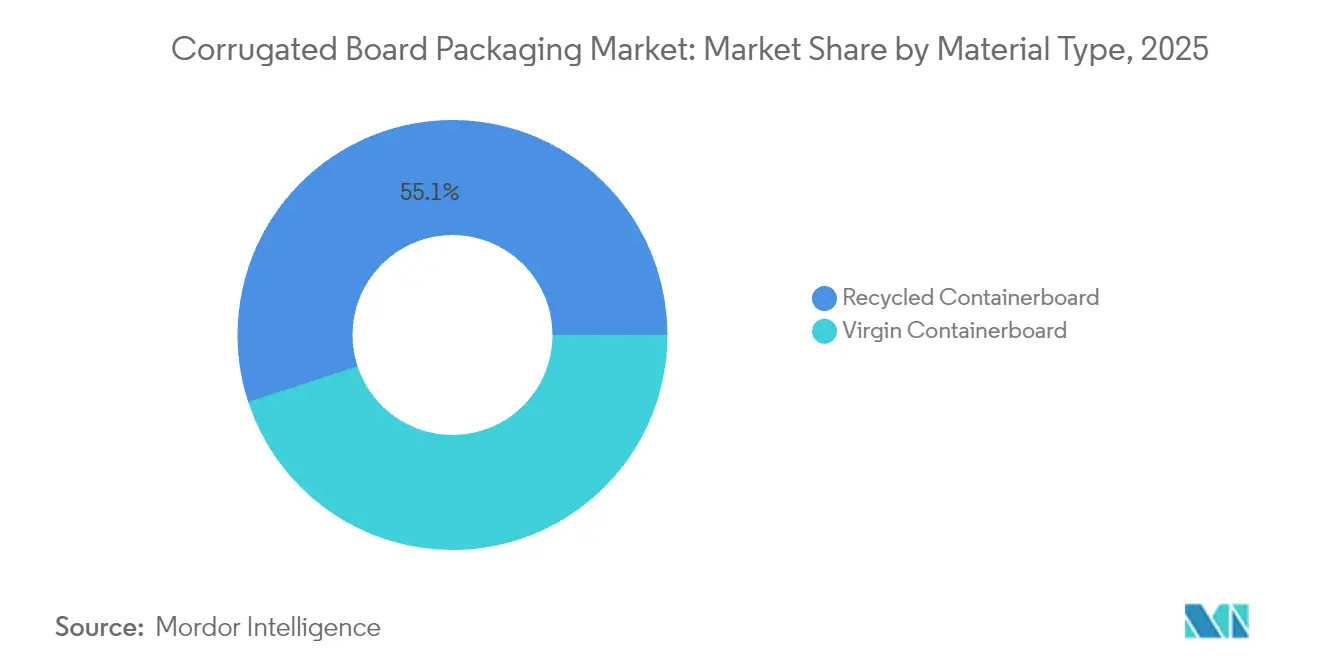
- By material type, recycled containerboard captured 55.05% of the corrugated board packaging market share in 2025; agricultural-waste fiber grades are expected to expand at a 6.54% CAGR to 2031.
- By box style, traditional slotted boxes held 32.05% share in 2025, whereas folder boxes are poised for 5.48% CAGR as e-commerce specifications evolve.
- By end-user industry, food applications dominated with 30.92% share of the corrugated board packaging market size in 2025, while e-commerce fulfillment is forecast to rise at an 8.12% CAGR to 2031.
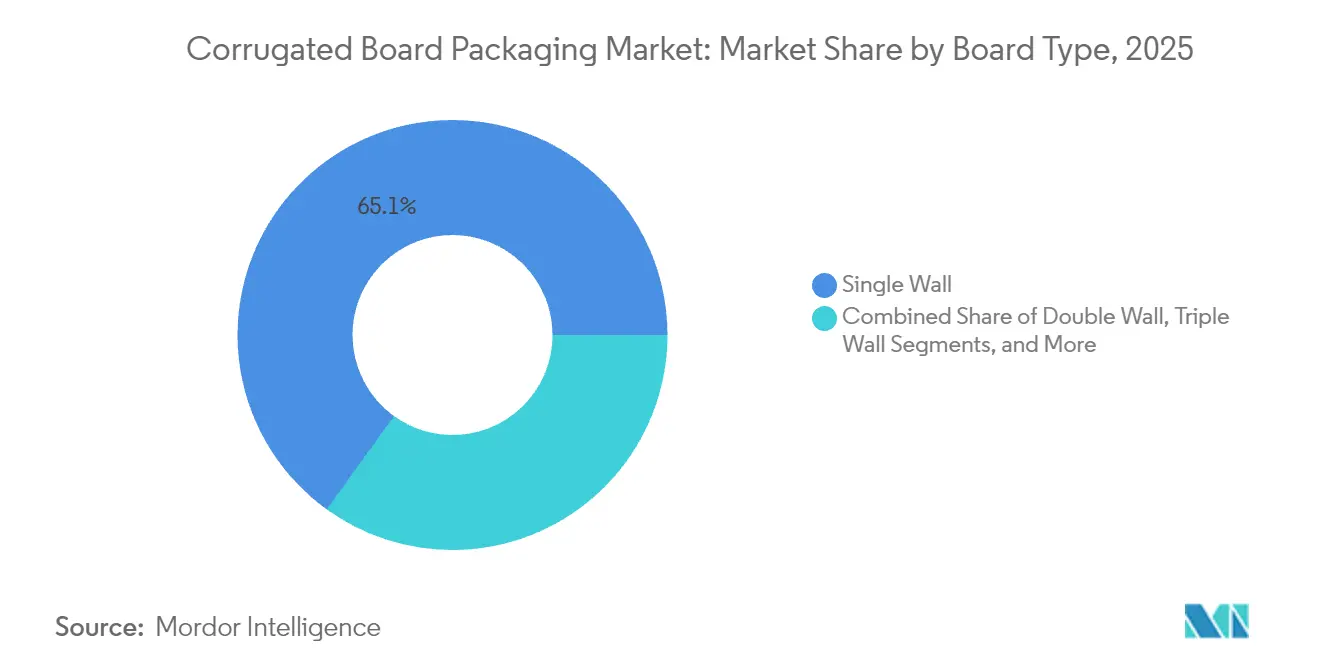
- By board type, single-wall formats accounted for 65.05% share in 2025; double-wall boards are projected to post a 5.93% CAGR through 2031.
- By printing technology, flexography retained 58.10% share in 2025, but digital presses are advancing at a 5.12% CAGR on the back of short-run customization demand.
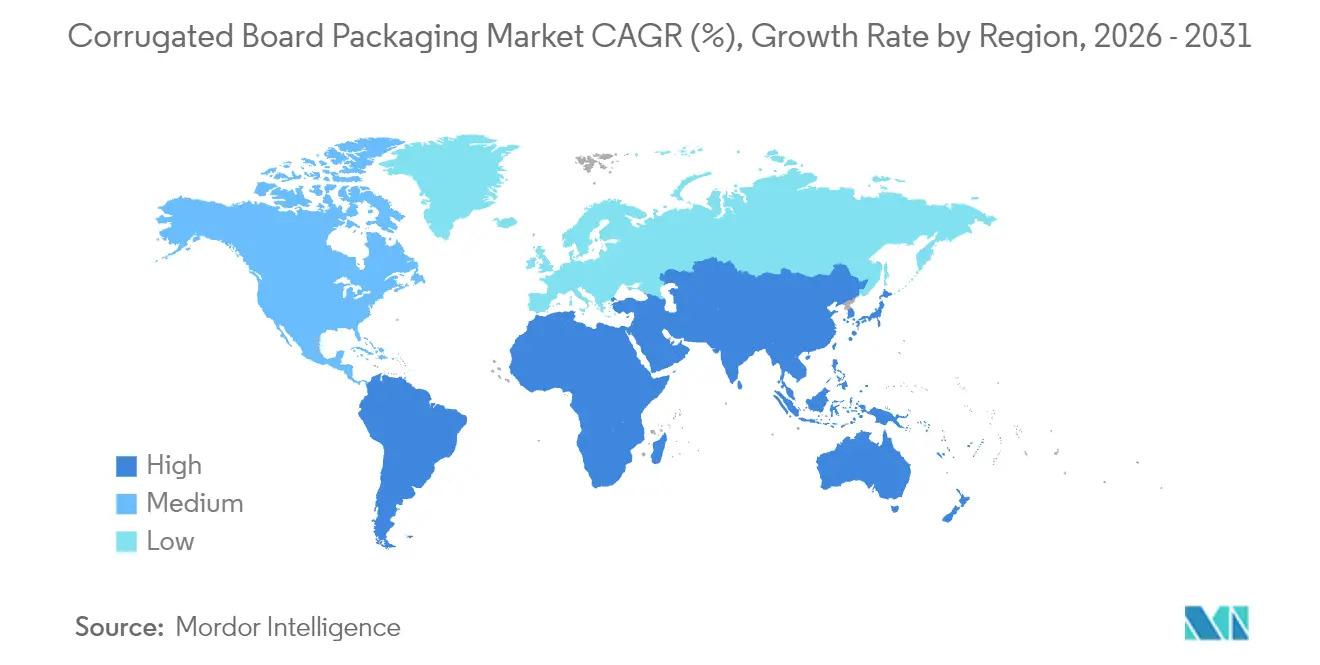
- By geography, Asia-Pacific led with 39.85% revenue share of the corrugated board packaging market in 2025, while South America is projected to register the fastest 7.05% CAGR through 2031.
Note: Market size and forecast figures in this report are generated using Mordor Intelligence’s proprietary estimation framework, updated with the latest available data and insights as of 2026.
Market Trends and Insights
Drivers Impact Analysis of Corrugated Board Packaging Market*
| Driver | (~) % Impact on CAGR Forecast | Geographic Relevance | Impact Timeline |
|---|---|---|---|
| Eco-friendly material mandates | +1.2% | Global, with EU and North America leading | Medium term (2-4 years) |
| E-commerce parcel explosion | +1.8% | Global, with Asia-Pacific and North America core | Short term (≤ 2 years) |
| Advances in digital and flexo hybrid presses | +0.8% | North America and EU, spill-over to Asia-Pacific | Medium term (2-4 years) |
| Light-weight containerboard economics | +0.6% | Global manufacturing regions | Long term (≥ 4 years) |
| AI-driven box-design optimisation | +0.4% | Asia-Pacific core, spill-over to North America | Medium term (2-4 years) |
| Agricultural-waste fibre pulping | +0.5% | Global, with early gains in Europe and Asia | Long term (≥ 4 years) |
| Source: Mordor Intelligence | |||


Eco-friendly material mandates drive fiber substitution
New recyclability rules are tilting packaging material choices toward fiber. The EU requirement that all packaging be recyclable by 2030, alongside minimum recycled-content quotas for plastics, has made corrugated the low-risk compliance option. [1]European Parliament, “Packaging and packaging waste,” europarl.europa.eu Five U.S. states impose fee scales that reward recyclable substrates, creating cost advantages of up to 15% versus plastic formats. [2]International Paper, “The Landscape of U.S. State EPR Packaging Laws,” internationalpaper.com Brands are accelerating specification changes because plastic recycling infrastructure lag times exceed the 2030 deadline. Corrugated’s 71-76% recovery rate simplifies audit trails, supports corporate ESG pledges, and limits penalty exposure. Mill operators report order lead-times for fiber-based SKUs shortening by two weeks as converters re-tool lines to meet retailer scorecard requirements.
E-commerce parcel explosion reshapes packaging specifications
Global e-commerce shipping volumes grew from 220 billion parcels in 2024 to a projected 340 billion by 2029, elevating functional priorities such as drop-test durability and dimensional-weight efficiency. Double-wall and micro-flute boards now constitute over one-quarter of parcels shipped via major integrators. Equipment suppliers respond with on-demand boxmaking systems that trim labor by 40% while reducing void-fill needs, thereby cutting per-order materials cost by 15%. Subscription-commerce operators are specifying printable interiors for brand storytelling, which further boosts the loading of digitally printed graphics inside the shipping container. These shifts cement corrugated’s role as both a transport medium and a marketing surface.
Advances in digital and flexo hybrid presses enable mass customization
Hybrid lines that combine CMYK digital engines with high-speed flexo stations cut changeover times to under five minutes and allow run-lengths of 100 boxes without cost penalties. Ink suppliers have introduced water-based formulations compliant with food-contact regulations, enabling direct plate-to-box printing for grocery customers. Converters gain the agility to service promotional campaigns and seasonal SKUs with zero inventory of pre-printed sheets. Wider adoption is expected as capex per hybrid line falls below USD 4 million, 30% lower than in 2023. Integration of AI color-management suites maintains delta-E tolerances under 2.0, ensuring graphic consistency across plants.
AI-driven box-design optimisation reduces material consumption
Machine-learning algorithms simulate compression performance across flute patterns and stacking heights, allowing converters to shave 8-10% board weight without compromising edge-crush strength. Vision systems spot score-line defects at speeds of 250 m min-1, curbing scrap rates. Predictive maintenance modules cut unplanned downtime by 12% and extend corrugator roll life. Early adopters report annual savings exceeding USD 3 million on medium-sized production footprints while improving recycling compatibility due to reduced mixed-material laminations.
Restraints Impact Analysis of Corrugated Board Packaging Market*
| Restraint | (~) % Impact on CAGR Forecast | Geographic Relevance | Impact Timeline |
|---|---|---|---|
| Reusable plastics and RPCs adoption | -0.8% | North America and EU, with retail sector focus | Short term (≤ 2 years) |
| Volatile OCC and energy prices | -1.1% | Global manufacturing regions | Short term (≤ 2 years) |
| Corrugator electricity-intensity caps | -0.3% | EU and regulated markets | Medium term (2-4 years) |
| Industrial-water withdrawal limits at mills | -0.4% | Water-stressed regions globally | Long term (≥ 4 years) |
| Source: Mordor Intelligence | |||
Reusable plastics and RPCs adoption challenges single-use demand
Retailers expand returnable-plastic-container (RPC) pools for produce and meat because they cut shrinkage and reduce labor at the store level. France, Germany, and South Korea have introduced reuse quotas or deposit schemes that favor durable crates over single-use corrugated. Automated wash-back networks lower per-trip RPC cost below USD 0.25 when cycle counts exceed 25, undercutting single-use units for predictable fresh-food supply chains. Corrugated converts defend share using high-barrier moisture-resistant coatings and tamper-evident locking tabs, but face margin squeeze in high-turnover channels.
Volatile OCC and energy prices compress manufacturing margins
OCC prices rose USD 7.10 per ton y-o-y in January 2025 amid tightening recovered-paper supply linked to logistics chokepoints and competing demand from Asian mills. [3]Editorial Team, “Old Corrugated Cardboard Market increases $0.40 USD/TON,” RecycleNet, recyclenet.com Spot electricity prices in Europe exceeded EUR 150 MWh during winter 2024–25, inflating corrugator operating costs by up to USD 28 per short ton. Mills is unable to pass through surcharges, reporting EBITDA margin contraction of 180 basis points. Larger integrated groups counter volatility through captive power projects and fiber procurement hedges, widening the cost gap over stand-alone sheet feeders.
*Our forecasts treat driver/restraint impacts as directional, not additive. The impact forecasts reflect baseline growth, mix effects, and variable interactions.
Corrugated Board Packaging Market Segment Analysis
By Material Type:
Recycled fiber retains the lead but agri-waste trials accelerateRecycled grades commanded 55.05% of the corrugated board packaging market share in 2025, buoyed by mature collection networks and favorable EPR fee structures. The segment is forecast to grow at 4.56% CAGR as brand owners raise post-consumer-content thresholds. Virgin Kraft liner retains relevance for heavy-duty export cartons, but its volume share continues to erode. Wheat-straw, rice-husk, and tomato-stem pulps are entering commercial pilots; laboratory work shows tensile strength gains of up to 25% over conventional recycled pulp. Investment in regional decentralized pulping units is crucial to control raw-material moisture and logistics costs. Successful scale-up would temper OCC price cycles and diversify fiber sourcing, strengthening supply-chain resilience.
Agricultural-waste pulps also deliver environmental gains, trimming carbon intensity by 20-25% relative to virgin wood fiber because they bypass forest-harvesting steps. Early adopters in Italy and India are integrating agri-waste at 15-20% blend ratios without modifying corrugator settings. Though certification frameworks for food-contact compliance remain nascent, producers expect regulatory alignment by 2027. These innovations signal that the corrugated board packaging market will shift from a binary virgin-versus-recycled narrative to a broader multi-fiber portfolio, reinforcing its adaptability to regional resource constraints.


By Box Style/Construction:
Folder boxes outpace slotted standardsTraditional regular slotted containers (RSCs) held a 32.05% share in 2025, but folder-type formats are projected to increase at a 5.48% CAGR through 2031, propelled by e-commerce brand owners seeking quick-assembly designs that enhance the unboxing experience. Automated erecting equipment processes folder styles at 35 boxes min-1, 40% faster than manual RSC lines, saving fulfillment centers significant labor. In the corrugated board packaging market size context, this shift translates into incremental revenue of USD 8.9 billion between 2026 and 2031.
Slotted boxes retain cost advantages where cube efficiency and palletization are paramount, such as industrial spare parts distribution. Telescope and rigid-set boxes occupy premium niches, including luxury electronics, where visual aesthetics and crush prevention outweigh material cost. Digital print-ready folder constructions increasingly integrate tear-strips and returnable seals, aligning with omnichannel logistics flows. The evolving construction landscape illustrates how performance criteria, automation capability, and consumer engagement jointly influence specification trends within the corrugated board packaging market.
By End-User Industry:
E-commerce narrows the gap with food leadershipFood packaging represented 30.92% of the corrugated board packaging market size in 2025, underpinned by moisture-resistant coatings that satisfy FDA contact norms and maintain produce freshness, while demand for corrugated beverage carrier board is rising with the expansion of multipack beverage formats. Growth stabilizes at 3.12% CAGR as mature grocery channels plateau. Conversely, e-commerce and fulfillment applications are forecast to expand at 8.12% CAGR, adding USD 13.4 billion in incremental value by 2031. Subscription kits, direct-to-consumer fashion, and same-day electronics deliveries all demand right-sized, protective, and brandable boxes.
Healthcare shipments require serialization windows and tamper-evident tapes, with stringent validation driving premium price points. Industrial users are pivoting from wooden crates to triple-wall corrugated alternatives, attracted by 30% weight savings that lower freight costs. These dynamics confirm that end-use diversification reinforces structural growth opportunities for the corrugated board packaging market.
By Board Type:
Double wall captures share through performance economicsSingle-wall sheets remained dominant at 65.05% share in 2025, yet double-wall options are set to grow at 5.93% CAGR as parcel services tighten drop-test standards. Incorporating BC or EB flute combinations boosts edge-crush strength by up to 45% while preserving printable surfaces. The corrugated board packaging market size for double-wall constructions is predicted to exceed USD 79.6 billion by 2031.
Triple-wall grades compete with plywood for heavy industrial motors and batteries. Meanwhile, micro-flute variants encroach on folding-carton territory, offering superior rig stiffness and e-commerce-friendly graphics. Producers investing in quick-flute-change corrugators can switch from B to E flute in under 10 minutes, tailoring board profiles to order mix and minimizing work-in-process inventory. Such flexibility cements corrugated’s role as a multifunctional substrate.
By Printing Technology:
Digital accelerates amid flexo dominanceFlexography maintained 58.10% share in 2025 because of its unmatched throughput on long runs. Even so, digital presses are slated for a 5.12% CAGR through 2031, raising their revenue contribution to 15.10% of the corrugated board packaging market. Lower ink-coverage costs, on-the-fly artwork changes, and reduced plate inventories underpin this shift.
Hybrid press installations grew 22% in 2024, blending flexo base colors with digital variable data to serve personalized marketing campaigns. Food-contact compliant digital inks clear regulatory hurdles and open new growth in frozen and chilled segments. Screen and litho remain niche for metallic finishes and ultra-high-resolution photographic work, respectively. Together, these technology choices reflect an industry migrating from mass production toward mass customization at scale.
Geography Analysis
APAC Corrugated Board Packaging Market
Asia-Pacific accounted for 39.85% of global corrugated board packaging market revenue in 2025 and continues to leverage manufacturing integration and cost-effective fiber sourcing. Nine Dragons Paper expanded annual capacity to 25.37 million tonnes, underpinning the region’s supply dominance. China’s stimulus measures stimulate domestic consumption, yet export-oriented plants in Vietnam and Malaysia now serve Belt-and-Road trade corridors. Investment in waste-paper-import quotas also encourages local agri-waste pulping pilots, mitigating OCC dependency.
South America Corrugated Board Packaging Market
South America represents the fastest-growing corridor, with a 7.05% CAGR projected to 2031. Brazil’s containerboard shipments increased despite macro headwinds as producers realigned mills for export markets. Klabin’s new Paraná facility exemplifies forward-capacity bets, while Chilean and Colombian converters invest in folder-gluer automation to meet e-commerce box styles. Fiber self-sufficiency, anchored in abundant sugar-cane bagasse and eucalyptus plantations, positions the region as a future agri-waste supply hub.
North America and Europe Corrugated Board Packaging Market
North America and Europe exhibit steady mid-single-digit growth anchored in regulatory compliance and value-added innovation. The EU recyclability mandate that took effect in 2025 has already shifted 6% of plastic transit-packaging volume into corrugated. International Paper’s USD 7.2 billion buyout of DS Smith extends its sustainable-packaging footprint across both continents and is expected to unlock USD 600-700 million in synergy by 2027. European mill upgrades prioritize energy conservation, with Stora Enso’s Oulu line claiming 20% lower greenhouse-gas intensity than legacy paper machines. In the United States, digital press penetration exceeds 18% of installed corrugated print capacity, accelerating mass customization in consumer packaged goods.

Regulatory Landscape
Regulation is accelerating fiber-based packaging adoption while tightening performance and reporting requirements for corrugated packs. In the European Union, the Packaging and Packaging Waste Regulation (PPWR), Regulation (EU) 2025/40, enters into application on 12 August 2026, replacing Directive 94/62/EC and introducing measures that influence corrugated specification choices, including recyclability grading and eco-modulated Extended Producer Responsibility (EPR) fees. The PPWR also includes a void-space constraint (a maximum empty-space threshold), which pushes brand owners and fulfillment networks toward right-sized corrugated designs and packaging optimization tooling.
Food-contact compliance continues to shape liner and additive selection for corrugated used in food and fresh produce supply chains. In the United States, paper and paperboard used for food packaging are governed under FDA food-contact provisions in 21 CFR Parts 174-186, including 21 CFR 176.180 for components that contact dry foods. Alongside EU action, EPR frameworks continue to expand at sub-national levels in North America, increasing compliance workloads around producer definitions, labeling, and fee reporting that vary by jurisdiction and affect how converters and brand owners structure contracts and packaging documentation.
Competitive Landscape
The corrugated board packaging market features fragmentation. International Paper’s acquisition of DS Smith and Smurfit WestRock’s formation elevated combined capacity, yet regional champions such as Nine Dragons and Lee & Man preserve share through captive fiber loops and lower delivered-cost positions. Vertical integration across pulp, paper, and converting lines shields large players from OCC volatility and positions them to comply with tightening emission rules at lower marginal cost.
Technology adoption has become a differentiator more than scale alone. Smurfit WestRock’s 100% recyclable paper pallet wrap replaces polyethylene stretch film and cuts customer scope-3 emissions, illustrating how product innovation feeds premium-price segments. Midland Paper Packaging leverages AI-guided optical inspection to reduce trim waste, illustrating competitive gains for mid-tier converters agile enough to pilot new tools. Agricultural-waste fiber processing still favors nimble regional mills, although international groups have started strategic joint ventures to secure supply.
Price competition remains rational because energy and fiber shortages favor value-added contracts with pass-through clauses. Brand owners increasingly award multi-year agreements based on recyclability metrics and carbon-footprint dashboards, raising the bar for participants lacking in-house LCA capabilities. M&A activity is expected to continue as producers seek geographic diversification and technology portfolios that de-risk compliance exposures.
Corrugated Board Packaging Industry Leaders
International Paper Company
Mondi Group
Smurfit WestRock
Sealed Air Corporation
Nine Dragons Paper (Holdings) Limited
- *Disclaimer: Major Players sorted in no particular order
Corrugated Board Packaging Market Companies Covered in this Report
- International Paper Company
- Smurfit WestRock
- Mondi Group
- Nine Dragons Paper (Holdings) Limited
- Georgia-Pacific LLC
- Oji Holdings Corporation
- Stora Enso Oyj
- Sealed Air Corporation
- Pratt Industries
- Rengo Co., Ltd.
- Packaging Corporation of America
- Lee & Man Paper Manufacturing
- Klabin S.A.
- Cascades Inc.
- SCG Packaging
- Saica Group
- Orora Limited
- Visy Industries
- Grupo Gondi
- Astron Paper & Board Mill
- APP (Sinar Mas)
- Napco National

Market Opportunities and Future Outlook
Compliance-driven redesign and automation upgrades are creating spending around right-sizing, higher-performance board profiles, and digitally managed plant operations. With the EU PPWR void-space requirement entering into application on 12 August 2026, the case for on-demand sizing, box-design optimization, and micro-flute capability strengthens for e-commerce and omnichannel distribution, where dimensional efficiency and damage reduction are purchase criteria. This directs opportunity to converters and equipment providers that can pair automated finishing, fast changeovers, and data-driven quality control, while supporting brand owners in documenting recyclability and materials compliance across multi-country supply chains.
Activity in 2026 also points to where capacity and capability investments are concentrating. International Paper announced a USD 225 million, 468,000-square-foot sustainable packaging facility in Brandon, Mississippi, with operations targeted for Q4 2027, aiming to add a modern footprint aligned to corrugated packaging demand and network optimization. On the converting side, DS Smith disclosed an investment of up to 100 million Danish kroner to install a new rotary die-cutting line at its Grenaa, Denmark facility, expected to add about 15 million square meters of annual capacity and support higher-throughput, value-added box formats. Automation and integrated folding-gluing lines, including Bobst Expertfold 165, also highlight whitespace in labor-constrained markets, where converters are working to stabilize quality amid material variability and shorten lead times for customized and retail-ready corrugated packs.
Recent Industry Developments in Corrugated Board Packaging Market
- June 2026: International Paper completed the USD 360 million acquisition of North Pacific Paper Company (NORPAC). The deal strengthens system flexibility and adds capability tied to lightweight, high-performance paper grades that feed corrugated packaging demand, particularly for West Coast customers. It also supports vertical integration strategies aimed at reducing exposure to fiber and energy volatility.
- May 2026: International Paper broke ground on a new 468,000-square-foot sustainable packaging facility in Rankin County, Mississippi, backing the project with a USD 225 million investment and targeting start-up in Q4 2027. The site expands modern corrugated packaging capacity and supports network optimization as brand owners accelerate substitution away from less recyclable formats. A newer plant layout also enables more automation and throughput-efficient operations versus legacy converting footprints.
- March 2025: International Paper finalized the USD 7.2 billion purchase of DS Smith, expanding its sustainable packaging platform across a broad international operating base. The combination increases scale in containerboard and corrugated converting while enhancing access to European customers facing tightening packaging compliance requirements. It also raises competitive pressure on regional converters as large groups leverage integrated supply and multinational customer contracts.


Corrugated Board Packaging Market Report Scope and Research Methodology
Market Definition and Coverage
This market covers revenue earned from corrugated board packaging products sold for protecting, shipping, and shelving goods, where the pack structure uses fluted paper between linerboards and is converted into usable formats.
Scope exclusions: We exclude molded pulp, solid paperboard cartons, flexible paper packaging, and plastic returnable transit packaging that do not use corrugated board construction.
Segments Covered in This Report
- By Material Type
- Virgin Containerboard
- Recycled Containerboard
- By Box Style / Construction
- Slotted Boxes
- Telescope Boxes
- Rigid Boxes
- Folder Boxes
- By End-User Industry
- Food
- Processed Foods
- Fresh Food and Produce
- Beverages
- Personal and Household Care
- E-commerce and Fulfilment
- Healthcare and Pharmaceuticals
- Electrical and Electronics
- Industrial
- Other End-user Industry
- Food
- By Board Type
- Single Wall
- Double Wall
- Triple Wall
- Micro-flute
- By Printing Technology
- Flexography
- Digital
- Lithography
- Screen
- By Geography
- North America
- United States
- Canada
- Mexico
- Europe
- Germany
- United Kingdom
- France
- Italy
- Spain
- Netherlands
- Russia
- Rest of Europe
- Asia-Pacific
- China
- Japan
- India
- South Korea
- Australia
- Singapore
- Rest of Asia-Pacific
- Middle East and Africa
- Middle East
- Saudi Arabia
- United Arab Emirates
- Turkey
- Rest of Middle East
- Africa
- South Africa
- Nigeria
- Egypt
- Rest of Africa
- Middle East
- South America
- Brazil
- Argentina
- Rest of South America
- North America
Data Sources, Market Sizing, and Validation
Desk Research
Desk research started by mapping the supply chain from containerboard production through converting, printing, and distribution, so the model stays tied to what is actually sold. We used public sources such as UN Comtrade trade statistics, World Bank macro indicators, OECD industry and price series, EPA packaging and recycling releases, and FAO forestry and pulp and paper datasets to anchor demand signals and fiber availability.
To translate these inputs into market math, we also reviewed company annual reports, investor presentations, and packaging association publications to understand mix shifts and the most common conversion formats. We used supporting checks from patent databases to track activity in coatings, printing, and lightweighting, and from a paid subscription focused on company financials and news to verify revenues and capacity announcements. These examples are not exhaustive, and many other public and internal reference sources were used for data collection, cross-checking, and clarification.
Primary Interviews and Surveys
Primary work focused on validating what portion of containerboard flows into corrugated packaging and how pricing moves through converting and printing. We spoke with converters, paper producers, distributors, and large packaging buyers across APAC, EMEA, and the Americas, so assumptions on board grades, box mix, and end-use demand could be corrected where secondary data stayed broad.
Distribution of primary research fieldwork respondents
| Company type | Respondent position | Region |
|---|---|---|
| Top tier: 32% | CXOs: 14% | APAC: 49% |
| Mid tier: 52% | Functional/Unit leaders: 36% | EMEA: 30% |
| Smaller Players: 16% | Managers: 50% | Americas: 21% |
Market-Sizing & Forecasting
Sizing used a top-down build where containerboard production and trade data were used to reconstruct the corrugated packaging demand pool by region, and then split using conversion intensity and end market activity. To keep the totals realistic, we also ran selective bottom-up checks using sampled converter revenue ranges, typical price per ton movements, and volume proxies for high-use applications such as e-commerce fulfillment and processed food shipments.
Key inputs that shaped the model included containerboard output and recovered paper availability, recycled versus virgin mix, average conversion yields and trim loss, pricing spread between liner and medium, and macro indicators linked to packed goods movements (industrial production and retail trade). Forecasts were developed using scenario analysis, where base case growth was adjusted using expert views on lightweighting, recycling targets, and regional manufacturing shifts. When bottom-up signals were missing for smaller markets, gaps were handled through proxy ratios from comparable economies and then re-checked through follow-up calls.
Data Validation & Update Cycle
Validation was done by comparing modeled revenue with independent signals such as tonnage trends, price indices, and reported utilization changes, then checking whether shifts were consistent across regions. Outliers were flagged, assumptions were revisited, and the logic was reviewed in more than one analyst pass before sign-off.
The report is refreshed annually, and interim updates are triggered when material events occur, such as major capacity additions, fiber price shocks, or policy changes affecting recycled content. Before delivery, a final review is completed so the latest macro releases and company updates are reflected in the numbers clients see.
Mordor Intelligence's Corrugated Board Packaging Market Estimate Compared With Other Published Estimates
Published market numbers for corrugated board packaging can look far apart because the category sits close to containerboard, paperboard cartons, and wider packaging totals, and those lines are not drawn the same way by every publisher. Differences also show up when one study reports manufacturer level revenue while another uses wholesale values, or when the base year and currency timing are not aligned.
The main gap comes from whether corrugated board material sales are counted as packaging revenue, where Mordor Intelligence counts corrugated board packaging only when it is converted into packaging formats, rather than treating all containerboard turnover as part of the market.
Benchmark comparison
| Source | Market Size | Gaps in Research Methodology |
|---|---|---|
| Mordor Intelligence | USD 205.74 B (2026) | |
| Industry Research Publisher A | USD 265.70 B (2024) | Uses a wider corrugated packaging scope and mixes years and figures on the same page, which suggests adjacent categories and different value points may be blended into one total. |
| Materials Outlook B | USD 180.50 B (2025) | Covers corrugated board as a material market, which can undercount packaging conversion value and printing, and it may follow tonnage-linked pricing rather than converted packaging revenue. |
Looking across the three figures, the spread is explained mostly by scope choice and what stage of the value chain is priced, not by a disagreement on the direction of demand. By tying the total to containerboard flow, conversion intensity, and realistic price progression checks, we keep the estimate traceable to inputs that can be re-tested year to year.


Key Questions Answered in the Report
How large is the corrugated board packaging market in 2026?
It is valued at USD 205.74 billion and is forecast to reach USD 247.1 billion by 2031 at a 3.73% CAGR.
Which region leads global corrugated board packaging revenues?
Asia-Pacific holds the largest share at 39.85%, supported by substantial containerboard capacity and e-commerce logistics growth.
What is driving double-wall board adoption?
Rising parcel-drop durability standards and automated warehouse handling needs are boosting double-wall demand, which is projected to grow at 5.93% CAGR.
How are regulations influencing material choices?
EU and U.S. recyclability mandates raise compliance costs for plastics, prompting brand owners to shift toward fiber-based corrugated formats.
Which printing technology is growing fastest?
Digital and hybrid presses are expanding at 5.12% CAGR because they enable cost-effective short runs and mass customization for online retail.
Page last updated on:


 Your data is secure and never sold or shared.


