
Vietnam Floriculture Market Analysis by Mordor Intelligence
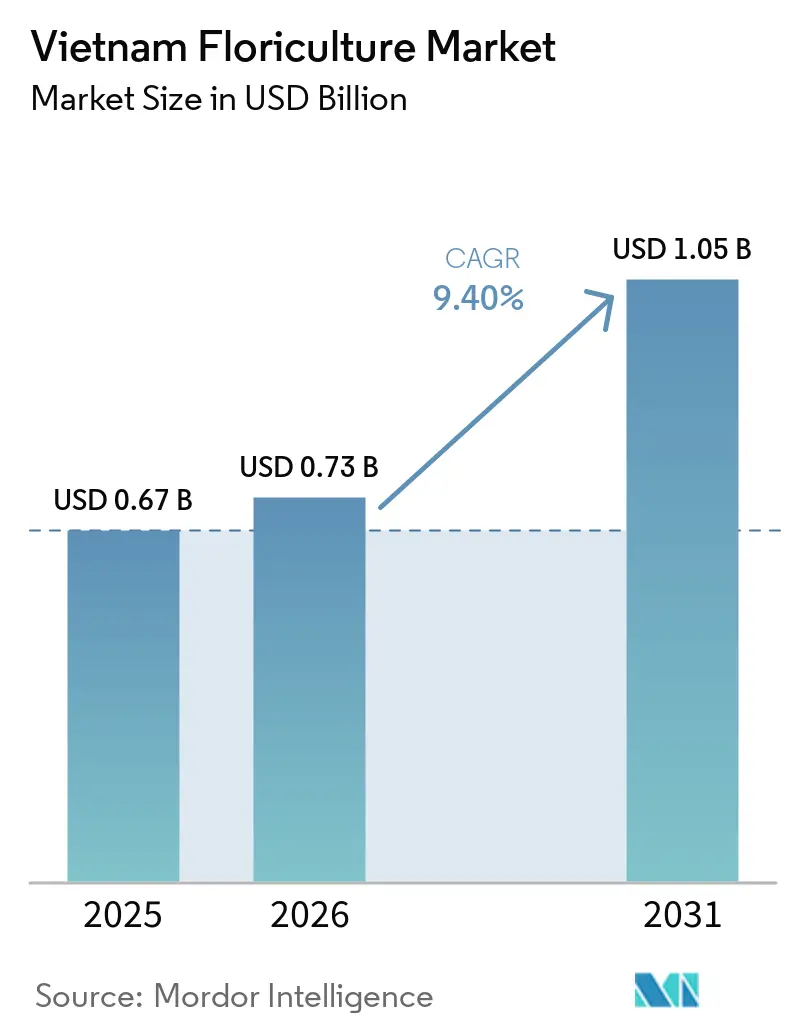
The Vietnam floriculture market size is anticipated to increase from USD 0.67 billion in 2025 to USD 0.74 billion in 2026 and reach USD 1.05 billion by 2031, growing at a CAGR of 9.4% over 2026-2031. Favorable climatic diversity across the country enables continuous production of temperate roses, carnations, and chrysanthemums in the Central Highlands while sustaining tropical orchids in lowland deltas, reducing the need for costly year-round climate control and underpinning a steady domestic supply. Bilateral free-trade agreements with Japan and Korea have removed tariffs on cut flowers, widening export margins by 8–12 percentage points and elevating Vietnam from a subsistence grower to a top-tier regional supplier. Rapid cold-chain expansion, especially in the Dalat- Ho Chi Minh City corridor, equipped with 2–8 °C trucks, has lowered post-harvest losses from 22% to 4% and extended rose shelf life to 9 days. With 20% of capital costs subsidized, Lam Dong province expanded its high-tech greenhouses to 5,600 hectares, achieving annual yields of VND 2 billion (USD 81,300) per hectare and bolstering Vietnam's floral exports to East Asia.
Key Report Takeaways
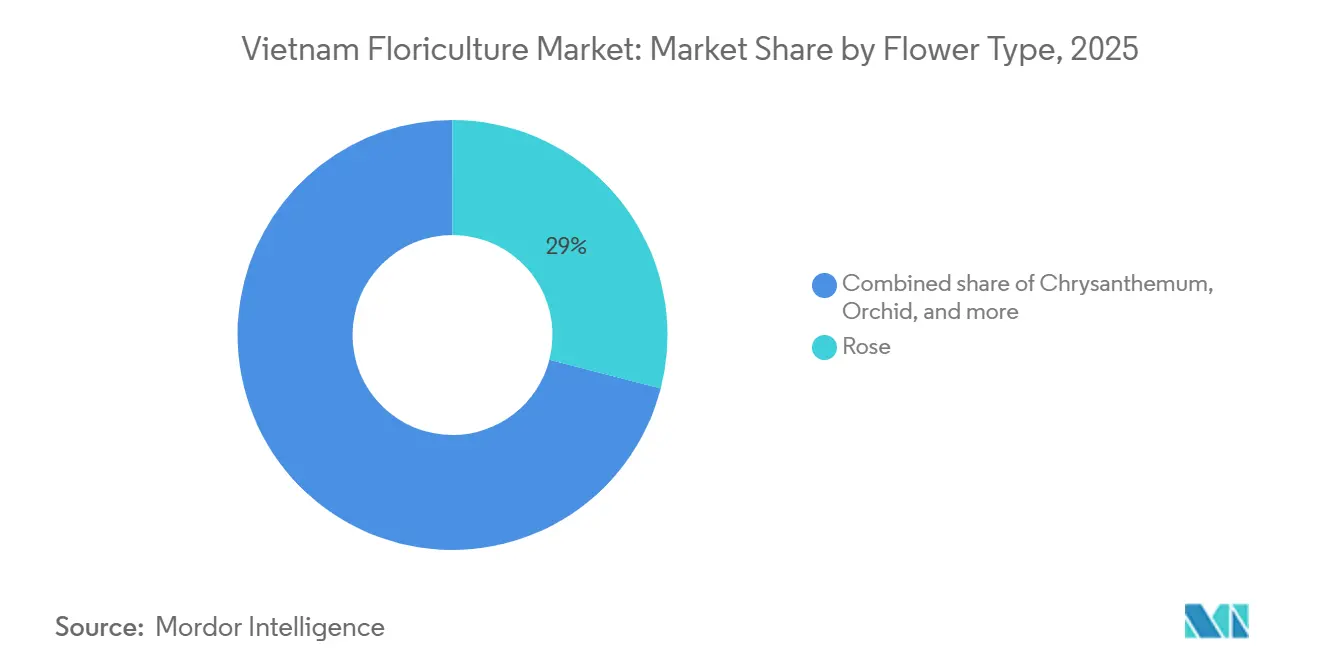
- By flower type, rose commanded a 29% share of the Vietnam floriculture market size in 2025, while orchid is forecast to record a 10.6% CAGR between 2026-2031.
Note: Market size and forecast figures in this report are generated using Mordor Intelligence’s proprietary estimation framework, updated with the latest available data and insights as of 2026.
Vietnam Floriculture Market Trends and Insights
Drivers Impact Analysis*
| Driver | (~) % Impact on CAGR Forecast | Geographic Relevance | Impact Timeline |
|---|---|---|---|
| Favorable climatic diversity along Vietnam’s latitude | +2.1% | Central Highlands and Northern mountain zones | Long term (≥ 4 years) |
| Growing bilateral flower-trade agreements | +1.8% | Nationwide, with an export focus in the Central Highlands and Southeast | Medium term (2-4 years) |
| Expansion of cold-chain logistics corridors | +1.5% | Dalat-Ho Chi Minh City and Mekong Delta corridors | Medium term (2-4 years) |
| Government subsidies for greenhouse modernization | +1.3% | Central Highlands and Red River Delta | Short term (≤ 2 years) |
| Pilot carbon-credit pricing for sustainable floriculture | +0.9% | Central Highlands and Southeast | Long term (≥ 4 years) |
| Bundled micro-finance for smallholder ornamental growers | +1.2% | Mekong Delta and South Central Coast | Medium term (2-4 years) |
| Source: Mordor Intelligence | |||
Favorable Climatic Diversity Along Vietnam’s Latitude
Vietnam stretches from 8°N to 23°N, creating cool highland microclimates suited to premium temperate flowers and warm lowland zones ideal for orchids. Lam Dong’s 1,500-meter elevation delivers stable 18-22 °C temperatures that meet optimal rose requirements and save growers 30-40% in heating and cooling costs compared with single-climate markets[1]Source: Lam Dong Meteorological Station, “Lam Dong Climate Data 2024-2025,” lamdong.nchmf.gov.vn. By utilizing 0% tariffs under the CPTPP, Vietnam increased its share of Japan's flower imports to over 14% in 2025, effectively replacing higher-cost suppliers from Kenya and Ecuador due to its logistical advantages and duty-free access. Hanoi’s Red River Delta now hosts 3,000 hectares of high-tech flower farms that exploit four-season conditions to supply chrysanthemums to China within 48 hours. Staggered planting across altitudes supports non-stop harvesting, lowering inventory costs by 18% and improving exporter cash cycles. Widespread climatic flexibility positions the Vietnam floriculture market as a consistent supplier when seasonal shortages constrain competitors.
Growing Bilateral Flower-Trade Agreements
The Japan-Vietnam Economic Partnership Agreement and the Korea-Vietnam Free Trade Agreement eliminated tariffs on cut flowers, shrinking landed costs for Vietnamese stems by up to 12 percentage points[2]Source: Korea Customs Service, “Korea Flower Import Statistics 2023,” customs.go.kr . In 2023, Vietnam became South Korea's largest flower supplier by volume accounting for 3.45 thousand metric tons and the second largest by value accounting for USD 13.5 million, with orchids and chrysanthemums accounting for 68% of shipments to meet ceremonial and retail demand. Duty-free access also propelled Japan-bound sales to USD 45 million in 2021, and Vietnam added 2.3 percentage points of Japanese market share in 2024 by guaranteeing 7-day delivery versus 12-day South American transits. Vietnamese floriculture is utilizing duty-free access under the The Comprehensive and Progressive Agreement for Trans-Pacific Partnership (CPTPP) and The Regional Comprehensive Economic Partnership (RCEP) agreements to target Australia as a high-value market. Premium tropical orchids are positioned to command significantly higher prices compared to regional markets, supported by a broader bilateral trade relationship valued at USD 14.1 billion. In 2025, Vietnam's Plant Protection Department (PPD) will implement streamlined e-Phyto protocols, enabling perishable goods to clear borders within 24 hours. This aims to cut rejection rates below 2% and reduce spoilage, boosting exporter margins.
Expansion of Cold-Chain Logistics Corridors
In 2025, upgrading the Dalat-Tan Son Nhat route to 2–8°C refrigerated logistics extended rose shelf life to 9 days and cut transit spoilage from 22% to under 5%, boosting Vietnam's export competitiveness. In late 2025 and early 2026, DHL and FedEx expanded logistics operations at Tan Son Nhat International Airport. DHL Group increased its Container Freight Station (CFS) capacity to 6,800 m² to accelerate the consolidation of temperature-sensitive and high-value exports to Japan and Korea. To become a 'Flower City' by 2026, Dong Thap has set up a centralized cold storage in Sa Dec, aiming to cut logistics costs by 12% and reduce post-harvest waste for flower and ornamental plant exporters. Eight relay stations along the Mekong Delta- Ho Chi Minh City artery now maintain unbroken cool chains, cutting chrysanthemum spoilage from 18% to 6%. Internet-of-Things sensors across 376 hectares of Lam Dong greenhouses issue real-time alerts within 15 minutes, preventing USD 2.8 million of annual rejected shipments.
Government Subsidies for Greenhouse Modernization
Under the 2021–2025 High-Tech Agriculture Project, Vietnam allocated VND 20 billion (USD 770.12 million) in Hai Duong for greenhouse construction and introduced a VND 750 trillion (USD 28.8 billion) green credit pool with 2% interest subsidies to shorten payback periods for investors[3]Source: Vietnam Ministry of Agriculture and Rural Development, “National Floriculture Development Strategy 2024-2030,” mard.gov.vn. By Q1 2024, Lam Dong had developed 5,600 hectares of advanced floral structures, generating up to VND 2 billion (USD 77.01 thousand) per hectare annually with 40% less water than traditional methods. High-tech Phalaenopsis orchid farms in Hai Phong, using Israeli-designed automated greenhouse systems, require up to VND 40 billion (USD 1.54 million) per hectare and deliver returns far exceeding traditional agriculture in the Red River Delta. The subsidy prioritizes 10-hectare cooperatives, channeling 68% of disbursements into Central Highlands and Mekong Delta sites where scale maximizes paybacks. Upgraded greenhouses reduce pesticide use by 30% and strengthen compliance with Global Good Agriculture Practices (GlobalGAP) requirements, which are critical for export entry.
Restraints Impact Analysis*
| Restraint | (~) % Impact on CAGR Forecast | Geographic Relevance | Impact Timeline |
|---|---|---|---|
| High upfront drip-irrigation retrofit costs | -1.4% | Nationwide, acute in Mekong Delta and South Central Coast | Medium term (2-4 years) |
| Rising incidence of pest infestations | -1.1% | Central Highlands and Red River Delta | Short term (≤ 2 years) |
| Lack of pathogen-free tissue-culture labs outside Lam Dong | -0.8% | Mekong Delta, Northern highlands, South Central Coast | Long term (≥ 4 years) |
| Increasing coastal water-salinity from upstream dams | -0.7% | Mekong Delta and South Central Coast | Long term (≥ 4 years) |
| Source: Mordor Intelligence | |||
High Upfront Drip-Irrigation Retrofit Costs
Professional drip and fertigation systems require an initial investment of USD 18,000 per hectare. Lam Dong’s high-value floral exporters recover these costs within three years, but long-term payback periods challenge smallholders reliant on volatile wholesale vegetable markets. High-tech irrigation can halve water use, but with a low agricultural tariff of VND 1,200 (USD 0.046) per unit, annual savings of USD 195–341 make 9% commercial interest rates viable only with yield-driven revenue gains and a 2% government interest-rate subsidy. Smallholders in Vietnam, averaging 0.8 hectares, often lack collateral for traditional loans, extending payback periods to 8 years without the 2026 government's 'Green Credit' subsidies. High-tech irrigation in Lam Dong covers over 23,900 hectares in the vegetable sector, while the floriculture sector is expanding through the USD 120 million 'Smart Flower Village' initiative. The Vietnamese government offers a 20% subsidy, reducing the cost of high-tech irrigation to USD 14,400. However, nine-month bureaucratic delays limit participation to 15% of eligible farms, leaving much of the market without financial support.
Rising Incidence of Pest Infestations
Tuta absoluta remains the most destructive pest of tomatoes in Lam Dong, with the potential for complete yield loss. As of 2025, no significant host shift to carnations has been observed. Floral producers focus on managing thrips and mites to meet export standards for Japan and South Korea. The higher rate of insecticide spraying per month raises pesticide outlays to a significant share of total costs, and risking residue rejections in Japan and Korea. In the Me Linh rose-growing district, 95% of households face challenges from resistant thrips and spider mites. Chemical application rates here have reached 28.6 kg of active ingredient per hectare, nearly five times the 5.6 kg/ha standard in the Netherlands, where biological controls are prevalent. Monoculture rose belts on the Lang Biang Plateau are facing severe whitefly infestations, exceeding the economic threshold by 20 times. Provincial authorities are supporting high-tech farming models to stabilize incomes and improve pest resilience. Vietnam mitigates the risk of invasive species such as Drosophila suzukii through 9 Regional Plant Quarantine Sub-departments and 40 border stations, supporting 61 provincial sub-departments in protecting its vast agricultural landscape.
*Our forecasts treat driver/restraint impacts as directional, not additive. The impact forecasts reflect baseline growth, mix effects, and variable interactions.
Segment Analysis
By Flower Type: Export-Oriented Orchids Overtake Traditional Staples
Rose maintained the highest 29% consumption share of the Vietnam floriculture market size in 2025, while orchid registered to be the fastest-growing segment, projected to register a 10.6% CAGR through 2031. Using in vitro tissue culture to reduce disease risks, Lam Dong expanded orchid cultivation to 100 hectares by 2025, producing 16 million pots annually and solidifying its position in the Northeast Asian export market. High-tech Phalaenopsis orchid farms in Hai Phong, using Israeli-designed automated greenhouse systems, generate VND 80 billion (USD 3.25 million) per hectare annually, tripling the revenue from rose harvests and making them the city's top floral export. Premium export pricing in Japan and Australia, where orchids sell 40-60% above roses, underlies the rising adoption by growers.
High-tech production in highland areas like Lang Biang generates VND 1–3 billion (USD 38-115 million) per hectare annually, meeting peak demand during Tet and Valentine’s Day. Chrysanthemums hold a prominent share, supported by year-round supply from Sa Dec to China and Taiwan. Lily hectares in Khanh Hoa climbed to 180 by 2025 and deliver 38-42% gross margins, displacing disease-stricken carnations. IoT irrigation on 376 hectares curbed water use 30-50%, raising net margins for orchid and lily growers by up to nine points.



Geography Analysis
The Central Highlands led Vietnam's floriculture market share in 2025, owing to significant production of billions of stems and growing exports, while the Mekong River Delta is forecast to expand rapidly at a CAGR over 2026-2031. With 5,600 hectares of advanced greenhouses, Lam Dong's floral industry uses a 4-hour cold-chain corridor to Tan Son Nhat Airport, ensuring freshness for exports to Japan and South Korea. The region’s dominance is reinforced by Dalat Hasfarm’s 340-hectare hub, which dispatches 150 million stems annually. Dak Lak supports 1,800 hectares of orchids and foliage geared to Chinese and Taiwanese landscapers.
The Southeast region, anchored by Ho Chi Minh City and Binh Duong, accounts for 18% of value through its wholesale markets, which move 2 million stems daily during peak weeks. The Red River Delta holds 3,000 hectares of chrysanthemums and lilies for quick export to China. South Central Coast provinces such as Khanh Hoa grow lilies and carnations across 180 hectares that mature 8-10 days sooner than Central Highlands crops. Each zone leverages distinct climate niches and transport pathways to segment supply.
Regional expansion hinges on the build-out of the cold chain and access to financing. New Mekong cold stores, micro-finance, and water-saving lilies are anticipated to lift that region’s share by three points by 2031. Central Highlands growth will rely on carbon-credit income and Global Good Agriculture Practices (GlobalGAP) certification to capture European Union (EU) orders. Salinity-affected delta districts may shift into salt-tolerant ornamentals pending reservoir completion. Together, these regional dynamics will shape future gains in Vietnam's floriculture market size.
Regulatory Landscape
Vietnam’s floriculture sector operates under the Ministry of Agriculture and Rural Development (MARD) framework for crop production, plant protection, and quarantine, anchored by the Law on Plant Protection and Quarantine for phytosanitary control of domestic movement and cross-border trade. In May 2024, MARD consolidated procedures for phytosanitary certification and plant quarantine for import, export, and transit via Circular 19/VBHN-BNNPTNT, tightening documentation, inspection, and border-clearance requirements that affect perishable cut-flower shipments.
Market access and varietal commercialization are also shaped by technical and input regulations. National Technical Regulations (QCVN) require DUS testing for new flower varieties, including standards for chrysanthemums (QCVN 01-89:2012), gerberas (QCVN 01-90:2012), roses (QCVN 01-95:2012), and lilies (QCVN 01-86:2012), which acts as a compliance gate for expanding proprietary genetics. In May 2025, Circular 03/2025/TT-BNNMT amended Circular 25/2024/TT-BNNPTNT to update permitted and banned plant protection products, while April 2026 included an SPS notification (G/SPS/N/VNM/180) on a draft circular for plant quarantine inspection procedures, pointing to continued refinement of quarantine processes that matter for fast-moving floriculture exports.
Value Chain Analysis
Vietnam’s floriculture value chain starts with planting material (seedlings, bulbs, tissue culture), greenhouse and irrigation systems, fertilizers, and crop protection inputs, and then concentrates production in hubs such as Da Lat, Hanoi, Ho Chi Minh City, Dong Thap, and other specialized growing areas. The shift from open-field cultivation toward high-tech horticulture (greenhouses, climate control, and advanced irrigation) is improving yields and consistency, but it also increases reliance on capex, skilled labor, and access to disease-free propagation, making tissue-culture capability and nursery quality meaningful upstream differentiators.
Downstream, grading, packing, and cold-chain handling largely determine shelf life and export acceptance, with air gateways and consolidation facilities around Ho Chi Minh City and Tan Son Nhat International Airport supporting time-sensitive shipments to Northeast Asia. Export turnover surpassing USD 100 million by May 2025 underscores the growing role of regulated trade channels and phytosanitary compliance in the chain, while distribution continues through wholesale markets, modern retail, and expanding e-commerce for domestic demand. Sector coordination also comes through institutions such as MARD and associations, including the Vietnam Ornamental Creature Association, which joined AIPH in March 2026, supporting standards alignment and connectivity initiatives that affect how growers, cooperatives, logistics providers, and exporters integrate across the value chain.
Competitive Landscape
Dalat Hasfarm, Dutch Flower Group, Langbiang Farm, Dümmen Orange, and Fresh Flower World complete the top five players list with a combined majority share of the Vietnam floriculture market in 2025 leveraging proprietary genetics and vertically integrated logistics that shave 12-15% off landed costs. In December 2025, Hasfarm Holdings acquired the Lynch Group for USD 270 million, establishing a vertically integrated floriculture platform in the Asia-Pacific. This strengthened cold-chain capabilities, ensuring year-round supply for retail markets in Australia, China, and Japan. Dutch Flower Group introduces high-royalty cultivars that earn 20-25% price premiums, locking in supermarket buyers seeking novelty blooms.
Both deploy Internet of Things (IoT)-enabled greenhouses that deliver 18% input savings and a consistent 60-centimeter stem length demanded by Japanese wholesalers. Langbiang’s 7-hectare greenhouse, in partnership with Netherlands-based Rijk Zwaan, is trialing 12 climate-adapted eustoma lines, improving yields by 20%. Dummen Orange supplies 8 million disease-indexed plantlets yearly while its 500-kilowatt solar array lowers energy costs by 60%. Fresh Flower World focuses on domestic ecommerce, offering next-day delivery to 35 cities and boosting urban demand.
Future competition will revolve around carbon-credit monetization, organic certification, and native species breeding. Early adopters of solar-thermal heating and biogas digesters already achieve 2-4% EBITDA uplift under the 2025 pilot. Organic floriculture now accounts for less than 2% of output, signaling white-space potential as European Union (EU) retailers expand pesticide-free aisles. Native Curcuma varieties face no import competition but require investment in breeding to meet export standards. Companies that integrate genetics, finance, and climate-smart tech will consolidate gains as the Vietnam floriculture market grows.
Market Opportunities and Future Outlook
The most immediate opportunity is scaling high-tech cultivation and formalizing the sector to unlock land, credit, and tax facilitation linked to national programs. Under Decision 4081/QD-BNN-TT, Vietnam targets 15-20% of flower production area using high-tech applications by 2030, which creates room for greenhouse builders, irrigation and climate-control providers, and professional propagation (tissue culture) to supply cooperatives and commercial farms. The sector’s footprint (nearly 45,000 hectares as of 2024) and production value (over VND 45 trillion) also support investment in specialized zones around established hubs such as Da Lat, Hanoi, and Dong Thap, where clustering improves input access, workforce availability, and post-harvest handling.
Export-led opportunities are reinforced by market-opening actions and compliance upgrades across quarantine and quality systems. Official flower export turnover surpassing USD 100 million provides a baseline for product-market expansion, including lilies and foliage categories where phytosanitary eligibility can open new destinations and strengthen the case for tighter traceability and cold-chain discipline. Industry initiatives cited by MARD leadership in May 2025, including national brand building and development of a nationwide trading floor network, also create practical space for digital platforms that standardize grades, improve pricing transparency, and aggregate orders, while helping smallholders connect to formal buyers and logistics services without requiring full vertical integration.
Recent Industry Developments
- June 2026: The People’s Committee of Cho Lach, together with ViGen Biotechnology Co., Ltd. and the Farmers’ Association, launched a tissue-culture pilot for 20,000 chrysanthemum plants aimed at the 2027 Tet market. The project improves local access to disease-managed planting material and supports more uniform quality for commercial channels beyond traditional village production.
- October 2025: Vinh Long Province announced an investment of over VND 230 billion to upgrade infrastructure supporting flowers and ornamental plants, including salinity control and water regulation. The program is designed to improve production stability in the Mekong Delta, where water stress and salinity intrusion affect planting cycles and post-harvest quality.
- January 2025: Global Investment Development High Technology JSC increased orchid production capacity to 8 million plants per year using imported advanced seedling propagation technology. Higher local availability of uniform orchid planting material supports scale-up of high-value ornamental segments and reduces supply risk linked to external seedling sources.


Research Methodology Framework and Report Scope
Market Definition and Coverage
For this study, the market is defined as the value of floriculture output and trade-linked supply in Vietnam, covering cultivation and sale of key flower and ornamental plant products that are supplied through domestic channels or cross-border flows.
Scope exclusions: We exclude downstream event-management services, retail gifting add-ons, and non-plant decor items that do not reflect flower and planting-material value.
Segmentation Overview
- By Flower Type
- Rose
- Production Analysis
- Production Volume
- Area Harvested and Yield
- Consumption Analysis (Value and Volume)
- Trade Analysis (Value and Volume)
- Import Market Analysis
- Import Value and Volume
- Key Supplying Markets
- Export Market Analysis
- Export Value and Volume
- Key Destinations Markets
- Import Market Analysis
- Wholesale Price Trend Analysis and Forecast
- Seasonality Analysis
- Production Analysis
- Chrysanthemum
- Production Analysis
- Production Volume
- Area Harvested and Yield
- Consumption Analysis (Value and Volume)
- Trade Analysis (Value and Volume)
- Import Market Analysis
- Import Value and Volume
- Key Supplying Markets
- Export Market Analysis
- Export Value and Volume
- Key Destinations Markets
- Import Market Analysis
- Wholesale Price Trend Analysis and Forecast
- Seasonality Analysis
- Production Analysis
- Orchid
- Production Analysis
- Production Volume
- Area Harvested and Yield
- Consumption Analysis (Value and Volume)
- Trade Analysis (Value and Volume)
- Import Market Analysis
- Import Value and Volume
- Key Supplying Markets
- Export Market Analysis
- Export Value and Volume
- Key Destinations Markets
- Import Market Analysis
- Wholesale Price Trend Analysis and Forecast
- Seasonality Analysis
- Production Analysis
- Carnation
- Production Analysis
- Production Volume
- Area Harvested and Yield
- Consumption Analysis (Value and Volume)
- Trade Analysis (Value and Volume)
- Import Market Analysis
- Import Value and Volume
- Key Supplying Markets
- Export Market Analysis
- Export Value and Volume
- Key Destinations Markets
- Import Market Analysis
- Wholesale Price Trend Analysis and Forecast
- Seasonality Analysis
- Production Analysis
- Lily
- Production Analysis
- Production Volume
- Area Harvested and Yield
- Consumption Analysis (Value and Volume)
- Trade Analysis (Value and Volume)
- Import Market Analysis
- Import Value and Volume
- Key Supplying Markets
- Export Market Analysis
- Export Value and Volume
- Key Destinations Markets
- Import Market Analysis
- Wholesale Price Trend Analysis and Forecast
- Seasonality Analysis
- Production Analysis
- Rose
Data Sources, Market Sizing, and Validation
Desk Research
Desk research was used to set the base structure of the model and to make sure definitions and units stayed consistent across sources. We referred to public agriculture statistics and releases, such as Vietnam government agriculture publications, customs trade statistics, and provincial agriculture updates that signal where production is concentrated.
To sanity-check direction and seasonality, we also reviewed sources such as FAOSTAT-style crop and horticulture series, trade association notes, academic papers on ornamental horticulture, and reputed press coverage on price spikes around key holidays. Company websites, annual reports, and investor presentations were used to understand farm expansion, greenhouse adoption, and distribution patterns. Where needed, we used a paid subscription for company financials and for shipment-level import and export context to validate trade values and timing. These examples are illustrative, and many other public sources were also used for data collection, validation, and clarification.
Primary Interviews and Surveys
Primary work was carried out through expert interviews and structured surveys across growers, wholesalers, importers, exporters, and large buyers such as organized retailers and hospitality-linked purchasers. Since this is a Vietnam-specific market, the discussions were focused on major producing and consuming centers, and then used to confirm pricing behavior, wastage, and the split between domestic sales and traded volumes. We also used follow-ups to close gaps where official data is delayed or where product mixes shift quickly (for example, between traditional flowers and higher-value varieties).
Distribution of primary research fieldwork respondents
| Company type | Respondent position |
|---|---|
| Top tier: 32% | CXOs: 13% |
| Mid tier: 53% | Functional/Unit leaders: 35% |
| Smaller Players: 15% | Managers: 52% |
Market-Sizing & Forecasting
Sizing started with a top-down build where production and trade data were reconstructed into a value pool for Vietnam, and then translated into market value using observed wholesale price movements and product-mix shares. The model was then corroborated using selective bottom-up checks like sampled price per stem or bunch multiplied by estimated volumes at key wholesale markets, and channel checks on how much is sold through traditional trade versus organized retail.
A few inputs carried most weight in the model, including cultivated area and output signals, import and export values and volumes, wholesale price trend direction, holiday-driven demand peaks (such as Tet and wedding seasons), and spoilage and handling losses that affect saleable volumes. When bottom-up checkpoints were incomplete for some flower types or provinces, the gaps were handled through conservative share allocations that were validated in primary discussions.
For forecasting, scenario analysis was used so changes in greenhouse adoption, logistics quality, and price progression could be tested without forcing one aggressive path. Assumptions on price growth and traded volumes were aligned to what interviewees described as realistic, and then applied consistently across the forecast years.
Data Validation & Update Cycle
Validation was done through repeated cross-checks between value outputs and independent signals like trade statistics direction, production capacity commentary, and observable price trends. Any large variance by flower type or year was reviewed by the analyst, and follow-up calls were triggered when the implied price or volume movement did not match market feedback.
Before sign-off, the model and assumptions go through a multi-step review so units, conversions, and year mapping are consistent. The report is refreshed annually, and interim updates are made when material events occur, such as sharp currency movement, major policy changes, or unusual price shocks. Right before delivery, a fresh pass is completed so clients receive the most current view available.
Mordor Intelligence's Vietnam Floriculture Market Size Compared With Other Published Estimates
Published market values for Vietnam floriculture can look different across sources because the refresh timing, currency conversion month, and price build-up logic are not the same. Even when the same country is covered, the underlying treatment of wholesale pricing versus retail pricing, and whether trade flows are blended into the same value pool, can move the final number.
Key gap drivers here typically come from how average selling prices are progressed year to year, how import and export values are netted or grossed into domestic value, and how quickly assumptions are re-checked when prices move around holiday seasons. The refresh-led variance is especially visible when a model is updated on a different cut-off month for exchange rates and when older wholesale price benchmarks are carried forward without revalidation, which is why the 2025 sizing was re-checked close to publication and then converted using consistent currency timing in Mordor Intelligence.
Benchmark comparison
| Source | Market Size | Gaps in Research Methodology |
|---|---|---|
| Mordor Intelligence | USD 0.67 B (2025) | |
| Global Consultancy A | USD 0.58 B (2025) | Uses a narrower value pool that leans more on producer-side value and applies a simplified price progression, which can understate years with wholesale price lifts and higher-value variety mix. |
| Industry Publisher B | USD 0.59 B (2024) | Different base year and refresh cut-off, with a separate forecast window that can carry earlier exchange-rate timing and may not fully align trade value treatment with the domestic consumption value build. |
Across the three figures, the spread is mainly explained by timing and by what price layer is used to convert volumes into value. By keeping currency timing consistent, re-checking wholesale price movements, and aligning trade and domestic signals into one reproducible value build, the estimate stays traceable to clear inputs that can be reviewed and repeated.


Key Questions Answered in the Report
What is the projected value of the Vietnam floriculture market in 2031?
The market is forecast to reach USD 1.05 billion by 2031.
Which flower type is growing fastest in Vietnam?
Orchids are anticipated to post a 10.6% CAGR between 2026 and 2031.
Why are cold-chain corridors important for Vietnamese flowers?
They cut post-harvest spoilage from 22% to 4% and extended rose shelf life to 9 days, enabling profitable exports.
How concentrated is competition among Vietnamese floriculture firms?
The five largest companies together hold the majority of revenue, indicating moderate concentration.
Page last updated on:


 Your data is secure and never sold or shared.


