United States Floriculture Market Analysis by Mordor Intelligence
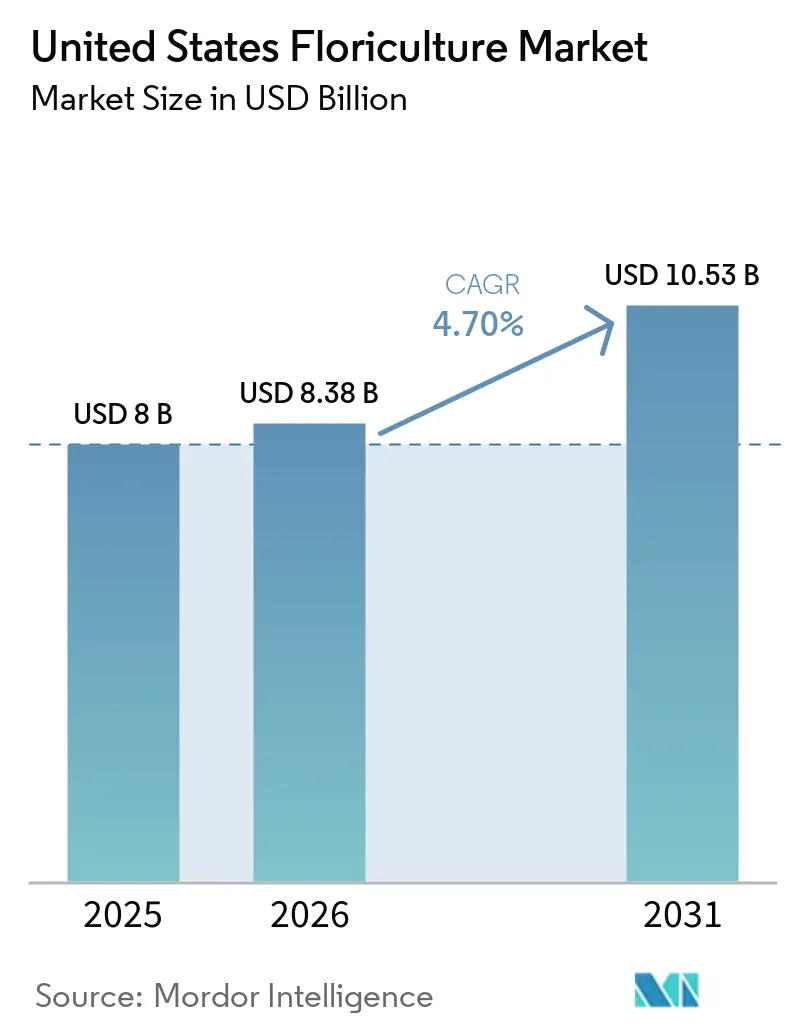
The United States floriculture market size is projected to expand from USD 8.0 billion in 2025 and USD 8.38 billion in 2026 to USD 10.53 billion by 2031, registering a CAGR of 4.70% from 2026 to 2031. This growth is driven by consistent consumer spending across gifting, home décor, and commercial biophilic applications, ensuring demand remains diverse rather than concentrated on a single use case. According to the Floriculture Program of the United States Department of Agriculture's National Agricultural Statistics Service (NASS), domestic production remains significant, with 11,262 grower operations and 969 million square feet of covered production area reported in 2024. Despite this, the market relies heavily on imported cut flowers, which influence pricing, freight costs, and production strategies throughout the value chain. Factors such as greenhouse investments, subscription-based purchasing models, and increasing wellness-driven plant buying are expanding the demand base beyond traditional holiday peaks and one-time events. Federal support for specialty crops, procurement by the hospitality and workplace sectors, and a growing preference for locally differentiated premium cultivars benefit domestic growers. However, challenges such as tariffs, rising labor costs, and water restrictions continue to impact profit margins in the United States floriculture market.
Key Report Takeaways
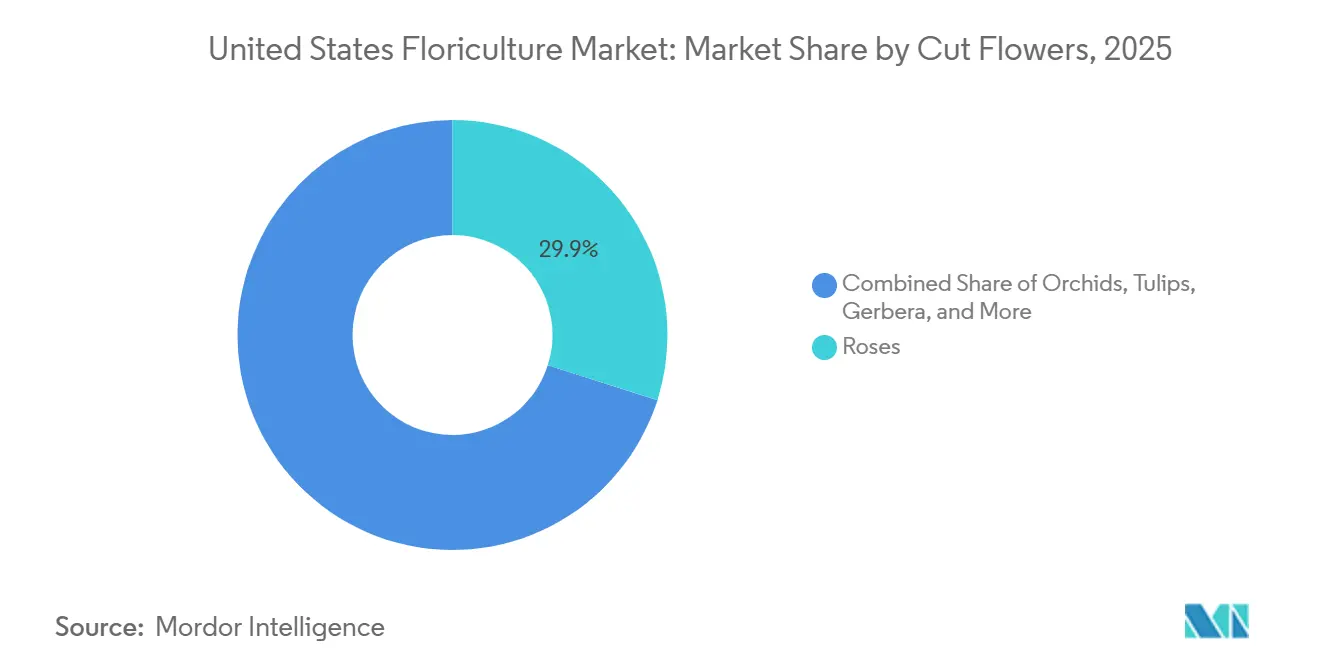
- By cut flower type, roses led with the largest 29.9% of the United States floriculture market share in 2025. The United States floriculture market size for the orchids segment is projected to grow at the fastest 4.9% CAGR from 2026 to 2031.
Note: Market size and forecast figures in this report are generated using Mordor Intelligence’s proprietary estimation framework, updated with the latest available data and insights as of 2026.
United States Floriculture Market Trends and Insights
Drivers Impact Analysis*
| Driver | (~) % Impact on CAGR Forecast | Geographic Relevance | Impact Timeline |
|---|---|---|---|
| Climate-controlled greenhouse technology adoption | +1.0% | California, Florida, Michigan, and North Carolina | Medium term (2-4 years) |
| E-commerce and subscription floral purchasing expansion | +0.8% | National, strongest in New York, Los Angeles, and Chicago metro areas | Short term (≤ 2 years) |
| Home gardening and indoor-plant wellness demand | +0.7% | National, strongest in suburban markets across the South and Midwest | Short term (≤ 2 years) |
| Hospitality and workplace biophilic demand | +0.5% | National, concentrated in New York, San Francisco, and Miami | Medium term (2-4 years) |
| Specialty crop support for greenhouse cash recovery | +0.6% | National, largest allocations in California, Florida, and Washington | Medium term (2-4 years) |
| Retail demand for local and longer-vase-life cultivars | +0.4% | National, led by West Coast and Northeast retail channels | Long term (≥ 4 years) |
| Source: Mordor Intelligence | |||
Climate-Controlled Greenhouse Technology Adoption
Climate-controlled greenhouses are transforming supply dynamics in the United States floriculture market. According to the United States Department of Agriculture, the covered floriculture production area reached 969 million square feet in 2024, marking a 13.8% increase compared to the previous year [1]Source: United States Department of Agriculture National Agricultural Statistics Service, “Floriculture Crops 2024 Summary,” USDA.gov. Protected cultivation enables growers to precisely manage light, temperature, and humidity, reducing seasonality and minimizing crop loss. This is particularly significant for crops like lilies, chrysanthemums, and orchids, where consistent year-round availability enhances the competitiveness of domestic growers against imported supply. As advancements in automation, sensors, and energy controls improve project feasibility, capacity expansions are extending beyond California to states such as Michigan, North Carolina, and Virginia.
E-commerce and Subscription Floral Purchasing Expansion
E-commerce and subscription ordering have transformed the purchasing patterns of consumers in the United States floriculture market. Digital purchasing has reduced reliance on a few holiday peaks, as consumers can now schedule recurring deliveries for homes, gifts, and workplaces. Subscription programs provide growers and wholesalers with more stable volume commitments, aiding in greenhouse output planning and arrangement programs. This stability minimizes procurement fluctuations and facilitates improved assortment planning throughout the supply chain. Additionally, younger consumers increasingly view floral purchases as part of everyday wellness and home living, contributing to higher purchase frequency over time.
Home Gardening and Indoor-Plant Wellness Demand
Home gardening and indoor plant care continue to drive demand in the United States floriculture market. According to Monrovia’s 2025 gardening attitudes research, published by Greenhouse Grower, an increasing number of homeowners view gardening as a means of relaxation and emotional well-being. This underscores the growing connection between plant purchases and wellness-focused lifestyles. Additionally, younger households are demonstrating heightened interest in specialty plant varieties, locally sourced options, and premium indoor plants, prioritizing these factors over purely price-driven decisions. This shift is redirecting floriculture spending toward consistent household and hobby-related demand, enabling growers to achieve steadier year-round sales beyond the traditional event-driven floral purchasing cycles.
Hospitality and Workplace Biophilic Demand
Commercial purchases from hotels and workplaces contribute significantly to the demand within the United States floriculture market. Fresh floral arrangements, foliage installations, and preserved elements are increasingly associated with enhancing guest experiences and improving employee environments, rather than serving solely as decorative items. According to research conducted by the University of Minnesota Landscape Arboretum, biophilic environments have been shown to increase productivity by 6% and improve well-being scores by 15%, providing a practical incentive for buyers to sustain these programs [2]Source: University of Minnesota Arboretum, “Biophilic Design in the Workplace Improves Creativity, Wellbeing, and Productivity,” Arb.umn.edu. Contract purchasing from these commercial clients offers more predictable demand compared to holiday-driven retail sales, helping suppliers mitigate seasonal revenue fluctuations. This creates a consistent market for floral and foliage programs in major gateway cities and densely populated commercial areas.
Restraints Impact Analysis*
| Restraint | (~) % Impact on CAGR Forecast | Geographic Relevance | Impact Timeline |
|---|---|---|---|
| Labor cost inflation and skilled labor scarcity | -1.2% | National, strongest in California, Florida, and North Carolina | Short term (≤ 2 years) |
| Import competition and air-freight volatility | -0.9% | National, highest exposure in Miami and Los Angeles import corridors | Medium term (2-4 years) |
| Water-use restrictions and climate volatility | -0.7% | California Central Valley, South Coast, and Pacific Northwest | Long term (≥ 4 years) |
| Phytosanitary compliance and pest-management costs | -0.5% | National, highest importer exposure at Miami International Airport | Short term (≤ 2 years) |
| Source: Mordor Intelligence | |||
Labor Cost Inflation and Skilled Labor Scarcity
Labor inflation and the scarcity of skilled labor are significant operational challenges in the United States floriculture market. The H-2A Adverse Effect Wage Rate (AEWR) reached USD 19.97 per hour in California and USD 16.23 per hour in Florida in 2025. Data from the 2024 Census of Horticultural Specialties indicates that labor accounted for 36% of total horticulture expenses, making it the largest cost category [3]Source: United States Department of Agriculture National Agricultural Statistics Service, “Census of Horticultural Specialties report,” USDA.gov. These higher wages and compliance costs make labor-intensive and open-field production less competitive, especially when the imported supply continues to influence market pricing significantly.
Import Competition and Air-Freight Volatility
Import competition and air freight volatility continue to act as structural constraints on the United States floriculture market. Fresh cut flower imports reached USD 2.7 billion in 2024. In March 2026, the United States Department of Agriculture's Foreign Agricultural Service (FAS) reported that the 10% tariff imposed on Colombian flower imports in April 2025, combined with higher Colombian labor costs and peso appreciation, resulted in a significant margin squeeze across the trade, adding over USD 200 million in annual costs. While domestic growers benefit to some extent from increased landed import costs, price sensitivity among consumers may lead to reduced purchase occasions rather than a straightforward shift in sourcing.
*Our forecasts treat driver/restraint impacts as directional, not additive. The impact forecasts reflect baseline growth, mix effects, and variable interactions.
Segment Analysis
By Cut Flower Type: Roses Lead While Orchids Define the Premium Growth Frontier
The roses segment accounted for the largest 29.9% of the United States floriculture market share in 2025. Their strong commercial presence persists due to their widespread use in gifting, event decorations, retail floral arrangements, and premium bouquet programs nationwide. Imported long-stem roses meet the demand from mass retail and supermarkets, while domestic growers are focusing more on specialty garden roses and premium locally sourced varieties. Differentiation based on bloom quality, fragrance, vase life, and sustainable cultivation practices is becoming increasingly significant across retail channels. Year-round consumer purchasing patterns, driven by holidays, weddings, hospitality, and personal gifting occasions, continue to support demand for roses.
The United States floriculture market size for the orchids segment is projected to grow at the fastest 4.9% CAGR from 2026 to 2031. Orchids are gaining popularity as consumers increasingly associate them with premium indoor décor, wellness-focused lifestyles, and longer-lasting floral arrangements. Commercial demand from hospitality venues, corporate offices, and upscale residential décor programs is also driving stronger sales growth for orchids nationwide. Advances in climate-controlled greenhouse production and improved propagation techniques are enabling domestic suppliers to expand the availability of premium orchids. While tulips, lilies, chrysanthemums, carnations, and gerberas maintain stable demand, orchids are emerging as a key driver of premium and higher-margin growth within the floriculture retail market.


Geography Analysis
According to the United States Department of Agriculture National Agricultural Statistics Service, Florida recorded USD 1.13 billion in floriculture sales during 2024, with Florida and California together contributing 32% of national sales in the United States floriculture market. These states hold strong positions in the production of foliage plants, bedding plants, flowering potted plants, and cut flowers, which are supplied to retail chains, supermarkets, and garden centers nationwide. The concentration of production in these regions heightens sensitivity to factors such as labor availability, water management, and weather-related supply disruptions. Other states, including Michigan, North Carolina, Texas, and New Jersey, are expanding their floriculture operations to enhance regional supply resilience and reduce transportation times for highly perishable floral products.
Michigan led the country in the number of floriculture operations, with 1,043 businesses in 2024, surpassing California’s 806, according to the United States Department of Agriculture data. This operational base supports regional garden centers and grocery retailers across the Midwest, demonstrating that the United States floriculture market extends beyond the two largest sales states. North Carolina, New Jersey, and Texas also play significant roles due to their proximity to dense retail demand centers, which helps reduce transit times for time-sensitive products. This geographic diversification addresses water and labor challenges in traditional production corridors.
The Pacific Northwest is strengthening its role in specialty floriculture production, particularly in tulip bulbs, ornamental foliage, and greenhouse-grown nursery plants. Washington and Oregon benefit from favorable growing conditions, established greenhouse infrastructure, and proximity to western retail markets, which support demand for ornamental horticulture. Investment in greenhouse expansion, propagation facilities, and regional supply chains is increasing as producers aim to improve operational resilience and diversify growing locations. Domestic origin labeling and locally grown floral branding strategies are gaining importance for retail differentiation, especially as consumers increasingly prioritize freshness, sustainability, and locally sourced ornamental plant products in major metropolitan markets.
Competitive Landscape
The competitive structure of the commercial floriculture market remains diverse due to the participation of large greenhouse operators, regional growers, wholesale distributors, and specialty floral producers across various product categories and geographic markets. Large commercial greenhouse companies benefit from production scale, logistics coordination, and partnerships with national retailers, including supermarkets, home improvement chains, and garden centers. In contrast, smaller and regional growers compete by offering specialty plant varieties, employing local sourcing strategies, ensuring premium floral quality, and maintaining direct relationships with independent florists and regional retailers.
Vertical integration is gaining significance as major companies expand their operations to include breeding, propagation, greenhouse cultivation, and wholesale distribution. Companies are enhancing operational resilience through acquisitions, greenhouse expansion projects, and broader geographic coverage, ensuring year-round product availability. Retail supply consistency and logistics efficiency are becoming critical as large commercial buyers prioritize reliable floral sourcing partners with nationwide distribution capabilities. Investments in greenhouse automation, environmental controls, and crop quality monitoring are further improving production efficiency and supporting premium positioning within the competitive ornamental plant and floral product categories in the United States.
According to the United States Department of Agriculture National Agricultural Statistics Service, there were 11,262 floriculture producer operations in the country in 2024, reflecting the extensive participation of growers in ornamental horticulture and floral production. Large greenhouse operators continue to influence national retail programs through their scale and distribution reach, while regional growers remain competitive by focusing on specialty offerings and local market positioning. Industry consolidation, driven by acquisitions and greenhouse partnerships, is strengthening the operational capabilities of larger commercial suppliers. This competitive structure balances national-scale production efficiency with regional product diversity and specialized ornamental plant cultivation.
Recent Industry Developments
- March 2026: The Georgia Senate approved Senate Bill 240, officially designating the sweetbay magnolia as the state flower, replacing the Cherokee rose. The bill also establishes April as "Georgia Native Plant Month" permanently.
- February 2026: Valentine's Day flower imports at Miami International Airport increased despite rising tariffs and higher shipping costs. The country reported a 6% year-over-year growth in pre-holiday floral shipments, handling approximately 990 million stems in the weeks leading up to February 14th.
- January 2026: Metrolina Greenhouses, Inc. has completed its merger with South Central Growers. The unified company, continuing under the Metrolina Greenhouses brand, delivers approximately 70 million plants annually across 19 states.


United States Floriculture Market Report Scope
Floriculture encompasses the cultivation, production, and marketing of flowering and ornamental plants for decorative, gifting, landscaping, and commercial use. It includes the greenhouse and field production of cut flowers and ornamental plants, including roses, tulips, lilies, gladioli, snapdragons, gerbera, orchids, chrysanthemums, and carnations. These plants are commonly utilized in floral arrangements, indoor decoration, gardens, hospitality venues, events, and retail floral programs.
The United States Floriculture Market Report is Segmented by Cut Flower Type (Roses, Tulips, Lilies, and More). The Report Includes Production Analysis (Volume), Consumption Analysis (Value and Volume), Export Analysis (Value and Volume), Import Analysis (Value and Volume), Wholesale Price Trend Analysis and Forecast, and Seasonality Analysis. The Market Forecasts are Provided in Terms of Value (USD) and Volume (Metric Tons).
By Cut Flower Type
| Roses | Production Analysis | Production Volume | |
| Area Harvested and Yield | |||
| Consumption Analysis (Value and Volume) | |||
| Trade Analysis (Value and Volume) | Import Market Analysis | Import Value and Volume | |
| Key Supplying Markets | |||
| Export Market Analysis | Export Value and Volume | ||
| Key Destinations Markets | |||
| Wholesale Price Trend Analysis and Forecast | |||
| Seasonality Analysis | |||
| Tulips | Production Analysis | Production Volume | |
| Area Harvested and Yield | |||
| Consumption Analysis (Value and Volume) | |||
| Import Value and Volume | |||
| Key Supplying Markets | |||
| Export Value and Volume | |||
| Key Destinations Markets | |||
| Wholesale Price Trend Analysis and Forecast | |||
| Seasonality Analysis | |||
| Lilies | Production Analysis | Production Volume | |
| Area Harvested and Yield | |||
| Consumption Analysis (Value and Volume) | |||
| Import Value and Volume | |||
| Key Supplying Markets | |||
| Export Value and Volume | |||
| Key Destinations Markets | |||
| Wholesale Price Trend Analysis and Forecast | |||
| Seasonality Analysis | |||
| Gladioli | Production Analysis | Production Volume | |
| Area Harvested and Yield | |||
| Consumption Analysis (Value and Volume) | |||
| Import Value and Volume | |||
| Key Supplying Markets | |||
| Export Value and Volume | |||
| Key Destinations Markets | |||
| Wholesale Price Trend Analysis and Forecast | |||
| Seasonality Analysis | |||
| Snapdragons | Production Analysis | Production Volume | |
| Area Harvested and Yield | |||
| Consumption Analysis (Value and Volume) | |||
| Import Value and Volume | |||
| Key Supplying Markets | |||
| Export Value and Volume | |||
| Key Destinations Markets | |||
| Wholesale Price Trend Analysis and Forecast | |||
| Seasonality Analysis | |||
| Gerberas | Production Analysis | Production Volume | |
| Area Harvested and Yield | |||
| Consumption Analysis (Value and Volume) | |||
| Import Value and Volume | |||
| Key Supplying Markets | |||
| Export Value and Volume | |||
| Key Destinations Markets | |||
| Wholesale Price Trend Analysis and Forecast | |||
| Seasonality Analysis | |||
| Orchids | Production Analysis | Production Volume | |
| Area Harvested and Yield | |||
| Consumption Analysis (Value and Volume) | |||
| Import Value and Volume | |||
| Key Supplying Markets | |||
| Export Value and Volume | |||
| Key Destinations Markets | |||
| Wholesale Price Trend Analysis and Forecast | |||
| Seasonality Analysis | |||
| Chrysanthemums | Production Analysis | Production Volume | |
| Area Harvested and Yield | |||
| Consumption Analysis (Value and Volume) | |||
| Import Value and Volume | |||
| Key Supplying Markets | |||
| Export Value and Volume | |||
| Key Destinations Markets | |||
| Wholesale Price Trend Analysis and Forecast | |||
| Seasonality Analysis | |||
| Carnations | Production Analysis | Production Volume | |
| Area Harvested and Yield | |||
| Consumption Analysis (Value and Volume) | |||
| Import Value and Volume | |||
| Key Supplying Markets | |||
| Export Value and Volume | |||
| Key Destinations Markets | |||
| Wholesale Price Trend Analysis and Forecast | |||
| Seasonality Analysis | |||
| By Cut Flower Type | Roses | Production Analysis | Production Volume | |
| Area Harvested and Yield | ||||
| Consumption Analysis (Value and Volume) | ||||
| Trade Analysis (Value and Volume) | Import Market Analysis | Import Value and Volume | ||
| Key Supplying Markets | ||||
| Export Market Analysis | Export Value and Volume | |||
| Key Destinations Markets | ||||
| Wholesale Price Trend Analysis and Forecast | ||||
| Seasonality Analysis | ||||
| Tulips | Production Analysis | Production Volume | ||
| Area Harvested and Yield | ||||
| Consumption Analysis (Value and Volume) | ||||
| Import Value and Volume | ||||
| Key Supplying Markets | ||||
| Export Value and Volume | ||||
| Key Destinations Markets | ||||
| Wholesale Price Trend Analysis and Forecast | ||||
| Seasonality Analysis | ||||
| Lilies | Production Analysis | Production Volume | ||
| Area Harvested and Yield | ||||
| Consumption Analysis (Value and Volume) | ||||
| Import Value and Volume | ||||
| Key Supplying Markets | ||||
| Export Value and Volume | ||||
| Key Destinations Markets | ||||
| Wholesale Price Trend Analysis and Forecast | ||||
| Seasonality Analysis | ||||
| Gladioli | Production Analysis | Production Volume | ||
| Area Harvested and Yield | ||||
| Consumption Analysis (Value and Volume) | ||||
| Import Value and Volume | ||||
| Key Supplying Markets | ||||
| Export Value and Volume | ||||
| Key Destinations Markets | ||||
| Wholesale Price Trend Analysis and Forecast | ||||
| Seasonality Analysis | ||||
| Snapdragons | Production Analysis | Production Volume | ||
| Area Harvested and Yield | ||||
| Consumption Analysis (Value and Volume) | ||||
| Import Value and Volume | ||||
| Key Supplying Markets | ||||
| Export Value and Volume | ||||
| Key Destinations Markets | ||||
| Wholesale Price Trend Analysis and Forecast | ||||
| Seasonality Analysis | ||||
| Gerberas | Production Analysis | Production Volume | ||
| Area Harvested and Yield | ||||
| Consumption Analysis (Value and Volume) | ||||
| Import Value and Volume | ||||
| Key Supplying Markets | ||||
| Export Value and Volume | ||||
| Key Destinations Markets | ||||
| Wholesale Price Trend Analysis and Forecast | ||||
| Seasonality Analysis | ||||
| Orchids | Production Analysis | Production Volume | ||
| Area Harvested and Yield | ||||
| Consumption Analysis (Value and Volume) | ||||
| Import Value and Volume | ||||
| Key Supplying Markets | ||||
| Export Value and Volume | ||||
| Key Destinations Markets | ||||
| Wholesale Price Trend Analysis and Forecast | ||||
| Seasonality Analysis | ||||
| Chrysanthemums | Production Analysis | Production Volume | ||
| Area Harvested and Yield | ||||
| Consumption Analysis (Value and Volume) | ||||
| Import Value and Volume | ||||
| Key Supplying Markets | ||||
| Export Value and Volume | ||||
| Key Destinations Markets | ||||
| Wholesale Price Trend Analysis and Forecast | ||||
| Seasonality Analysis | ||||
| Carnations | Production Analysis | Production Volume | ||
| Area Harvested and Yield | ||||
| Consumption Analysis (Value and Volume) | ||||
| Import Value and Volume | ||||
| Key Supplying Markets | ||||
| Export Value and Volume | ||||
| Key Destinations Markets | ||||
| Wholesale Price Trend Analysis and Forecast | ||||
| Seasonality Analysis | ||||


Key Questions Answered in the Report
What is the current market size of floriculture sales in the United States in 2026?
The United States floriculture current market size is USD 8.38 billion in 2026.
Which cut flower category leads revenue in the United States?
Roses accounted for the largest category, holding 29.9% of market share in 2025.
Which flower category is projected to grow the fastest through 2031?
Orchids are projected to post the fastest growth, with a 4.9% CAGR from 2026 to 2031.
What are the main cost pressures facing growers now?
Labor costs, import competition, freight volatility, water restrictions, and phytosanitary compliance are the main pressures shaping grower margins and location strategy.
Page last updated on:


