Orange Market Analysis by Mordor Intelligence
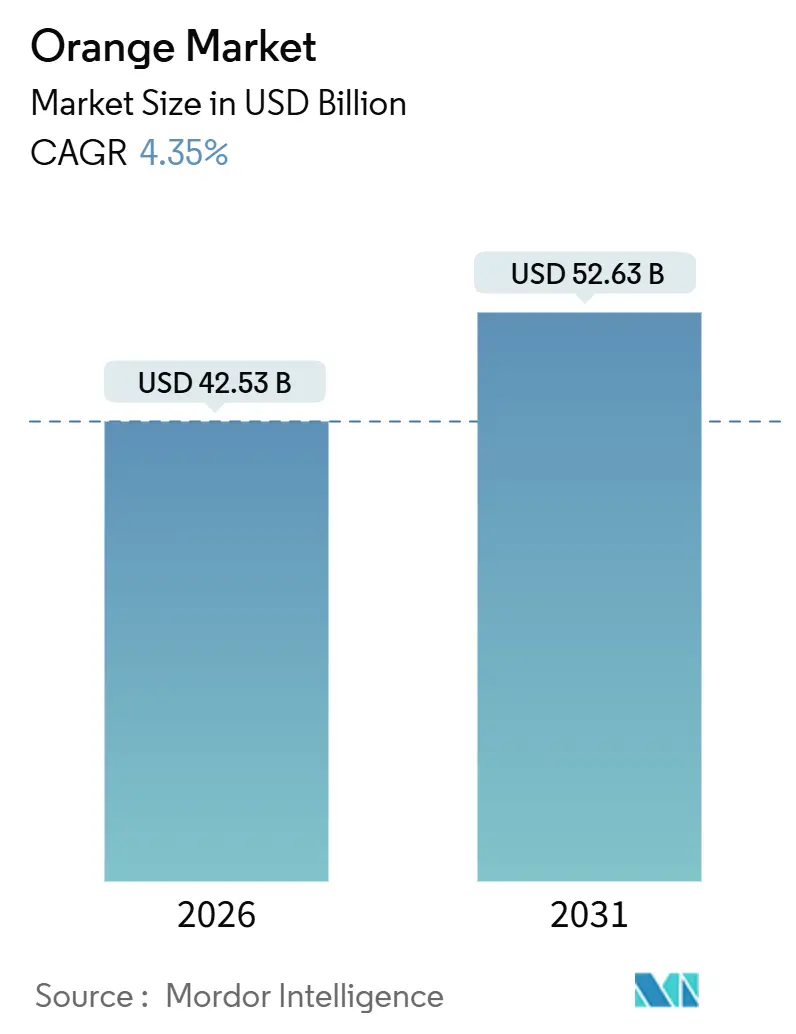
The orange market size was valued at USD 42.53 billion in 2026 and is projected to reach USD 52.63 billion by 2031, registering a compound annual growth rate (CAGR) of 4.35%. Consumption encompasses daily fresh fruit intake and industrial applications, including juice production, fragrances, and other ingredient uses, with demand originating from both household and commercial channels. Supply chains are affected by factors such as citrus greening disease and fluctuations in freight or input costs, which collectively influence pricing dynamics for growers, packers, processors, and retailers. Regionally, the Asia-Pacific accounted for a significant share of the orange market, driven by rising middle-class consumption in countries such as China and India. Meanwhile, Africa is projected to record the fastest growth, supported by Morocco and Egypt's efforts to enhance export infrastructure. Global juice processors continue to play a critical role in shaping farm-gate prices, as they purchase approximately 60% of global orange output and prioritize large, traceable suppliers capable of ensuring consistent year-round supply volumes.
Key Report Takeaways
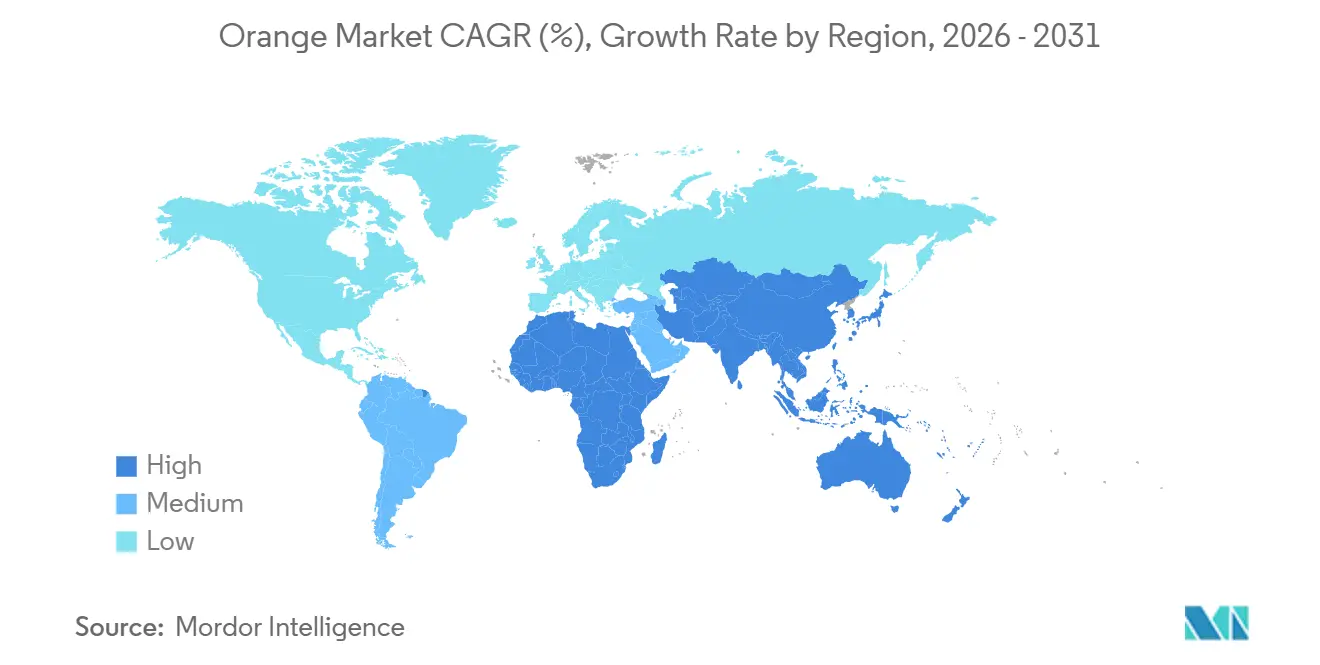
- By geography, the Asia-Pacific region accounted for 35.7% of the orange market share in 2025. Africa is set to expand at a compound annual growth rate of 4.5% from 2026 to 2031, with Egypt and Morocco adding cold-chain capacity that supports counter-seasonal exports and increases their combined orange market size in both value and volume terms.
Note: Market size and forecast figures in this report are generated using Mordor Intelligence’s proprietary estimation framework, updated with the latest available data and insights as of January 2026.
Global Orange Market Trends and Insights
Drivers Impact Analysis*
| Driver | (~) % Impact on CAGR Forecast | Geographic Relevance | Impact Timeline |
|---|---|---|---|
| Rising demand from global juice processors | +0.8% | Brazil, United States, European Union, and global consumer markets | Medium term (2-4 years) |
| Expanding cold-chain logistics capacity | +0.6% | Asia-Pacific, Middle East, and Africa | Long term (≥ 4 years) |
| Premium varietal branding | +0.5% | North America, Europe, and Australia | Short term (≤ 2 years) |
| Adoption of precision-ag techniques in large orchards | +0.4% | North America, Australia, South Africa, and Spain | Medium term (2-4 years) |
| Emergence of regenerative citrus certifications | +0.3% | North America, Europe, and selected South American estates | Long term (≥ 4 years) |
| Deployment of low-carbon shipping corridors | +0.2% | Global trade routes with priority on European Union-bound exports | Medium term (2-4 years) |
| Source: Mordor Intelligence | |||
Rising Demand from Global Juice Processors
In 2025, juice processors accounted for approximately 60% of global orange consumption, driven by beverage companies replacing artificial sweeteners with natural fructose and reducing added sugar across their product portfolios. Brazil's vertically integrated operations, which encompass groves, extraction facilities, tank farms, and chartered reefers, enable multi-season procurement strategies and mitigate exposure to spot price fluctuations. When Florida's orange crop declined to 15.85 million boxes during the 2024–2025 season, FCOJ futures on the Intercontinental Exchange reached five-year highs. This prompted brands to experiment with blends that reduced Valencia orange content by incorporating mandarin or grapefruit inputs. The strong demand allows growers who ensure phytosanitary compliance and traceable volumes to secure a consistent premium, even as global orange acreage remains relatively stable.
Expanding Cold-Chain Logistics Capacity
Between 2024 and 2025, Egypt commissioned new refrigerated storage facilities near Alexandria, adding 40,000 pallet slots to support citrus exports, including oranges, to the European Union and Gulf Cooperation Council markets [1]Source: Egyptian Ministry of Agriculture and Land Reclamation, “Agricultural Statistics and Reports,” AGRICULTURE.GOV.EG. Under China’s Belt and Road Initiative, temperature-controlled depots were established in Pakistan, Uzbekistan, and Kazakhstan, significantly reducing post-harvest loss rates, which previously ranged from 15% to 25% in warmer regions. With more packhouses connected to highway and rail corridors, exporters can target premium off-season markets, enhancing farm-gate prices. Additionally, e-commerce fruit platforms in cities such as Shanghai, Shenzhen, and Kuala Lumpur depend on these cold-chain networks, which play a critical role in sustaining the long-term growth of the orange market.
Premium Varietal Branding
Retailers packaged Cara Cara, Moro blood, and seedless Navel oranges in branded boxes featuring quick-response codes that linked shoppers to orchard sustainability dashboards. This strategy enabled premiums of 30%–50% higher than those of commodity oranges in 2025. California’s Sunkist Growers introduced limited Cara Cara offerings, achieving a 22% markup in Boston and Chicago supermarkets. These branded offerings highlighted the unique flavor profile and nutritional benefits of Cara Cara oranges, appealing to health-conscious consumers. Meanwhile, Australian growers supplied individually wrapped blood oranges to Shanghai gift retailers, securing a 40% price increase. The premium packaging and presentation highlighted the exotic appeal and antioxidant properties of blood oranges, making them an attractive choice as luxury gifts. The use of visual differentiation and antioxidant-focused messaging helps producers maintain margins, even during periods of surplus Valencia orange production, effectively segmenting the orange market into premium and value categories.
Emergence of Regenerative Citrus Certifications
Groves in California, Brazil, and Peru have adopted cover crops, compost inputs, and pollinator habitats as requirements to achieve Regenerative Organic Certified status by 2025. This certification has enabled these producers to secure shelf markups of 10%–15% in markets such as Portland, Berlin, and Copenhagen [2]Source: Regenerative Organic Alliance, “Certification Standards,” REGENORGANIC.ORG. European Union grocers are increasingly demanding evidence of soil carbon improvements and biodiversity metrics, granting certified orchards preferred supplier status. The documentation costs for regenerative certification remain lower than those for full organic conversion, providing producers who already utilize precision-fertilization practices with an accessible pathway for brand differentiation and enhanced income stability. Additionally, regenerative practices contribute to long-term soil health, improved water retention, and enhanced ecosystem services, further supporting sustainable agricultural systems and meeting evolving consumer and regulatory expectations.
Restraints Impact Analysis*
| Restraint | (~) % Impact on CAGR Forecast | Geographic Relevance | Impact Timeline |
|---|---|---|---|
| Citrus greening (HLB) and other diseases | -1.1% | Florida, Brazil, and parts of Asia | Short term (≤ 2 years) |
| Labor shortages during peak harvest windows | -0.4% | United States, Spain, and Australia | Medium term (2-4 years) |
| Port congestion and reefer container scarcity | -0.3% | South Africa, Egypt, and Mediterranean hubs | Short term (≤ 2 years) |
| Carbon-border-adjustment taxes on long-haul exports | -0.2% | South America and South Africa shipping to Europe | Medium term (2-4 years) |
| Source: Mordor Intelligence | |||
Citrus Greening (HLB) and Other Diseases
Huanglongbing disease, commonly known as citrus greening disease, currently has no commercial cure, with infection rates in Brazil’s São Paulo belt exceeding 20% in surveyed groves by 2025. This disease has significantly impacted citrus production, leading to substantial economic losses for growers. In Florida, commercial acreage declined by approximately 30% between 2020 and 2025 as growers removed diseased trees, further straining the citrus industry [3]Service, “Citrus Health and Disease Management,” APHIS.USDA.GOV. Research institutes are investigating CRISPR-edited resistance, but regulatory approval is not anticipated before 2028. As a result, growers are compelled to remove infected blocks, increase vector spraying, and manage higher per-box production costs, which adds financial pressure. Processors are building inventories to mitigate supply fluctuations, which ties up working capital and contributes to rising wholesale juice prices, ultimately affecting the entire supply chain.
Port Congestion and Reefer Container Scarcity
During peak 2025 loadings, Durban and Alexandria experienced reefer dwell times that exceeded normal levels by three to five days, resulting in significant delays in outbound orange shipments and substantially increasing freight costs. These delays disrupted the timely movement of goods, creating bottlenecks in the supply chain and impacting exporters' ability to meet delivery schedules. Container shortages further exacerbated the situation, leaving inventory stranded at orchards and driving up charter rates for last-minute containers. This combination of factors has placed exporters in these regions under considerable pressure, as they face heightened risks of spoilage and financial losses. Until port authorities complete their automation initiatives and significantly expand reefer plug capacity projects, which are projected to extend beyond 2027, exporters in these corridors are likely to encounter ongoing challenges, including constrained short-term growth and operational inefficiencies.
*Our forecasts treat driver/restraint impacts as directional, not additive. The impact forecasts reflect baseline growth, mix effects, and variable interactions.
Geography Analysis
Asia-Pacific accounted for 35.7% of the orange market share in 2025, driven by China's harvest of 7.5 million metric tons and India's expanding citrus cultivation in Maharashtra and Andhra Pradesh. Urban households in cities like Shanghai and Shenzhen increased their winter consumption of oranges over mandarins due to campaigns promoting vitamin C benefits. In India, modern retail chains introduced chilled displays in over 200 tier-two and tier-three cities, reducing shrinkage and enhancing product presentation. Thailand and Vietnam expanded high-density rootstock plantations, achieving a 15% yield increase within two seasons. Australia, as a counter-seasonal supplier from the Southern Hemisphere, exported Navels to Japan and South Korea at premiums of 40%–60% compared to local alternatives. The orange market size in Asia-Pacific reflects steady income growth, improved cold-chain infrastructure, and dietary diversification, contributing to its robust performance.
Africa's orange market is projected to grow at a 4.5% CAGR from 2026 to 2031, supported by significant developments in Egypt and Morocco. Egypt expanded citrus cultivation by approximately 50,000 hectares in the Nile Delta between 2024 and 2025, primarily through government reclamation initiatives, resulting in a harvest in 2025. Of this, 70% was exported fresh to markets such as the Russian Federation, the United Kingdom, and the Gulf Cooperation Council. Morocco's Souss-Massa region benefited from drip irrigation subsidies, which enhanced export-grade yields and facilitated tariff-free access to European Union organic markets, positioning Morocco as a competitor to Spain's established market share. South Africa's Western and Eastern Cape regions supplied Northern Hemisphere retailers from June to October, although congestion at Durban port limited export capacity.
North America experienced mixed outcomes in 2025. Florida's orange production declined to 15.85 million boxes due to citrus greening and hurricane damage, while California maintained production at approximately 45 million boxes by utilizing micro-irrigation and integrated pest management to ensure fresh-market quality. Mexico exported 200,000 metric tons of fresh oranges to the United States in 2025, meeting supermarket demand at competitive peso-denominated prices. In Europe, Mediterranean orchards remained the primary source of supply. Spain and Italy collectively produced 3.2 million metric tons in 2025, with Spain focusing on juice-grade oranges and Italy leveraging Sicily's niche demand for blood oranges. South America, led by Brazil, dominated global orange juice concentrate exports, accounting for over 70% of the total in 2025. São Paulo's integrated grove-to-port system supported this dominance, with Citrosuco and Cutrale leading processing operations. Argentina's Entre Ríos province catered to regional fresh demand while exploring niche organic programs. Colombia's Valle del Cauca primarily served domestic wholesalers, while Peru's coastal valleys experimented with drip-irrigated Navel oranges for Asian markets, although cold-chain limitations posed challenges.


Regulatory Landscape
Global orange trade is governed primarily by sanitary and phytosanitary (SPS) measures and commodity-specific phytosanitary standards, with ongoing harmonization work under the International Plant Protection Convention (IPPC). In December 2025, the IPPC Technical Panel on Commodity Standards met in Rome to advance commodity standards content such as pest exclusion criteria and mitigation measures, which then shape how national plant protection organizations set import requirements for fresh citrus.
Market access and compliance are also being influenced by digital border processes and sustainability-linked due diligence. In 2026, China continued strengthening General Administration of Customs of China (GACC) facility registration and digital import record filing requirements for agri-food imports, adding operational steps for exporters and packhouses. In the European Union, implementation of the Deforestation Regulation continues with iterative adjustment cycles (including updates during December 2024 and 2025) focused on compliance simplification, which increases the need for origin documentation and traceability processes across import supply chains.
Value Chain Analysis
The orange value chain starts with input procurement (saplings and rootstocks, fertilizers, and crop protection) and orchard operations, then moves through harvest, aggregation, packing, cold storage, and distribution into two main channels, fresh consumption and processing. The processing route is structurally more consolidated and capital-intensive, with large juice processors and exporters exerting pricing influence through scale procurement, extraction capacity, bulk storage, and contracted logistics. This aligns with the market structure in which processors purchase a large share of global orange output for juice-grade demand.
Logistics and cold-chain execution are key constraints for export-oriented origins, particularly during peak seasons when port and reefer capacity becomes the bottleneck. South Africa illustrates downstream friction: industry analysis of the 2024 season estimated citrus-logistics inefficiencies cost the sector R5.27 billion, linked to port delays, equipment failures at state-run Transnet terminals, and weak rail-to-road integration. At the same time, investments in refrigerated storage and packhouse connectivity in origins such as Egypt (new pallet-slot additions near Alexandria during 2024-2025 per in-scope context) indicate how cold-chain capacity affects shrink, arrival quality, and the ability to target premium, counter-seasonal export windows.
Competitive Landscape
The orange market exhibits a fragmented structure at the cultivation stage but becomes significantly consolidated during processing and export. High fixed costs in these stages act as barriers to entry for smaller players. In Brazil, Citrosuco and Cutrale collectively process over half of the national orange crop, leveraging vertical integration that includes grove ownership, juice extraction, bulk storage, and maritime distribution. In North America, Sunkist Growers operates as a long-established marketing cooperative that aggregates volumes from California and Arizona. The cooperative offers members automated packhouse facilities and shared cold storage, thereby reducing individual capital requirements. In Europe, cooperatives such as Spain’s Anecoop and various Italian consortia negotiate directly with supermarket chains, maintaining Protected Designation of Origin labels, which enables them to charge higher retail prices.
By 2025, sustainability and transparency emerged as key strategic priorities. South African exporters implemented blockchain traceability systems to record spray programs and cold-chain temperature logs, ensuring compliance with European Union due diligence regulations. In Brazil, estates expanded trials of disease-resistant rootstocks and precision monitoring of Asian citrus psyllid populations to address the threat of citrus greening. Certifications under standards such as Rainforest Alliance, Regenerative Organic, and Costa Rican Carbon Neutral gained traction, as retailers increasingly favored suppliers capable of demonstrating improvements in soil health, biodiversity, and emissions reduction.
Direct-to-retail supply models gained prominence as digital connectivity improved. Moroccan family estates and Peruvian citrus clusters began shipping container loads directly to grocery chains in Germany and the United Kingdom, thereby bypassing traditional importers and retaining margins that intermediaries had previously absorbed. While these disruptors handle relatively small volumes compared to established players, they highlight how technology is streamlining the value chain and rewarding growers who meet stringent quality and traceability standards. Rising compliance costs for carbon reporting and food safety, along with capital investments in packhouse robotics and solar-powered cold storage, are anticipated to drive further consolidation in the industry. Over the forecast period, processors are likely to continue acquiring groves to secure fruit supply or forming multi-origin sourcing alliances to mitigate climate and disease risks.
Market Opportunities and Future Outlook
Disease pressure and supply volatility are reinforcing opportunities centered on resilience, traceability, and origin diversification within the fresh-orange value chain, while keeping the report boundary focused on fresh oranges rather than juice and derivatives. In 2025, surveyed groves in Brazil reported meaningful citrus greening incidence, and Florida output fell to 15.85 million boxes in the 2024-2025 season. Those conditions pushed buyers to widen sourcing and tighten supplier requirements around phytosanitary compliance and lot-level traceability. Exporters that can document spray programs, cold-chain temperature logs, and orchard provenance (including via blockchain-style traceability systems already used by some South African exporters for EU-facing compliance) have a clearer path to expand direct-to-retail programs with supermarket chains in Europe and the United Kingdom.
Cold-chain buildout and premiumization are creating more actionable growth levers for growers and packers in emerging export corridors. Egypts commissioning of new refrigerated storage near Alexandria during 2024-2025 (40,000 pallet slots per in-scope context) supports higher export-grade throughput and better arrival quality into the European Union and GCC markets. Branded premium varietals (for example, Cara Cara, Moro blood, and seedless Navel) demonstrated sizeable retail markups in 2025 when paired with QR-linked origin and sustainability dashboards. On the demand side, clean-label and reduced-sugar positioning in orange juice is pushing processors to secure more consistent fruit specifications and traceable supply, which improves contracting opportunities for large, compliant orchards and cooperatives that can deliver predictable volumes into processing and fresh channels without compromising quality grading.
Recent Industry Developments
- June 2026: Orange SA completed its acquisition of the remaining stake in MasOrange, taking full ownership and adding MasOrange CEO Meinrad Spenger to the Orange Group Executive Committee. Although this is outside the agricultural orange commodity chain, it affects the report slug name-space and search relevance, and it is monitored to avoid misclassification of telecom-related "Orange" news as citrus market signals.
- May 2026: Integrada Cooperativa Agroindustrial expanded citrus operations at its Agua Branca Farm in Parana, Brazil, planting about 315,000 orange trees across 550 hectares to supply its Urai juice industrial unit. The expansion strengthens upstream fruit security for an industrial buyer and reflects how larger operators are locking in supply through orchard expansion and tighter farm-to-plant integration.
- July 2025: 360 Oranges entered the Indian market through a partnership with IG International Pvt Ltd and Down South to distribute premium South African oranges. The partnership uses established import logistics and cold-chain handling to improve arrival quality, supporting premium positioning and expanding counter-seasonal supply options for Indian modern retail.


Research Methodology Framework and Report Scope
Market Definition and Coverage
For this study, the orange market is sized as the value generated from oranges sold into food supply chains globally, covering fresh fruit flows and industrial use where oranges are an input to further processing.
Scope exclusions: We exclude value-added orange derivatives such as essential oils, citrus fiber, and ready-to-drink juices.
Segmentation Overview
- By Geography
- North America
- United States
- Production Analysis (Area Harvested, Yield, and Production Volume)
- Consumption Analysis (Consumption Value and Volume)
- Import Market Analysis (Import Value, Volume, and Key Supplying Markets)
- Export Market Analysis (Export Value, Volume, and Key Destination Markets)
- Wholesale Price Trend Analysis and Forecast
- Regulatory Framework
- List of Key Players
- Logistics and Infrastructure
- Seasonality Analysis
- Mexico
- Production Analysis (Area Harvested, Yield, and Production Volume)
- Consumption Analysis (Consumption Value and Volume)
- Import Market Analysis (Import Value, Volume, and Key Supplying Markets)
- Export Market Analysis (Export Value, Volume, and Key Destination Markets)
- Wholesale Price Trend Analysis and Forecast
- Regulatory Framework
- List of Key Players
- Logistics and Infrastructure
- Seasonality Analysis
- Canada
- Production Analysis (Area Harvested, Yield, and Production Volume)
- Consumption Analysis (Consumption Value and Volume)
- Import Market Analysis (Import Value, Volume, and Key Supplying Markets)
- Export Market Analysis (Export Value, Volume, and Key Destination Markets)
- Wholesale Price Trend Analysis and Forecast
- Regulatory Framework
- List of Key Players
- Logistics and Infrastructure
- Seasonality Analysis
- United States
- Europe
- Germany
- Production Analysis (Area Harvested, Yield, and Production Volume)
- Consumption Analysis (Consumption Value and Volume)
- Import Market Analysis (Import Value, Volume, and Key Supplying Markets)
- Export Market Analysis (Export Value, Volume, and Key Destination Markets)
- Wholesale Price Trend Analysis and Forecast
- Regulatory Framework
- List of Key Players
- Logistics and Infrastructure
- Seasonality Analysis
- United Kingdom
- Production Analysis (Area Harvested, Yield, and Production Volume)
- Consumption Analysis (Consumption Value and Volume)
- Import Market Analysis (Import Value, Volume, and Key Supplying Markets)
- Export Market Analysis (Export Value, Volume, and Key Destination Markets)
- Wholesale Price Trend Analysis and Forecast
- Regulatory Framework
- List of Key Players
- Logistics and Infrastructure
- Seasonality Analysis
- France
- Production Analysis (Area Harvested, Yield, and Production Volume)
- Consumption Analysis (Consumption Value and Volume)
- Import Market Analysis (Import Value, Volume, and Key Supplying Markets)
- Export Market Analysis (Export Value, Volume, and Key Destination Markets)
- Wholesale Price Trend Analysis and Forecast
- Regulatory Framework
- List of Key Players
- Logistics and Infrastructure
- Seasonality Analysis
- Netherlands
- Production Analysis (Area Harvested, Yield, and Production Volume)
- Consumption Analysis (Consumption Value and Volume)
- Import Market Analysis (Import Value, Volume, and Key Supplying Markets)
- Export Market Analysis (Export Value, Volume, and Key Destination Markets)
- Wholesale Price Trend Analysis and Forecast
- Regulatory Framework
- List of Key Players
- Logistics and Infrastructure
- Seasonality Analysis
- Italy
- Production Analysis (Area Harvested, Yield, and Production Volume)
- Consumption Analysis (Consumption Value and Volume)
- Import Market Analysis (Import Value, Volume, and Key Supplying Markets)
- Export Market Analysis (Export Value, Volume, and Key Destination Markets)
- Wholesale Price Trend Analysis and Forecast
- Regulatory Framework
- List of Key Players
- Logistics and Infrastructure
- Seasonality Analysis
- Spain
- Production Analysis (Area Harvested, Yield, and Production Volume)
- Consumption Analysis (Consumption Value and Volume)
- Import Market Analysis (Import Value, Volume, and Key Supplying Markets)
- Export Market Analysis (Export Value, Volume, and Key Destination Markets)
- Wholesale Price Trend Analysis and Forecast
- Regulatory Framework
- List of Key Players
- Logistics and Infrastructure
- Seasonality Analysis
- Greece
- Production Analysis (Area Harvested, Yield, and Production Volume)
- Consumption Analysis (Consumption Value and Volume)
- Import Market Analysis (Import Value, Volume, and Key Supplying Markets)
- Export Market Analysis (Export Value, Volume, and Key Destination Markets)
- Wholesale Price Trend Analysis and Forecast
- Regulatory Framework
- List of Key Players
- Logistics and Infrastructure
- Seasonality Analysis
- Germany
- Asia-Pacific
- China
- Production Analysis (Area Harvested, Yield, and Production Volume)
- Consumption Analysis (Consumption Value and Volume)
- Import Market Analysis (Import Value, Volume, and Key Supplying Markets)
- Export Market Analysis (Export Value, Volume, and Key Destination Markets)
- Wholesale Price Trend Analysis and Forecast
- Regulatory Framework
- List of Key Players
- Logistics and Infrastructure
- Seasonality Analysis
- India
- Production Analysis (Area Harvested, Yield, and Production Volume)
- Consumption Analysis (Consumption Value and Volume)
- Import Market Analysis (Import Value, Volume, and Key Supplying Markets)
- Export Market Analysis (Export Value, Volume, and Key Destination Markets)
- Wholesale Price Trend Analysis and Forecast
- Regulatory Framework
- List of Key Players
- Logistics and Infrastructure
- Seasonality Analysis
- Thailand
- Production Analysis (Area Harvested, Yield, and Production Volume)
- Consumption Analysis (Consumption Value and Volume)
- Import Market Analysis (Import Value, Volume, and Key Supplying Markets)
- Export Market Analysis (Export Value, Volume, and Key Destination Markets)
- Wholesale Price Trend Analysis and Forecast
- Regulatory Framework
- List of Key Players
- Logistics and Infrastructure
- Seasonality Analysis
- Australia
- Production Analysis (Area Harvested, Yield, and Production Volume)
- Consumption Analysis (Consumption Value and Volume)
- Import Market Analysis (Import Value, Volume, and Key Supplying Markets)
- Export Market Analysis (Export Value, Volume, and Key Destination Markets)
- Wholesale Price Trend Analysis and Forecast
- Regulatory Framework
- List of Key Players
- Logistics and Infrastructure
- Seasonality Analysis
- Indonesia
- Production Analysis (Area Harvested, Yield, and Production Volume)
- Consumption Analysis (Consumption Value and Volume)
- Import Market Analysis (Import Value, Volume, and Key Supplying Markets)
- Export Market Analysis (Export Value, Volume, and Key Destination Markets)
- Wholesale Price Trend Analysis and Forecast
- Regulatory Framework
- List of Key Players
- Logistics and Infrastructure
- Seasonality Analysis
- Vietnam
- Production Analysis (Area Harvested, Yield, and Production Volume)
- Consumption Analysis (Consumption Value and Volume)
- Import Market Analysis (Import Value, Volume, and Key Supplying Markets)
- Export Market Analysis (Export Value, Volume, and Key Destination Markets)
- Wholesale Price Trend Analysis and Forecast
- Regulatory Framework
- List of Key Players
- Logistics and Infrastructure
- Seasonality Analysis
- China
- South America
- Brazil
- Production Analysis (Area Harvested, Yield, and Production Volume)
- Consumption Analysis (Consumption Value and Volume)
- Import Market Analysis (Import Value, Volume, and Key Supplying Markets)
- Export Market Analysis (Export Value, Volume, and Key Destination Markets)
- Wholesale Price Trend Analysis and Forecast
- Regulatory Framework
- List of Key Players
- Logistics and Infrastructure
- Seasonality Analysis
- Argentina
- Production Analysis (Area Harvested, Yield, and Production Volume)
- Consumption Analysis (Consumption Value and Volume)
- Import Market Analysis (Import Value, Volume, and Key Supplying Markets)
- Export Market Analysis (Export Value, Volume, and Key Destination Markets)
- Wholesale Price Trend Analysis and Forecast
- Regulatory Framework
- List of Key Players
- Logistics and Infrastructure
- Seasonality Analysis
- Colombia
- Production Analysis (Area Harvested, Yield, and Production Volume)
- Consumption Analysis (Consumption Value and Volume)
- Import Market Analysis (Import Value, Volume, and Key Supplying Markets)
- Export Market Analysis (Export Value, Volume, and Key Destination Markets)
- Wholesale Price Trend Analysis and Forecast
- Regulatory Framework
- List of Key Players
- Logistics and Infrastructure
- Seasonality Analysis
- Peru
- Production Analysis (Area Harvested, Yield, and Production Volume)
- Consumption Analysis (Consumption Value and Volume)
- Import Market Analysis (Import Value, Volume, and Key Supplying Markets)
- Export Market Analysis (Export Value, Volume, and Key Destination Markets)
- Wholesale Price Trend Analysis and Forecast
- Regulatory Framework
- List of Key Players
- Logistics and Infrastructure
- Seasonality Analysis
- Brazil
- Middle East
- Turkey
- Production Analysis (Area Harvested, Yield, and Production Volume)
- Consumption Analysis (Consumption Value and Volume)
- Import Market Analysis (Import Value, Volume, and Key Supplying Markets)
- Export Market Analysis (Export Value, Volume, and Key Destination Markets)
- Wholesale Price Trend Analysis and Forecast
- Regulatory Framework
- List of Key Players
- Logistics and Infrastructure
- Seasonality Analysis
- United Arab Emirates
- Production Analysis (Area Harvested, Yield, and Production Volume)
- Consumption Analysis (Consumption Value and Volume)
- Import Market Analysis (Import Value, Volume, and Key Supplying Markets)
- Export Market Analysis (Export Value, Volume, and Key Destination Markets)
- Wholesale Price Trend Analysis and Forecast
- Regulatory Framework
- List of Key Players
- Logistics and Infrastructure
- Seasonality Analysis
- Turkey
- Africa
- Egypt
- Production Analysis (Area Harvested, Yield, and Production Volume)
- Consumption Analysis (Consumption Value and Volume)
- Import Market Analysis (Import Value, Volume, and Key Supplying Markets)
- Export Market Analysis (Export Value, Volume, and Key Destination Markets)
- Wholesale Price Trend Analysis and Forecast
- Regulatory Framework
- List of Key Players
- Logistics and Infrastructure
- Seasonality Analysis
- Morocco
- Production Analysis (Area Harvested, Yield, and Production Volume)
- Consumption Analysis (Consumption Value and Volume)
- Import Market Analysis (Import Value, Volume, and Key Supplying Markets)
- Export Market Analysis (Export Value, Volume, and Key Destination Markets)
- Wholesale Price Trend Analysis and Forecast
- Regulatory Framework
- List of Key Players
- Logistics and Infrastructure
- Seasonality Analysis
- South Africa
- Production Analysis (Area Harvested, Yield, and Production Volume)
- Consumption Analysis (Consumption Value and Volume)
- Import Market Analysis (Import Value, Volume, and Key Supplying Markets)
- Export Market Analysis (Export Value, Volume, and Key Destination Markets)
- Wholesale Price Trend Analysis and Forecast
- Regulatory Framework
- List of Key Players
- Logistics and Infrastructure
- Seasonality Analysis
- Egypt
- North America
Data Sources, Market Sizing, and Validation
Desk Research
Desk research helped us map the supply chain and the measurable data series that can be tracked country by country. We leaned on public agriculture and trade statistics such as FAOSTAT production and yield series, UN Comtrade import and export values, and USDA citrus outlooks to understand crop cycles and supply shocks. Price direction was cross-checked using official wholesale price bulletins and market arrival data where available, and by reviewing national agriculture ministry releases for major producing and importing countries.
To avoid building the model on one single data stream, we also reviewed citrus association publications, peer-reviewed horticulture and plant pathology papers (mainly for disease impact timing), and company filings and investor presentations for processor demand signals. In a few places, a paid subscription for company financials and a shipment-level import and export database were used to sanity-check traded volumes and unit values. The desk sources listed above are illustrative only, and many other public documents and datasets were also referred to for data collection, validation, and clarification.
Primary Interviews and Surveys
Primary work was used to pressure-test the desk assumptions around farm-gate to wholesale price movement, processing pull, and how trade availability changes during short crop years. We spoke with growers, exporters and importers, wholesalers, and people connected to juice processing and ingredient buying, and then we rechecked the same points across APAC, EMEA, and the Americas so regional bias stayed limited.
Distribution of primary research fieldwork respondents
| Company type | Respondent position | Region |
|---|---|---|
| Top tier: 28% | CXOs: 12% | APAC: 51% |
| Mid tier: 58% | Functional/Unit leaders: 36% | EMEA: 31% |
| Smaller Players: 14% | Managers: 52% | Americas: 18% |
Market-Sizing & Forecasting
Sizing started with a top-down build where country production, net trade, and wholesale price series are reconstructed into a consistent value pool, and then rolled up into regional and global totals. Because production and trade data can lag or be revised, we corroborated the totals using selective bottom-up checks, mainly sample price times volume calculations from key corridors, plus channel checks shared by interviewees.
Key inputs that shaped the model included harvested area and yield trends, seasonality and crop loss events, the share of crop diverted to processing versus fresh movement, import dependency for large consumer markets, and wholesale price spreads across origin and destination markets. For forecasting, scenario analysis was used so weather-driven supply risk and disease pressure could be reflected without forcing a single straight-line outcome. Where bottom-up signals were missing for smaller origins, proxy price series and trade unit values were applied, and the resulting totals were adjusted only after a second pass of interview validation.
Data Validation & Update Cycle
Outputs were validated by checking whether implied per-capita availability, trade shares, and price levels were directionally consistent with independent country indicators. If a region showed unusual jumps, the inputs were re-opened, and outliers were traced back to either a one-off crop event, a revision in trade reporting, or a currency timing issue, before sign-off.
The work goes through more than one analyst review so that definitions and arithmetic are checked separately from assumptions. Reports are refreshed annually, and interim updates are made when material events occur, such as major disease impacts, export restrictions, or sharp price spikes. Before delivery, a final pass is completed so clients receive the most current view.
Mordor Intelligence's Orange Market Size Compared Against Other Published Estimates
Published orange market values can differ quite a bit because the same word, oranges, is often counted at different value-chain points and with different product inclusions. Some sources are closer to producer and importer revenues, while others bring in broader processed categories, which can lift the headline number.
The biggest gap drivers in oranges usually come from whether processed orange products are counted as part of the market value, how wholesale versus retail pricing is treated, and whether trade unit values are smoothed across volatile seasons. Currency conversion timing also matters because orange prices can swing quickly during short supply periods.
Benchmark comparison
| Source | Market Size | Gaps in Research Methodology |
|---|---|---|
| Mordor Intelligence | USD 42.53 B (2026) | |
| Global Data Publisher A | USD 48.54 B (2025) | This estimate includes processed forms (such as juice and concentrates) as part of the orange market and therefore captures additional downstream value, and it also uses a different base year for pricing. |
| Industry Data Platform B | USD 51.20 B (2024) | This figure is described as revenues of producers and importers in nominal wholesale terms, so differences can come from how trade valuation is treated and how strongly prices are normalized across volatile crop seasons. |
The spread in the table is mostly explained by processed inclusions and the pricing point used, which matters a lot when supply shifts quickly due to weather or disease. When the value is kept tied to fresh-fruit and industrial-use orange flows, and trade unit values and wholesale prices are rechecked across major origins and import markets, the outcome stays closer to the defined demand pool, a filtering step applied by Mordor Intelligence.


Key Questions Answered in the Report
What is the current global value of the orange market?
The orange market size is USD 42.53 billion in 2026.
How fast is the orange market is projected to grow?
How fast is the orange market projected to grow?
Which region holds the largest share of the orange market?
Asia-Pacific led with 35.7% of global value and volume in 2025.
Which region is growing the fastest for orange supply and demand?
Africa is forecast to post the highest 4.5% compound annual growth rate from 2026 to 2031.
How does citrus greening affect global orange supply?
The disease has cut Florida and Brazilian output, increased production costs, and pushed processors to diversify sourcing and hold larger inventories.
Page last updated on:


