Cut Flowers Market Size and Share
Cut Flowers Market Analysis by Mordor Intelligence
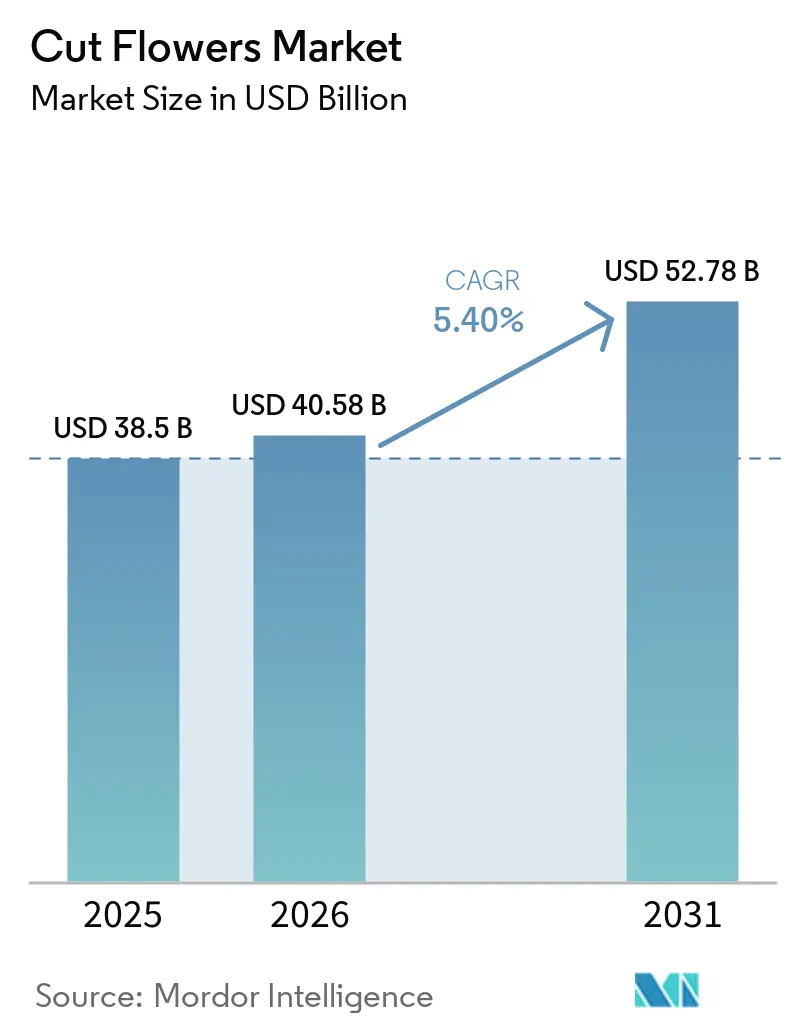
The cut flowers market size was valued at USD 38.50 billion in 2025 and is projected to grow from USD 40.58 billion in 2026 to USD 52.78 billion by 2031, at a CAGR of 5.4% during the forecast period (2026-2031). The market is shifting away from sharp seasonal demand, driven by the growth of online ordering, which facilitates regular weekly purchases and year-round gifting. Increasing disposable incomes in the Asia-Pacific region are expanding the customer base for bouquets, décor, and celebration-related spending. Trade hubs such as the Netherlands, Colombia, and Kenya continue to play a pivotal role in the market by linking fragmented farm supplies with global buyers, cold-chain services, and re-export channels. Additionally, advancements in digital auction tools, certification standards, and climate-controlled production are providing competitive advantages to growers investing in technology and compliance. Improvements in vase life, enhanced cold-chain logistics, and the gradual adoption of sea freight are creating cost and sustainability opportunities, which are projected to reshape the supply dynamics of the cut flowers market over the forecast period.
Key Report Takeaways
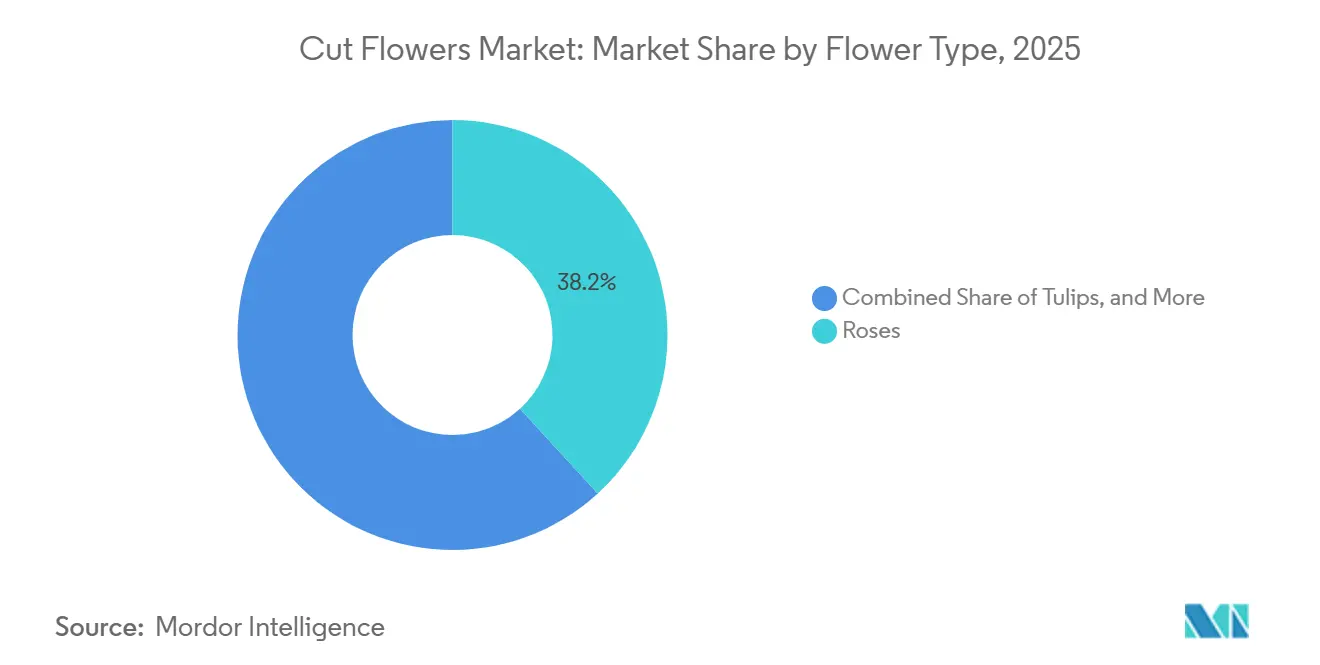
- By flower type, the cut flowers market share for the roses segment led with the largest 38.2% in 2025, while the cut flowers market size for the tulips segment is projected to grow at the fastest 9.4% CAGR from 2026 to 2031.
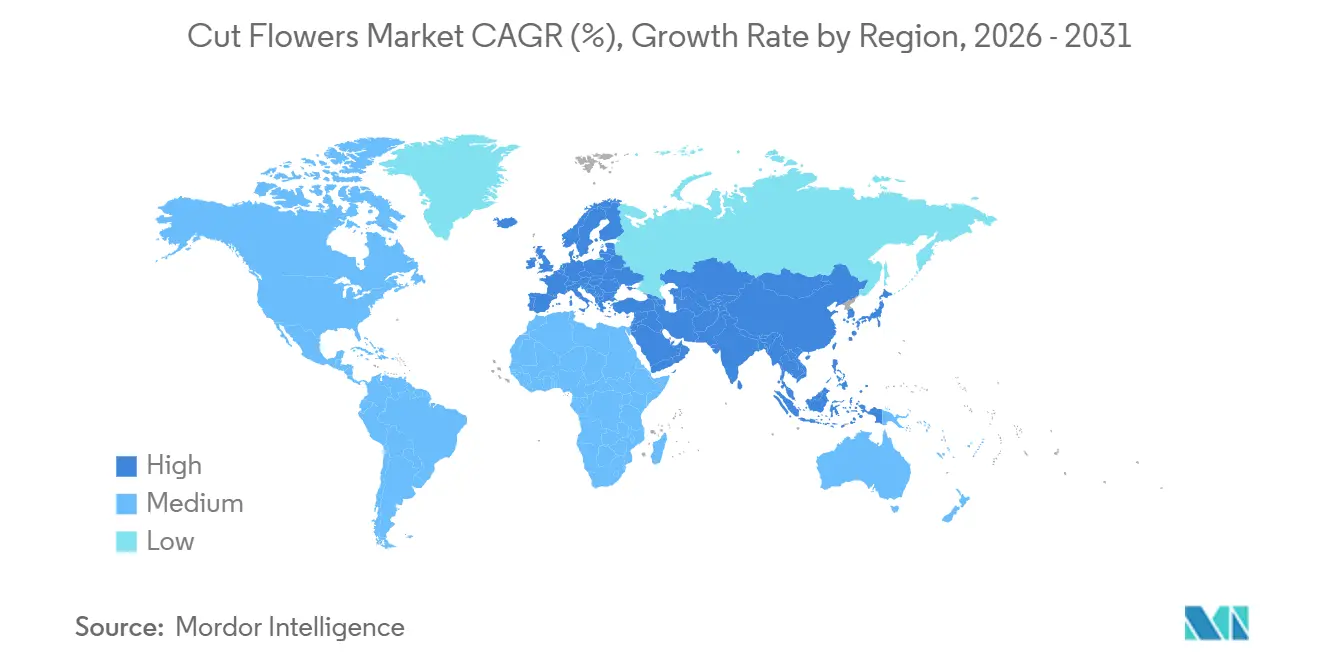
- By geography, Europe holds the largest segment, capturing 46.0% of the cut flowers market share in 2025, and the cut flowers market size for the Asia-Pacific is the fastest-growing region, forecast to expand at an 8.9% CAGR to 2026-2031.
Note: Market size and forecast figures in this report are generated using Mordor Intelligence’s proprietary estimation framework, updated with the latest available data and insights as of January 2026.
Global Cut Flowers Market Trends and Insights
Drivers Impact Analysis*
| Driver | (~) % Impact on CAGR Forecast | Geographic Relevance | Impact Timeline |
|---|---|---|---|
| E-commerce-led year-round floral purchasing | +1.2% | Global, strongest in North America, Western Europe, and East Asia | Short term (≤ 2 years) |
| Weddings, gifting, and hospitality floral spend | +1.0% | Global, concentrated in North America, Europe, and Middle East | Medium term (2-4 years) |
| Cold-chain expansion in export hubs | +0.9% | Africa, especially Kenya and Ethiopia, and South America, especially Colombia and Ecuador | Short term (≤ 2 years) |
| Sustainability certification and premium sourcing | +0.7% | Global, with strongest regulatory pull in Europe and the United Kingdom | Medium term (2-4 years) |
| Genomics-led vase life improvement | +0.5% | Netherlands as the main research base, with spillover to Asia-Pacific and South America | Long term (≥ 4 years) |
| Digital auctions and Artificial Intelligence (AI)-enabled pricing | +0.6% | Netherlands first, then wider adoption across Asia-Pacific and South America | Medium term (2-4 years) |
| Source: Mordor Intelligence | |||
E-commerce-Led Year-Round Floral Purchasing
Online retail has altered the seasonality patterns of the cut flowers market. Previously, sales were concentrated around occasions such as Valentine’s Day, Mother’s Day, and Christmas. However, digital platforms now enable more consistent weekly and occasion-based purchasing. This shift in demand patterns enables growers to establish stable supply programs and maintain greenhouse operations year-round. According to the Trade Map data, in the United States, cut flower imports slightly increased to USD 2.72 billion in 2025 against USD 2.70 billion in 2024, driven in part by online ordering [1]Source: International Trade Centre, “Trade Map – Imports and Exports of Cut Flowers (HS Code 0603),” trademap.org. Farm-direct digital models have also streamlined the supply chain by eliminating several distribution steps, enhancing freshness, and enabling the market to serve florists and consumers more cost-effectively.
Weddings, Gifting, and Hospitality Floral Spend
Event-related purchases continue to represent a significant volume driver in the cut flowers market. Weddings, gifting, hotels, restaurants, and corporate events generate consistent demand for premium stems and customized arrangements. This segment is important as buyers in these contexts prioritize color consistency, precise timing, and presentation, enabling higher-value sourcing. Additionally, social media has popularized flower walls and large-scale installations in event design, significantly increasing stem usage per event compared to traditional arrangements. This trend keeps the cut flowers market closely tied to experience-driven spending, even during periods of reduced routine retail demand.
Cold-Chain Expansion in Export Hubs
Investment in cold-chain infrastructure is expanding the commercial reach of the cut flowers market. In March 2025, the Dutch Flower Group reported the transportation of over 320,000 rose stems in a refrigerated container from Kenya’s Naivasha Inland Container Depot to Rotterdam via rail and sea. This demonstrated that premium flowers could be transported through cost-effective routes, with sea freight reducing per-stem logistics costs and lowering carbon emissions by 80% to 90% compared to air cargo. These cost efficiencies are significant, as exporters in countries like Kenya, Colombia, and Ecuador face high logistics expenses as a substantial portion of the delivered cost. As these transportation routes develop further, the cut flowers market benefits from an expanded supply radius, supporting weekly retail and supermarket distribution programs.
Sustainability Certification and Premium Sourcing
Sustainability regulations are increasingly becoming a prerequisite for market access in the cut flowers industry. Royal FloraHolland has reinforced this trend by mandating Floriculture Sustainability Initiative certification for its auction members by July 2027[2]Source: Royal FloraHolland, “Certification according to FSI,” royalfloraholland.com. In Ethiopia, the Ethiopian Horticulture Producer Exporters Association, in collaboration with MPS, has aligned local standards with these environmental requirements across 50 member farms. This development benefits larger growers capable of handling audits, traceability, and input reporting, while exacerbating the compliance challenges faced by smaller players in the cut flowers market.
Restraints Impact Analysis*
| Restraint | (~) % Impact on CAGR Forecast | Geographic Relevance | Impact Timeline |
|---|---|---|---|
| Air-freight volatility and capacity shortages | -0.8% | Africa, especially Kenya and Ethiopia, and South America, especially Colombia and Ecuador | Short term (≤ 2 years) |
| Phytosanitary delays and compliance tightening | -0.5% | Global, with heightened pressure in European, United Kingdom, and United States import corridors | Medium term (2-4 years) |
| Water stress in equatorial highland farms | -0.4% | Kenya, Ethiopia, and Ecuador highlands | Long term (≥ 4 years) |
| Preserved and dried bouquet substitution | -0.3% | North America and Western Europe | Medium term (2-4 years) |
| Source: Mordor Intelligence | |||
Air-Freight Volatility and Capacity Shortages
Air freight volatility continues to challenge the cut flowers market, as premium flowers depend significantly on rapid cold-chain transportation to preserve quality and vase life. According to the International Air Transport Association, global air cargo demand rose by 5.5% in November 2025 compared to November 2024, while cargo capacity grew by only 4.7% during the same period [3]Source: International Air Transport Association, “Air Cargo Markets Continue Growth Momentum in November 2025,” iata.org. This slower capacity growth relative to freight demand has increased pressure on international logistics networks supporting time-sensitive agricultural exports. Flower exporters in Kenya, Ethiopia, and Colombia are particularly vulnerable to fluctuations in freight availability, as fresh flower shipments rely heavily on consistent temperature-controlled air cargo services.
Phytosanitary Delays and Compliance Tightening
Stricter border controls are increasing challenges in the cut flowers market. The implementation of revised European phytosanitary regulations in April 2025 has heightened inspection requirements for African rose imports due to the risk of False Codling Moth. These changes have introduced additional documentation, border inspections, and traceability standards, thereby narrowing the effective shipping window for perishable flowers. In response, Kenya is adopting ePhyto systems and artificial intelligence-based pest identification tools. However, the rollout of these systems requires time and significant investment. The trend indicates that the cut flowers market will encounter increased compliance demands across key import corridors.
*Our forecasts treat driver/restraint impacts as directional, not additive. The impact forecasts reflect baseline growth, mix effects, and variable interactions.
Segment Analysis
By Flower Type: Roses Lead, but Specialty Varieties Accelerate
The cut flowers market share for the roses segment led with the largest 38.2% in 2025. Roses continue to dominate the global flower trade due to their central role in gifting, weddings, hospitality, and organized retail bouquet programs across major consumption regions. Their standardized stem lengths, wide color availability, and compatibility with e-commerce distribution systems further support their leading position. Commercial rose cultivation benefits from established cold-chain logistics and extensive breeding programs that enhance vase life, transport durability, and visual quality. Additionally, strong export orientation from countries such as Ecuador, Colombia, Kenya, and the Netherlands reinforces roses as the dominant commercial category within global floriculture supply chains.
The cut flowers market size for the tulips segment is projected to grow at the fastest 9.4% CAGR from 2026 to 2031. Tulips are gaining commercial traction as retailers increasingly favor seasonal premium flowers with unique colors, shapes, and bouquet aesthetics. Additionally, growers are expanding the production of other flowers, including chrysanthemums, lilies, carnations, and alstroemeria, to meet diverse demand patterns across funeral arrangements, supermarkets, and luxury floral programs. Longer vase life and improved shelf performance are becoming critical for modern retail distribution channels. Innovations in breeding and gene-editing research are further strengthening premium flower categories by enhancing durability, disease resistance, and ornamental characteristics within high-value floriculture production systems globally.


Geography Analysis
Europe holds the largest segment, capturing the laregst 46.0% of the cut flowers market share in 2025. The region serves as the global trade center for cut flowers, with the Netherlands functioning as the primary international auction, logistics, and redistribution hub for European floriculture. Key markets such as Germany, the United Kingdom, and France drive robust retail and import demand through supermarkets, online flower platforms, and event floristry channels. Europe benefits from advanced cold-chain infrastructure, organized wholesale systems, and stringent quality-control standards, which support the trade of premium flowers. Additionally, sustainability requirements and traceability standards are increasingly shaping purchasing decisions across commercial flower distribution and retail operations within the regional floriculture industry.
Asia-Pacific is the fastest-growing region, forecast to expand at an 8.9% CAGR from 2026 to 2031. This growth is driven by factors such as rising urbanization, an increasing gifting culture, the expansion of organized floral retail, and higher domestic flower consumption in countries like China, India, and Southeast Asia. Investments in commercial greenhouses and floriculture modernization programs are enhancing production capabilities across the region. Countries such as Japan and South Korea continue to focus on premium flower quality and advanced cultivation technologies. Additionally, growing middle-class consumer spending and rising demand from the hospitality sector, weddings, and event decorations are boosting flower consumption in major metropolitan markets. Export-oriented floriculture production is also gradually increasing in select Asia-Pacific agricultural economies.
South America remains strategically important because Colombia and Ecuador continue supplying large volumes of export-oriented roses and carnations into North American and European markets. According to the ITC Trade Map data, the Netherlands exported USD 6.04 billion of cut flowers in 2025, compared to USD 5.22 billion in 2024, underscoring Europe’s central role in global flower trade and distribution. In Africa, countries such as Kenya and Ethiopia maintain a strong export focus, utilizing airfreight supply chains to serve European markets. Meanwhile, demand in the Middle East continues to grow, driven by luxury retail, hospitality projects, weddings, and event-related flower consumption. This demand is supported by regional re-export hubs and premium floral-import networks.

Competitive Landscape
The market structure remains uneven at the production level, although flower auctions, distribution networks, and breeding platforms are becoming increasingly concentrated among large international operators. Competitive positioning is now heavily influenced by logistics capabilities, breeding innovation, cold-chain management, and digital ordering systems. Smaller growers continue to operate extensively within production regions. However, organized retail and export programs are increasingly favoring suppliers that can provide traceability, consistent quality, and large-volume fulfillment across international floriculture supply chains.
Industry competition is shifting toward vertically integrated procurement, distribution, and direct-to-retail flower supply models. Wholesalers and floral distribution companies are expanding through acquisitions, logistics partnerships, and digital procurement platforms to enhance operational efficiency and delivery reliability. Cold-chain infrastructure and rapid fulfillment capabilities are becoming critical competitive advantages, as flower freshness directly impacts retail value and waste reduction. Online floral ordering platforms are also gaining influence by facilitating direct connections between growers, distributors, and retailers. Companies that integrate breeding, sourcing, transportation, and digital order management into a single coordinated platform are increasingly solidifying their long-term competitive position within global floriculture distribution networks and retail supply chains.
The competitive landscape increasingly favors companies with advanced auction systems, digital trading infrastructure, and integrated logistics coordination. According to Royal FloraHolland, the company implemented multi-transaction auctioning as the standard across major auction clocks in 2025, allowing up to eight simultaneous buyer transactions per auction stop. Digital procurement and automated trading systems are enhancing transaction speed, inventory visibility, and flower allocation efficiency across commercial distribution networks. Companies with robust logistics capabilities, breeding partnerships, and cold-chain infrastructure are strengthening their market position as floriculture supply chains become more digitally integrated and service-oriented on a global scale.
Recent Industry Developments
- January 2026: Mayesh Wholesale Florist has acquired Sooner Wholesale Florist, adding three locations in Oklahoma City, Tulsa, and Amarillo. This acquisition expands Mayesh's presence into Oklahoma and enhances its cut flower market coverage in Texas, offering customers access to its global product portfolio and online ordering platform.
- December 2025: BloomNation made a strategic partnership with Bellevue Roses, an Ecuadorian rose grower operating on Rainforest Alliance-certified farms. This partnership enables BloomNation's network of independent florists in the United States to access farm-direct cut flowers, shipped 4 to 5 days after cutting, ensuring fresher products compared to traditional wholesale channels.
- April 2024: The United Kingdom government has suspended the 8% tariff on cut flower imports from East Africa until June 2026. This suspension allows unlimited tariff-free flower exports routed through European hubs, including the Netherlands. The policy aims to strengthen trade ties with Kenya, Ethiopia, Rwanda, Tanzania, and Uganda, while enhancing export competitiveness for African cut flower growers.


Global Cut Flowers Market Report Scope
Cut flowers are flowers and flower buds that are harvested from plants primarily for decorative purposes and used in floral arrangements, bouquets, and ornamental displays. The cut flowers market report is segmented by flower type (roses, carnations, chrysanthemums, tulips, lilies, gerbera, alstroemeria, and other flower types) and by geography (North America, South America, Europe, Asia-Pacific, Middle East, and Africa). The report includes production analysis (volume), consumption analysis (value and volume), export analysis (value and volume), import analysis (value and volume), wholesale price trend analysis and forecast, and seasonality analysis. The market forecasts are provided in terms of value (USD) and volume (metric tons).
| Roses |
| Chrysanthemums |
| Carnations |
| Tulips |
| Lilies |
| Gerbera |
| Alstroemeria |
| Other Flower Types |
| North America | United States | Production Analysis | Production Volume | |
| Area Harvested and Yield | ||||
| Consumption Analysis (Value and Volume) | ||||
| Trade Analysis (Value and Volume) | Import Market Analysis | Import Value and Volume | ||
| Key Supplying Markets | ||||
| Export Market Analysis | Export Value and Volume | |||
| Key Destinations Markets | ||||
| Wholesale Price Trend Analysis and Forecast | ||||
| Seasonality Analysis | ||||
| Canada | Production Analysis | Production Volume | ||
| Area Harvested and Yield | ||||
| Consumption Analysis (Value and Volume) | ||||
| Import Value and Volume | ||||
| Key Supplying Markets | ||||
| Export Value and Volume | ||||
| Key Destinations Markets | ||||
| Wholesale Price Trend Analysis and Forecast | ||||
| Seasonality Analysis | ||||
| Mexico | Production Analysis | Production Volume | ||
| Area Harvested and Yield | ||||
| Consumption Analysis (Value and Volume) | ||||
| Import Value and Volume | ||||
| Key Supplying Markets | ||||
| Export Value and Volume | ||||
| Key Destinations Markets | ||||
| Wholesale Price Trend Analysis and Forecast | ||||
| Seasonality Analysis | ||||
| South America | Brazil | Production Analysis | Production Volume | |
| Area Harvested and Yield | ||||
| Consumption Analysis (Value and Volume) | ||||
| Import Value and Volume | ||||
| Key Supplying Markets | ||||
| Export Value and Volume | ||||
| Key Destinations Markets | ||||
| Wholesale Price Trend Analysis and Forecast | ||||
| Seasonality Analysis | ||||
| Colombia | Production Analysis | Production Volume | ||
| Area Harvested and Yield | ||||
| Consumption Analysis (Value and Volume) | ||||
| Import Value and Volume | ||||
| Key Supplying Markets | ||||
| Export Value and Volume | ||||
| Key Destinations Markets | ||||
| Wholesale Price Trend Analysis and Forecast | ||||
| Seasonality Analysis | ||||
| Ecuador | Production Analysis | Production Volume | ||
| Area Harvested and Yield | ||||
| Consumption Analysis (Value and Volume) | ||||
| Import Value and Volume | ||||
| Key Supplying Markets | ||||
| Export Value and Volume | ||||
| Key Destinations Markets | ||||
| Wholesale Price Trend Analysis and Forecast | ||||
| Seasonality Analysis | ||||
| Argentina | Production Analysis | Production Volume | ||
| Area Harvested and Yield | ||||
| Consumption Analysis (Value and Volume) | ||||
| Import Value and Volume | ||||
| Key Supplying Markets | ||||
| Export Value and Volume | ||||
| Key Destinations Markets | ||||
| Wholesale Price Trend Analysis and Forecast | ||||
| Seasonality Analysis | ||||
| Europe | Germany | Production Analysis | Production Volume | |
| Area Harvested and Yield | ||||
| Consumption Analysis (Value and Volume) | ||||
| Import Value and Volume | ||||
| Key Supplying Markets | ||||
| Export Value and Volume | ||||
| Key Destinations Markets | ||||
| Wholesale Price Trend Analysis and Forecast | ||||
| Seasonality Analysis | ||||
| Italy | Production Analysis | Production Volume | ||
| Area Harvested and Yield | ||||
| Consumption Analysis (Value and Volume) | ||||
| Import Value and Volume | ||||
| Key Supplying Markets | ||||
| Export Value and Volume | ||||
| Key Destinations Markets | ||||
| Wholesale Price Trend Analysis and Forecast | ||||
| Seasonality Analysis | ||||
| United Kingdom | Production Analysis | Production Volume | ||
| Area Harvested and Yield | ||||
| Consumption Analysis (Value and Volume) | ||||
| Import Value and Volume | ||||
| Key Supplying Markets | ||||
| Export Value and Volume | ||||
| Key Destinations Markets | ||||
| Wholesale Price Trend Analysis and Forecast | ||||
| Seasonality Analysis | ||||
| Asia Pacific | India | Production Analysis | Production Volume | |
| Area Harvested and Yield | ||||
| Consumption Analysis (Value and Volume) | ||||
| Import Value and Volume | ||||
| Key Supplying Markets | ||||
| Export Value and Volume | ||||
| Key Destinations Markets | ||||
| Wholesale Price Trend Analysis and Forecast | ||||
| Seasonality Analysis | ||||
| China | Production Analysis | Production Volume | ||
| Area Harvested and Yield | ||||
| Consumption Analysis (Value and Volume) | ||||
| Import Value and Volume | ||||
| Key Supplying Markets | ||||
| Export Value and Volume | ||||
| Key Destinations Markets | ||||
| Wholesale Price Trend Analysis and Forecast | ||||
| Seasonality Analysis | ||||
| Japan | Production Analysis | Production Volume | ||
| Area Harvested and Yield | ||||
| Consumption Analysis (Value and Volume) | ||||
| Import Value and Volume | ||||
| Key Supplying Markets | ||||
| Export Value and Volume | ||||
| Key Destinations Markets | ||||
| Wholesale Price Trend Analysis and Forecast | ||||
| Seasonality Analysis | ||||
| Middle East | Saudi Arabia | Production Analysis | Production Volume | |
| Area Harvested and Yield | ||||
| Consumption Analysis (Value and Volume) | ||||
| Import Value and Volume | ||||
| Key Supplying Markets | ||||
| Export Value and Volume | ||||
| Key Destinations Markets | ||||
| Wholesale Price Trend Analysis and Forecast | ||||
| Seasonality Analysis | ||||
| United Arab Emirates | Production Analysis | Production Volume | ||
| Area Harvested and Yield | ||||
| Consumption Analysis (Value and Volume) | ||||
| Import Value and Volume | ||||
| Key Supplying Markets | ||||
| Export Value and Volume | ||||
| Key Destinations Markets | ||||
| Wholesale Price Trend Analysis and Forecast | ||||
| Seasonality Analysis | ||||
| Africa | Ethiopia | Production Analysis | Production Volume | |
| Area Harvested and Yield | ||||
| Consumption Analysis (Value and Volume) | ||||
| Import Value and Volume | ||||
| Key Supplying Markets | ||||
| Export Value and Volume | ||||
| Key Destinations Markets | ||||
| Wholesale Price Trend Analysis and Forecast | ||||
| Seasonality Analysis | ||||
| By Flower Type | Roses | ||||
| Chrysanthemums | |||||
| Carnations | |||||
| Tulips | |||||
| Lilies | |||||
| Gerbera | |||||
| Alstroemeria | |||||
| Other Flower Types | |||||
| By Geography | North America | United States | Production Analysis | Production Volume | |
| Area Harvested and Yield | |||||
| Consumption Analysis (Value and Volume) | |||||
| Trade Analysis (Value and Volume) | Import Market Analysis | Import Value and Volume | |||
| Key Supplying Markets | |||||
| Export Market Analysis | Export Value and Volume | ||||
| Key Destinations Markets | |||||
| Wholesale Price Trend Analysis and Forecast | |||||
| Seasonality Analysis | |||||
| Canada | Production Analysis | Production Volume | |||
| Area Harvested and Yield | |||||
| Consumption Analysis (Value and Volume) | |||||
| Import Value and Volume | |||||
| Key Supplying Markets | |||||
| Export Value and Volume | |||||
| Key Destinations Markets | |||||
| Wholesale Price Trend Analysis and Forecast | |||||
| Seasonality Analysis | |||||
| Mexico | Production Analysis | Production Volume | |||
| Area Harvested and Yield | |||||
| Consumption Analysis (Value and Volume) | |||||
| Import Value and Volume | |||||
| Key Supplying Markets | |||||
| Export Value and Volume | |||||
| Key Destinations Markets | |||||
| Wholesale Price Trend Analysis and Forecast | |||||
| Seasonality Analysis | |||||
| South America | Brazil | Production Analysis | Production Volume | ||
| Area Harvested and Yield | |||||
| Consumption Analysis (Value and Volume) | |||||
| Import Value and Volume | |||||
| Key Supplying Markets | |||||
| Export Value and Volume | |||||
| Key Destinations Markets | |||||
| Wholesale Price Trend Analysis and Forecast | |||||
| Seasonality Analysis | |||||
| Colombia | Production Analysis | Production Volume | |||
| Area Harvested and Yield | |||||
| Consumption Analysis (Value and Volume) | |||||
| Import Value and Volume | |||||
| Key Supplying Markets | |||||
| Export Value and Volume | |||||
| Key Destinations Markets | |||||
| Wholesale Price Trend Analysis and Forecast | |||||
| Seasonality Analysis | |||||
| Ecuador | Production Analysis | Production Volume | |||
| Area Harvested and Yield | |||||
| Consumption Analysis (Value and Volume) | |||||
| Import Value and Volume | |||||
| Key Supplying Markets | |||||
| Export Value and Volume | |||||
| Key Destinations Markets | |||||
| Wholesale Price Trend Analysis and Forecast | |||||
| Seasonality Analysis | |||||
| Argentina | Production Analysis | Production Volume | |||
| Area Harvested and Yield | |||||
| Consumption Analysis (Value and Volume) | |||||
| Import Value and Volume | |||||
| Key Supplying Markets | |||||
| Export Value and Volume | |||||
| Key Destinations Markets | |||||
| Wholesale Price Trend Analysis and Forecast | |||||
| Seasonality Analysis | |||||
| Europe | Germany | Production Analysis | Production Volume | ||
| Area Harvested and Yield | |||||
| Consumption Analysis (Value and Volume) | |||||
| Import Value and Volume | |||||
| Key Supplying Markets | |||||
| Export Value and Volume | |||||
| Key Destinations Markets | |||||
| Wholesale Price Trend Analysis and Forecast | |||||
| Seasonality Analysis | |||||
| Italy | Production Analysis | Production Volume | |||
| Area Harvested and Yield | |||||
| Consumption Analysis (Value and Volume) | |||||
| Import Value and Volume | |||||
| Key Supplying Markets | |||||
| Export Value and Volume | |||||
| Key Destinations Markets | |||||
| Wholesale Price Trend Analysis and Forecast | |||||
| Seasonality Analysis | |||||
| United Kingdom | Production Analysis | Production Volume | |||
| Area Harvested and Yield | |||||
| Consumption Analysis (Value and Volume) | |||||
| Import Value and Volume | |||||
| Key Supplying Markets | |||||
| Export Value and Volume | |||||
| Key Destinations Markets | |||||
| Wholesale Price Trend Analysis and Forecast | |||||
| Seasonality Analysis | |||||
| Asia Pacific | India | Production Analysis | Production Volume | ||
| Area Harvested and Yield | |||||
| Consumption Analysis (Value and Volume) | |||||
| Import Value and Volume | |||||
| Key Supplying Markets | |||||
| Export Value and Volume | |||||
| Key Destinations Markets | |||||
| Wholesale Price Trend Analysis and Forecast | |||||
| Seasonality Analysis | |||||
| China | Production Analysis | Production Volume | |||
| Area Harvested and Yield | |||||
| Consumption Analysis (Value and Volume) | |||||
| Import Value and Volume | |||||
| Key Supplying Markets | |||||
| Export Value and Volume | |||||
| Key Destinations Markets | |||||
| Wholesale Price Trend Analysis and Forecast | |||||
| Seasonality Analysis | |||||
| Japan | Production Analysis | Production Volume | |||
| Area Harvested and Yield | |||||
| Consumption Analysis (Value and Volume) | |||||
| Import Value and Volume | |||||
| Key Supplying Markets | |||||
| Export Value and Volume | |||||
| Key Destinations Markets | |||||
| Wholesale Price Trend Analysis and Forecast | |||||
| Seasonality Analysis | |||||
| Middle East | Saudi Arabia | Production Analysis | Production Volume | ||
| Area Harvested and Yield | |||||
| Consumption Analysis (Value and Volume) | |||||
| Import Value and Volume | |||||
| Key Supplying Markets | |||||
| Export Value and Volume | |||||
| Key Destinations Markets | |||||
| Wholesale Price Trend Analysis and Forecast | |||||
| Seasonality Analysis | |||||
| United Arab Emirates | Production Analysis | Production Volume | |||
| Area Harvested and Yield | |||||
| Consumption Analysis (Value and Volume) | |||||
| Import Value and Volume | |||||
| Key Supplying Markets | |||||
| Export Value and Volume | |||||
| Key Destinations Markets | |||||
| Wholesale Price Trend Analysis and Forecast | |||||
| Seasonality Analysis | |||||
| Africa | Ethiopia | Production Analysis | Production Volume | ||
| Area Harvested and Yield | |||||
| Consumption Analysis (Value and Volume) | |||||
| Import Value and Volume | |||||
| Key Supplying Markets | |||||
| Export Value and Volume | |||||
| Key Destinations Markets | |||||
| Wholesale Price Trend Analysis and Forecast | |||||
| Seasonality Analysis | |||||


Key Questions Answered in the Report
What is the size of the global cut flowers market in 2026?
The cut flowers market is estimated at USD 40.58 billion in 2026.
Which region leads global cut flower demand and trade?
Europe leads with the largest 46.0% of the cut flower market share in 2025.
Which flower type has the strongest position worldwide?
Roses led with the largest 38.2% cut flower market share in 2025.
What are the main risks affecting growers and exporters?
Air-freight volatility, stricter phytosanitary regulations, water scarcity in highland growing regions, and increased substitution with preserved products are the primary challenges.
Page last updated on:


