
Netherlands Floriculture Market Analysis by Mordor Intelligence
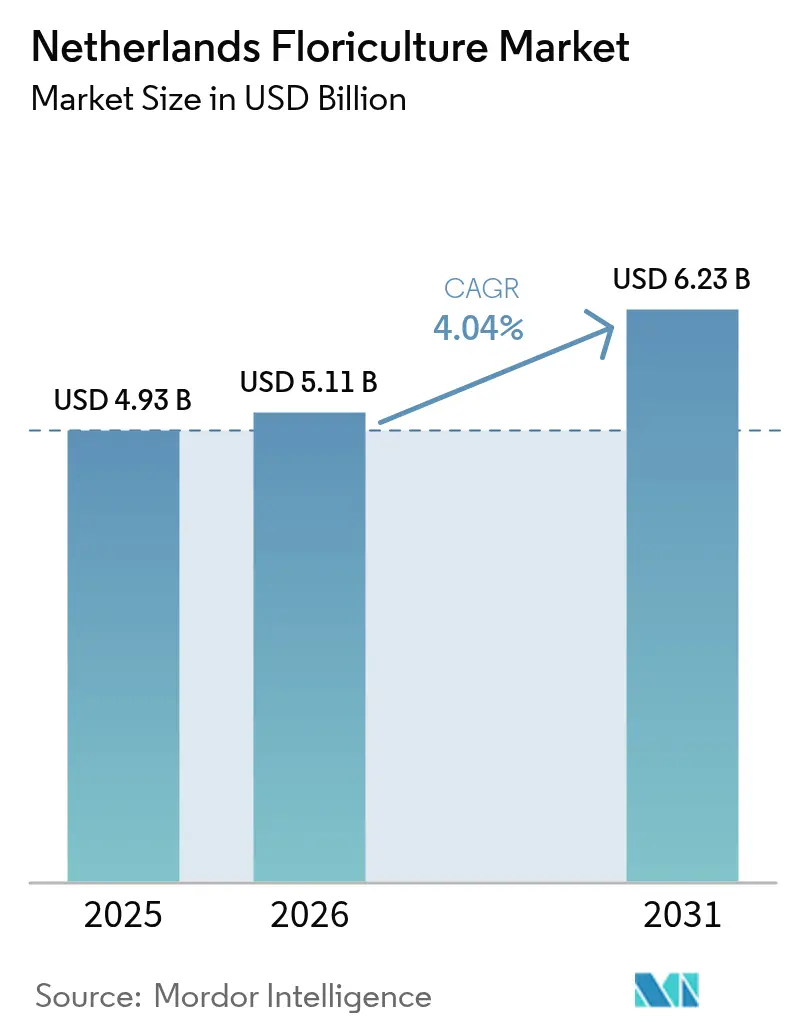
The Netherlands floriculture market size is projected to expand from USD 4.93 billion in 2025 and USD 5.11 billion in 2026 to USD 6.23 billion by 2031, registering a CAGR of 4.04% between 2026 and 2031. The focus is transitioning from pure auction throughput to digitally enabled supply chains that prioritize traceable provenance, sustainability certifications, and closer connections with buyers. These supply chains are increasingly leveraging advanced technologies to ensure transparency and efficiency, meeting the growing demand for sustainable and ethically sourced products. Exports of ornamental products have risen, reinforcing the country’s established position as Europe’s consolidation and re-export hub. This growth highlights the Netherlands' strategic importance in the global floriculture trade, driven by its robust infrastructure and expertise. Royal FloraHolland achieved profitability in 2024 by reducing energy costs and enhancing operational efficiency across its three auction hubs, demonstrating the industry's overall resilience. This turnaround reflects the effectiveness of cost management strategies and operational improvements in maintaining competitiveness. Vertical integration, contract farming in cost-effective regions, and the increased adoption of LED technology are further reshaping competitive dynamics within the Netherlands floriculture market.
Key Report Takeaways
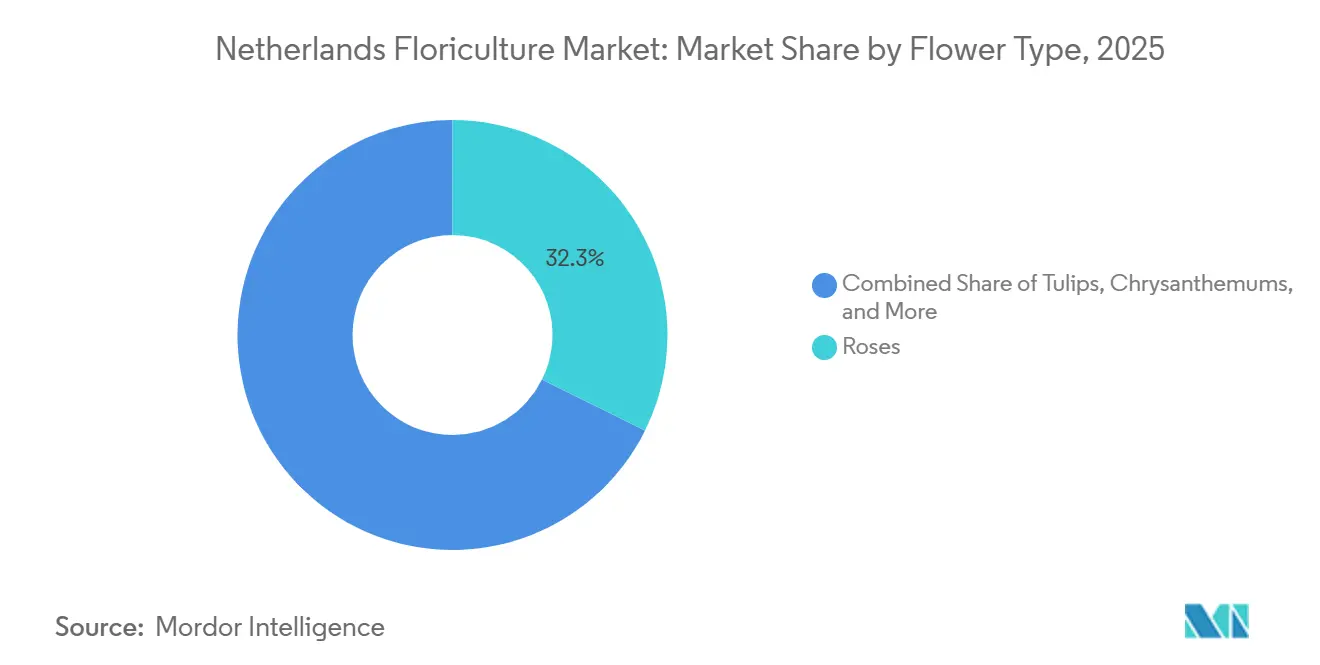
- By flower type, roses accounted for 32.3% of the Netherlands floriculture market share in 2025, and orchids are projected to record the fastest expansion, advancing at a 4.1% CAGR through 2031.
Note: Market size and forecast figures in this report are generated using Mordor Intelligence’s proprietary estimation framework, updated with the latest available data and insights as of 2026.
Netherlands Floriculture Market Trends and Insights
Drivers Impact Analysis*
| Driver | (~) % Impact on CAGR Forecast | Geographic Relevance | Impact Timeline |
|---|---|---|---|
| Rising cut-flower re-export volumes | +0.6% | Europe, and Middle East | Medium term (2–4 years) |
| Expansion of climate-smart cultivation clusters | +0.5% | National, spillover to Belgium and Germany | Long term (≥4 years) |
| Growth in energy-efficient supplemental LED lighting | +0.4% | Westland and Aalsmeer regions | Short term (≤2 years) |
| Digital auction integration with blockchain payment | +0.5% | Global buyers anchored in the Netherlands | Medium term (2–4 years) |
| Surge in farm-level robotics for harvesting | +0.3% | Large greenhouse clusters | Long term (≥4 years) |
| Growth of floriculture contract-farming in Eastern Europe | +0.4% | Poland and Romania | Medium term (2–4 years) |
| Source: Mordor Intelligence | |||
Rising Cut-Flower Re-Export Volumes
The gateway function remains pivotal to the Netherlands floriculture market. Imports of roses climbed to USD 735.13 million in 2024, while outbound shipments reached USD 904 million in the twelve months to July 2025[1]Source: Global Trade Atlas Intelligence Center, “Netherlands rose export data,” gtaic.com. Royal FloraHolland’s cold-chain backbone enables the consolidation of Kenyan, Ethiopian, and South American stems, which reach German and French distribution centers within 1 day of arrival. Large trading houses now run dedicated air-freight facilities that pre-grade and route stems directly into retail-ready packs, compressing handling steps and extending vase life. Margin now accrues from orchestration expertise rather than domestic production volume. Buyers in Poland and the Nordic region increasingly tap the Dutch hub for quick-turn seasonal promotions, which lifts throughput without swelling local acreage. The virtuous cycle sustains auction liquidity and reinforces Amsterdam-Schiphol’s status as Europe’s flower gateway.
Expansion of Climate Smart Cultivation Clusters
Autonomous greenhouse pilots led by Wageningen University demonstrated energy savings and yield parity with conventional control systems in 2025 trials. Clustered complexes in Westland share carbon dioxide capture and district heating, reducing per-unit emissions and shielding growers from volatile gas prices that eroded margins in 2023. Partnerships among substrate provider Grodan, LED pioneer Philips, and grower consortia validate gains in rose stem length and water cuts when recirculating irrigation is paired with inter-lighting. Government grants for geothermal pilots and rooftop photovoltaics further de-risk capital outlays. Knowledge distilled in these clusters is already being transferred to satellite projects in Belgium and North Rhine-Westphalia, extending the Netherlands floriculture market technology footprint well beyond national borders.
Digital Auction Integration with Blockchain Payment
Floriday processed a significant volume of direct transactions during the year, representing the vast majority of all direct deliveries. The platform combines clock auctions, spot offers, and standing orders into a unified stream, enabling buyers to access timely information on price, grade, and delivery windows. A pilot blockchain system has significantly reduced settlement times, shortening the process from several days to just one day, while also creating secure and unalterable provenance records that meet the traceability standards set by the Floriculture Sustainability Initiative. Marginpar leverages Floriday Daytrade to maintain a continuous inventory, facilitating smaller minimum orders that cater to sudden demand surges, even beyond regular auction hours. Although a small proportion of flower purchases currently occur through the platform, the onboarding of more growers is projected to amplify network effects, gradually influencing procurement practices across the Netherlands floriculture market.
Surge in Farm Level Robotics for Harvesting
Robotic prototypes equipped with computer vision are now being used to trim roses and gerberas in pilot facilities, addressing labor shortages that have significantly impacted growers during peak seasons. Companies such as Priva and Certhon offer mobile harvest platforms integrated with climate and fertigation control systems, enabling a single operator to manage tasks that previously required multiple workers. Modular robotic arms can be retrofitted into existing bays at mid-sized facilities, eliminating the need for new infrastructure investments. Early adopters have reported considerable labor savings on repetitive tasks such as cutting and bunching. However, achieving full automation for all flower types is anticipated to take several more years due to the wide variations in stem geometry and the delicate nature of petals. Despite these challenges, ongoing advancements position the Netherlands floriculture market as an important testing ground for horticultural robotics on a global scale.
Restraints Impact Analysis*
| Restraint | (~) % Impact on CAGR Forecast | Geographic Relevance | Impact Timeline |
|---|---|---|---|
| Skilled-labor shortages during peak harvest weeks | −0.5% | Westland and Aalsmeer | Short term (≤2 years) |
| Tightened phytosanitary rules from high-value Asian markets | −0.4% | China, Japan, Taiwan, and South Korea | Medium term (2–4 years) |
| Escalating water use fees in drought-prone polders | −0.3% | South Holland, and North Brabant | Medium term (2–4 years) |
| Rising sustainability certification costs | −0.3% | Nationwide, and export-oriented growers | Short term (≤2 years) |
| Source: Mordor Intelligence | |||
Tightened Phytosanitary Rules from High Value Asian Markets
Detections of Scirtothrips species in late 2025 triggered extra inspections and declarations for floriculture exports to China, Japan, and Taiwan[2]Source: Netherlands Food and Consumer Product Safety Authority, “Thrips detections 2025,” nvwa.nl . Taiwan’s quarantine update in July 2024 imposed compulsory treatments for propagation material, raising compliance costs by up to USD 1,050 per shipment[3]Source: Bureau of Animal and Plant Health Inspection, “Quarantine updates 2024,” aphia.gov.tw . Cold treatment or fumigation can delay consignments by two to three days, eroding vase life and retail appeal. Smaller firms lacking in-house diagnostics often exit Asian markets entirely rather than absorb administrative overhead. As premium Asian buyers pay above European prices for tulip bulbs and specialty roses, any traffic loss dents potential upside for the Netherlands floriculture market.
Escalating Water Use Fees in Drought Prone Polders
Regional water boards have significantly increased irrigation fees over recent years, with notable rises observed between 2023 and 2025. Prolonged drought conditions over consecutive years have led to saline intrusion into coastal polders, prompting stricter limits on water extraction. The adoption of closed-loop recycling systems has helped reduce water use substantially, though these systems require substantial investment for per-hectare retrofitting. The Water Framework Directive, introduced in 2024, sets a stringent target for water reuse, requiring a high percentage of recycling by the end of the decade, with financial penalties imposed for non-compliance. In response to these challenges, some growers have opted to relocate their operations to neighboring countries such as Belgium and Germany, where water availability is more dependable, leading to a slight shift in activity away from the primary floriculture market in the Netherlands.
*Our forecasts treat driver/restraint impacts as directional, not additive. The impact forecasts reflect baseline growth, mix effects, and variable interactions.
Segment Analysis
By Flower Type Roses Anchor Re Export Flows and Orchids Capture Premium Retail Demand
Roses are the largest flower type and accounting for 32.3% of the Netherlands floriculture market size in 2025, powered by the country’s unmatched logistics platform that grades and redistributes African and South American stems within a day of arrival. Domestic growers pivot toward specialty colors and extended vase-life cultivars that command retail premiums and justify rising labor rates. Continuous import waves buffer seasonal gaps, preserving auction liquidity and cementing roses as the anchor revenue stream throughout the Netherlands floriculture market. Tulips, chrysanthemums, and gerberas offer important shoulder-season diversity, yet their combined value still trails the dominance of roses.
Orchids are projected to expand at a 4.1% CAGR to 2031, the fastest pace among tracked flower types. Retail price points per plant deliver higher gross margins than cut bouquets, a profile that resonates with German and Austrian supermarkets seeking durable gift items. Dutch mastery of controlled environment cultivation helps maintain year-round quality, lengthening supply windows and shrinking perishability risk. Wageningen breeders are launching compact varieties with novel hues that appeal to younger consumers prioritizing sustainability and longevity. As shopper preferences tilt toward low-maintenance decor, orchids will steadily increase their market share in the Netherlands floriculture market, especially through direct-to-consumer ecommerce channels that bypass the traditional auction clock.



Geography Analysis
The Netherlands exported a significant value in ornamental products in 2025, with Germany as the largest importer, accounting for nearly one-third of total exports. France and the United Kingdom followed as other major destinations. Supermarket chains, including Edeka and Rewe, expanded their floral sections and adopted retail-ready packaging, ensuring steady, reliable demand for these products. In the previous year, the European Union exported a substantial amount of flower bulbs, with the Netherlands contributing the vast majority, underscoring its dominant position in tulip and lily genetics. Efficient and frequent truck routes from Aalsmeer to distribution centers in Central Europe ensure tight order cycles, further solidifying the Netherlands' leadership in the European floriculture market.
Retail chains refreshed assortments with mixed bouquets and promotional campaigns timed for Women’s Day and Easter, sparking impulse sales. Dutch traders run scouting missions to sign contract farms in Poland and Romania, offloading energy-intensive production while guaranteeing the European Union's quality certification. Eastern Europe thus acts both as a growth market and a low-cost supply location, a dual role that diversifies and buffers the Netherlands floriculture market performance.
Asia presents high value but stringent barriers. The Netherlands Food and Consumer Product Safety Authority instituted extra thrips inspections for China, Japan, and Taiwan after late 2025 pest detections. Despite friction, premium Asian buyers pay more above European wholesale for certified tulip bulbs and specialty roses, giving motivated operators a lucrative, albeit regulated, outlet. Middle Eastern hubs such as Dubai continue to bridge cargo into South Asia and Africa, ensuring the Netherlands floriculture market retains a global reach even as regional dynamics evolve.
Regulatory Landscape
The Netherlands floriculture market operates under a mix of EU plant health rules and national enforcement, with supervision centered on phytosanitary controls and pesticide-use compliance across greenhouse-grown and traded ornamentals. The Netherlands Food and Consumer Product Safety Authority (NVWA) applies risk-based oversight for the floriculture chain, while specialized inspection bodies support compliance across sub-sectors, including BKD (flower bulbs), Naktuinbouw (horticultural and forestry crops), NAK (agricultural crops), and KCB (plants and plant products).
Enforcement intensity increased with NVWA reporting in February 2026 that only 39% of 71 randomly selected greenhouse cut-flower growers inspected during 2024 and 2025 complied with crop-protection rules, with breaches ranging from incorrect dosages to unauthorized products. Exporters also face tighter import requirements in key destinations after late-2025 thrips detections, which triggered additional inspection and declaration requirements for shipments to markets such as China, Japan, and Taiwan, raising the compliance burden and increasing the importance of diagnostics, traceability, and treatment protocols in day-to-day trade.
Value Chain Analysis
The Netherlands floriculture value chain is built around a high-throughput trading and logistics system that combines domestic greenhouse production with large import flows from Africa and South America, then consolidates and re-exports into Europe and beyond. Energy and labor constraints increasingly shape cultivation decisions, driving adoption of LED lighting, closed-loop irrigation, and automation pilots, while breeders and propagation specialists supply proprietary genetics that help maintain premium positioning.
Aggregation and price discovery remain anchored in the Royal FloraHolland ecosystem, which links physical auction hubs to the Floriday digital marketplace for clock trading and direct contracting. In 2025, Royal FloraHolland reported product turnover of EUR 5.4 billion, reinforcing the scale of the cooperative layer that matches growers, traders, and retail buyers. Downstream, exporters and bouquet makers rely on cold-chain handling, grading, and retail-ready packing to compress handling steps and meet supermarket-driven specifications in markets such as Germany, France, and the United Kingdom, supported by short order cycles from hubs like Aalsmeer. Digitalization and pre-auction preparation tools in Floriday, along with sustainability requirements and audit readiness, increasingly influence which growers and trading houses can access the most liquid channels and lowest-friction routes to market.
Competitive Landscape
Royal FloraHolland manages a significant amount of domestic throughput, funneling product through its auction clock and Floriday digital channel. Direct contracting by integrated players accounts for the balance, creating a hybrid system that moderates price swings while still pressuring the auction model. In recent years, the number of greenhouse cut-flower companies in the Netherlands has declined significantly, particularly over the past two decades. This decrease has been attributed to the growing importance of economies of scale in areas such as climate control, LED lighting, and labor management. According to Verdant Partners, a majority of family business owners over 50 lack clear succession plans, creating opportunities for private equity firms and strategic buyers to enter the market.
Technology adoption splits winners from laggards. Marginpar shifted its entire catalog onto Floriday Daytrade in February 2026, capturing after-hours demand and smoothing inventory rotation. Dümmen Orange restructured in mid-2024, secured new capital, and inked a collaboration agreement with Beekenkamp to focus on proprietary genetics rather than commodity stems. Smaller specialists like Hoorn Bloom Masters align with Polish grocers to place ready-to-gift bouquets near store entrances, converting foot traffic into incremental volume.
Regulation further catalyzes consolidation. Mandatory Floriculture Sustainability Initiative certification by 2027 channels smaller operators toward acquisition or exit because audit costs bite disproportionately at low scale. Private equity funds scout for turnkey greenhouse assets equipped with LED and climate automation, willing to pay premiums for compliance-ready facilities. Consequently, the Netherlands floriculture market marches toward moderate concentration, where data-driven, capital-rich entities capture ascendant share while the traditional, fragmented base recedes.
Market Opportunities and Future Outlook
Opportunities are emerging as trading shifts from volume-led cut-flower sales toward higher-value, specification-driven assortments and plants, supported by faster ordering, improved traceability, and differentiated genetics. Trade data for early 2026 shows this split clearly: Dutch floriculture export value in Q1 2026 was nearly EUR 2.1 billion, with cut-flower export value down 3.5% while plant exports rose 5% in both volume and value, indicating space for operators with stronger plant assortments, durable formats such as orchids, and retail-ready supply programs.
A second opportunity area centers on measurable sustainability and labor productivity gains, where industry bodies and research institutions translate roadmaps into funded programs. In May 2026, AVAG/Hortivation, TNO, Wageningen University and Research, Club van 100, and Glastuinbouw Nederland advanced the Dutch Horti Power innovation agenda toward concrete projects targeted to start in 2027, backed by co-financing totaling EUR 27 million and supported by the Ministry of Economic Affairs and the Ministry of Agriculture, Fisheries, Food Security and Nature. This pipeline aligns with grower priorities already visible in the market, including AI-enabled cultivation control, robotics to address peak-season labor shortages, and emission and residue reduction that supports access to tightly regulated export destinations.
Recent Industry Developments
- May 2026: Dummenn Orange and Syngenta Flowers signed a formal agreement to establish a joint venture combining breeding portfolios and R&D capabilities, subject to regulatory approval. The tie-up targets scale advantages in genetics and pipeline development, reinforcing consolidation trends among IP-driven suppliers in the Netherlands-centered floriculture ecosystem.
- April 2026: Bas van Mourik and Rooth Invest completed a management buy-in acquisition of Van Wordragen Flowers, a Dutch chrysanthemum grower. The deal supports scaling and professionalization at the grower level, reflecting ongoing consolidation pressure from energy, labor, and compliance demands.
- May 2024: Dummenn Orange restructured and secured new capital, then entered a collaboration agreement with Beekenkamp to emphasize proprietary genetics over commodity stems. The move strengthened focus on breeding and differentiated varieties, supporting margin defense as digital trading and sustainability compliance raise competitive requirements across the chain.


Research Methodology Framework and Report Scope
Market Definition and Coverage
This market is defined as the total value generated from floriculture output that is produced, traded, and consumed in the Netherlands, covering cut flowers and ornamental plants that move through auctions and direct channels.
Scope exclusions: Landscaping services, garden tools, and non-ornamental edible crops are excluded to avoid mixing farm output value with downstream service revenue.
Segmentation Overview
- By Flower Type
- Roses
- Production Analysis
- Overview
- Area Harvested and Yield
- Consumption Analysis (Value and Volume)
- Trade Analysis (Value and Volume)
- Import Market Analysis
- Overview
- Key Supplying Markets
- Export Market Analysis
- Overview
- Key Destination Markets
- Import Market Analysis
- Wholesale Price Trend Analysis and Forecast
- Seasonality Analysis
- Production Analysis
- Tulips
- Production Analysis
- Overview
- Area Harvested and Yield
- Consumption Analysis (Value and Volume)
- Trade Analysis (Value and Volume)
- Import Market Analysis
- Overview
- Key Supplying Markets
- Export Market Analysis
- Overview
- Key Destination Markets
- Import Market Analysis
- Wholesale Price Trend Analysis and Forecast
- Seasonality Analysis
- Production Analysis
- Chrysanthemums
- Production Analysis
- Overview
- Area Harvested and Yield
- Consumption Analysis (Value and Volume)
- Trade Analysis (Value and Volume)
- Import Market Analysis
- Overview
- Key Supplying Markets
- Export Market Analysis
- Overview
- Key Destination Markets
- Import Market Analysis
- Wholesale Price Trend Analysis and Forecast
- Seasonality Analysis
- Production Analysis
- Gerberas
- Production Analysis
- Overview
- Area Harvested and Yield
- Consumption Analysis (Value and Volume)
- Trade Analysis (Value and Volume)
- Import Market Analysis
- Overview
- Key Supplying Markets
- Export Market Analysis
- Overview
- Key Destination Markets
- Import Market Analysis
- Wholesale Price Trend Analysis and Forecast
- Seasonality Analysis
- Production Analysis
- Lilies
- Production Analysis
- Overview
- Area Harvested and Yield
- Consumption Analysis (Value and Volume)
- Trade Analysis (Value and Volume)
- Import Market Analysis
- Overview
- Key Supplying Markets
- Export Market Analysis
- Overview
- Key Destination Markets
- Import Market Analysis
- Wholesale Price Trend Analysis and Forecast
- Seasonality Analysis
- Production Analysis
- Orchids
- Production Analysis
- Overview
- Area Harvested and Yield
- Consumption Analysis (Value and Volume)
- Trade Analysis (Value and Volume)
- Import Market Analysis
- Overview
- Key Supplying Markets
- Export Market Analysis
- Overview
- Key Destination Markets
- Import Market Analysis
- Wholesale Price Trend Analysis and Forecast
- Seasonality Analysis
- Production Analysis
- Roses
Data Sources, Market Sizing, and Validation
Desk Research
Desk research was used to set the factual base for volumes, trade, and price direction before any modeling choices were locked. We relied on public statistics and sector reporting such as Statistics Netherlands (CBS), UN Comtrade, Eurostat, FAOSTAT, and Wageningen University and Research publications, which anchor production, import-export flows, and unit trends.
On top of that, we reviewed association and market infrastructure disclosures, such as auction and grower body publications, along with company annual reports, investor presentations, and credible press coverage, to understand channel shifts and seasonality. Where there were gaps on company revenues or trade mix, we used paid subscriptions focused on company financials and market intelligence, plus shipment-level import-export databases and patent databases to sanity-check technology and capacity signals. The sources listed here are illustrative, and many other public references were also used for data collection, cross-checking, and clarification.
Primary Interviews and Surveys
Primary work focused on validating pricing logic and channel behavior in the Netherlands, since flower prices and volumes can change by season and by auction dynamics. We spoke with growers, exporters, wholesalers, logistics stakeholders, and retail-side buyers to confirm assumptions on product mix, contract versus spot sales, and how sustainability and traceability requirements affect realized pricing across the year.
Distribution of primary research fieldwork respondents
| Company type | Respondent position |
|---|---|
| Top tier: 26% | CXOs: 16% |
| Mid tier: 56% | Functional/Unit leaders: 38% |
| Smaller Players: 18% | Managers: 46% |
Market-Sizing & Forecasting
Sizing starts with a top-down build where national production and trade data are reconstructed into a Netherlands demand and throughput pool, then translated into value using wholesale price trends. Since flowers are highly seasonal, we treat the price input as a blended annual realized level, not a single point quotation, so the value line stays comparable year to year.
The model is then corroborated with selective bottom-up approximations, such as sample checks of auction and direct channel volumes multiplied by average selling prices, followed by supplier and exporter revenue reasonability checks. Key inputs used in the model include export and import values, production volumes (metric tons where available), wholesale price trend direction, product mix across major flower types, and channel mix between auction and direct-to-buyer flows. For forecasting, scenario analysis is used to reflect different paths for energy and greenhouse operating costs, sustainability compliance, and demand strength from core European destinations, and these scenarios are adjusted using what industry respondents expect for pricing and volume over the next few seasons.
Data Validation & Update Cycle
Outputs are validated through triangulation across trade values, production signals, and price direction checks so that one unusual series does not overly drive the total. When a variance is spotted, we re-check currency conversion timing, unit consistency, and whether a sudden shift is explained by seasonality, channel movement, or one-off disruptions.
Before sign-off, the model and assumptions go through a multi-step analyst review so outliers and double counts get removed. The report is refreshed annually, and interim updates are triggered when there are material shifts in trade, pricing, or regulation that can move the market value meaningfully. Right before delivery, one more pass is completed to ensure the newest public releases are reflected in the final numbers.
Mordor Intelligence's Netherlands Floriculture Market Size Compared Against Other Published Estimates
It is normal to see different market sizes for the same floriculture topic, even when the country and time period look similar. In our experience, the spread usually comes from how each publisher treats price averaging across seasonal peaks, how trade and re-export flows are handled, and whether the latest year has been refreshed after new customs and production releases.
When refresh cadence and currency timing are treated carefully, the value line stays tied to what the Netherlands actually ships and sells across the year, which is the logic applied in the latest update by Mordor Intelligence. Other estimates can also differ when they mix retail spending with farmgate or wholesale value, or when they assume a faster ASP climb without validating it against wholesale price trend series and channel feedback.
Benchmark comparison
| Source | Market Size | Gaps in Research Methodology |
|---|---|---|
| Mordor Intelligence | USD 4.93 B (2025) | |
| Industry Marketplace A | USD 4.92 B (2025) | Uses a near-identical year and scope but shows small variance that can come from different currency conversion cutoffs and how seasonal wholesale prices are averaged across product types. |
| Global Insights Firm B | USD 5.41 B (2026) | Starts from a later year and applies a broader product and channel frame that can blend additional ornamental categories and longer-horizon pricing assumptions, which lifts the starting value versus a shorter, trade-validated sizing base. |
Overall, the comparison shows that small differences are often timing-driven, while larger differences usually reflect a wider scope or a more aggressive price path. By keeping the value build traceable to production and trade signals, and by pressure-testing ASP assumptions with seasonality and channel checks, the final size stays transparent and repeatable.


Key Questions Answered in the Report
How large will Netherlands floriculture market size become by 2031?
It is forecast to reach USD 6.23 billion by 2031, growing at a 4.04% CAGR from 2026.
Which flower type currently leads sales in Netherlands floriculture market?
Roses dominate with a 32.3% share of 2025 value, benefiting from the country’s re-export logistics.
Why are orchids growing faster than other segments?
Phalaenopsis orchids command premium retail prices, have longer shelf life, and suit controlled environment production, driving a projected 4.1% CAGR to 2031.
What digital platform is reshaping buying behavior?
Royal FloraHolland’s Floriday marketplace integrates auction prices with direct orders and processed USD 2.3 billion in 2023 transactions.
How are Dutch growers coping with labor shortages?
They invest in harvest robotics, sign year-round contracts with core crews, and shift some production to contract farms in Poland and Romania.
Page last updated on:




