Asia-Pacific Orange Market Analysis by Mordor Intelligence
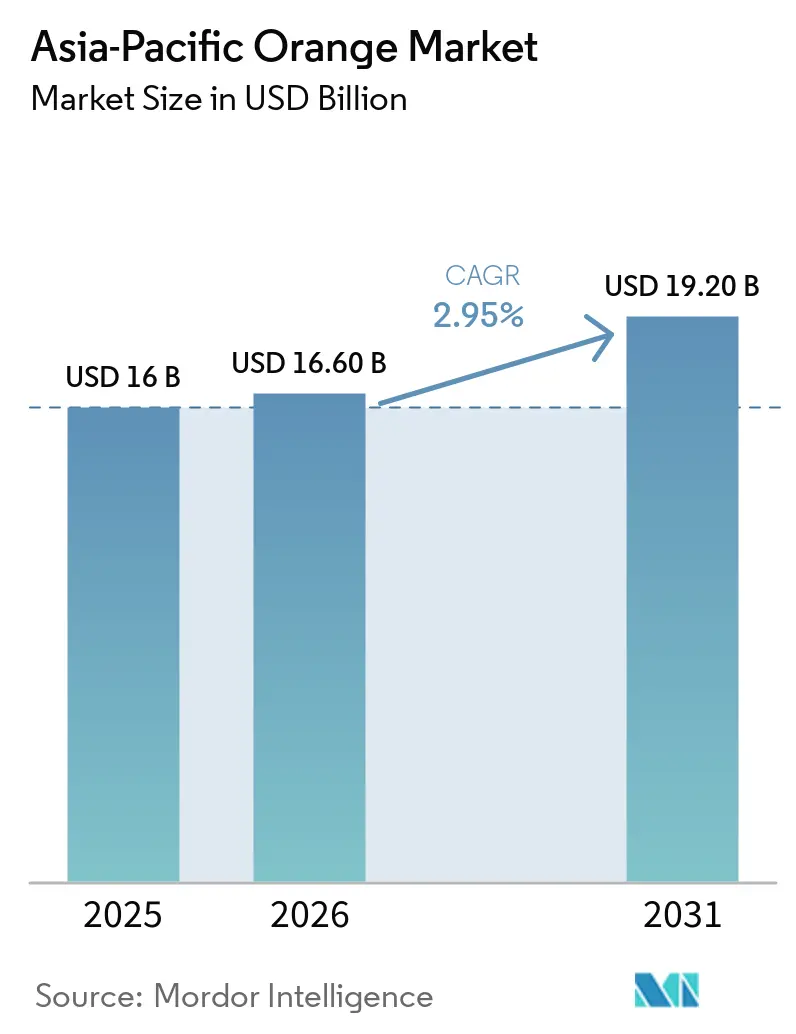
The Asia-Pacific orange market size is valued at USD 16 billion in 2025 and is anticipated to grow from USD 16.6 billion in 2026 to USD 19.2 billion by 2031 at a 2.95% CAGR over 2026-2031. Consumption shifts, processing investments, and varietal upgrades are redrawing the regional citrus map. China still dominates production yet faces biological threats that divert investment toward protected cultivation and integrated pest management. India is accelerating plantings in Maharashtra and Telangana, supported by the world’s largest single-site orange processor that opened in 2025. Australia has leveraged high-density orchards and drip irrigation to sustain exports despite chronic water scarcity. Parallel growth in cross-border e-commerce and blockchain traceability shortens supply chains, improving farm-gate margins and encouraging quality upgrades among smallholders.
Key Report Takeaways
- By geography, China accounted for the largest share of 48.50% in the Asia-Pacific Orange market size in 2025, whereas India is set to expand at the fastest 5.10% CAGR during 2026-2031.
Note: Market size and forecast figures in this report are generated using Mordor Intelligence’s proprietary estimation framework, updated with the latest available data and insights as of January 2026.
Asia-Pacific Orange Market Trends and Insights
Drivers Impact Analysis*
| Driver | (~) % Impact on CAGR Forecast | Geographic Relevance | Impact Timeline |
|---|---|---|---|
| Rising processed-juice capacity additions across China and India | +0.8% | China and India, with spillover to Pakistan and Vietnam | Medium term (2-4 years) |
| Shift to high-density and protected orchards, cutting unit costs | +0.6% | Australia, China, and Japan | Long term (≥ 4 years) |
| Government export rebates and cold-chain incentives for premium orange shipments from Australia and Pakistan | +0.5% | Australia, Indonesia, and Pakistan | Medium term (2-4 years) |
| Expansion of e-commerce produce platforms is boosting farmer margins | +0.4% | China and India | Short term (≤ 2 years) |
| Adoption of blockchain-based traceability by Chinese packers | +0.3% | China and Thailand | Medium term (2-4 years) |
| Climate-resilient Valencia and Cara Cara cultivars are gaining acreage | +0.4% | Australia, China, and India | Long term (≥ 4 years) |
| Source: Mordor Intelligence | |||
Rising Processed-Juice Capacity Additions Across China and India
Juice plants now secure demand for cosmetically imperfect fruit that once went to waste. Patanjali Ayurved started an 800 metric ton-per-day facility in Nagpur in 2025 after investing INR 1,500 crore (USD 180 million) and targeting zero-waste operations. Chinese orange-juice output reached 40,000 metric tons in the 2025-2026 season, from negligible volumes ten years earlier[1]Source: United States Department of Agriculture Foreign Agricultural Service, “Citrus Annual: China,” USDA.gov . Forward contracts now buffer growers from price swings that once erased profits. Maharashtra growers benefit most because processors locate near orchards, reducing freight costs. Improved margins spur replanting with high-yielding cultivars that align with processor specifications.
Shift to High-Density and Protected Orchards, Cutting Unit Costs
Australian orange acreage increased 31% from 2014 to 2024, reaching 20,034 hectares under high-density layouts of up to 1,500 trees per hectare that lower water use by 30-40%. Shade nets and anti-hail structures shield fruit from erratic weather, a growing concern as climate variability intensifies. China’s Jiangxi and Hunan provinces subsidize similar systems to accelerate break-even to year four instead of year six. The Australia-Indonesia collaboration piloting tolerant rootstocks aims to replicate these gains across Southeast Asia[2]Source: Hort Innovation Australia, “Safeguarding Citrus Collaboration,” horticulture.com.au. Rapid payback makes citrus competitive with alternative crops, sustaining regional output growth even in water-stressed areas.
Government Export Rebates and Cold-Chain Incentives for Premium Orange Shipments from Australia and Pakistan
Export rebates and cold-chain grants are reducing costs for premium oranges, expanding their reach in Asian markets. Australia’s Department of Agriculture, Fisheries and Forestry and Hort Innovation Australia co-fund studies and phytosanitary support, cutting shipment costs to Japan and South Korea. The Indonesia-Australia Comprehensive Economic Partnership Agreement offers tariff-rate quotas at AUD 86 (USD 56) per certificate, easing access across Southeast Asia. Pakistan’s Trade Development Authority and the Punjab province provide freight rebates and cold-chain grants for shipments to the Middle East and Central Asia, although official budget figures are not disclosed[3]Source: World Bank, “Pakistan Citrus Exports 2023,” wits.worldbank.org .
Expansion of E-Commerce Produce Platforms Boosting Farmer Margins
Digital marketplaces remove layers of commission agents that once claimed up to 30% of retail value. JD.com and Yang’s Fruit used a 10,000-square-meter cloud sorting center in 2025 to move 100 metric tons per hour and grow orange gift-box sales by 90% year on year. BigBasket and Flipkart Grocery in India replicate the model, sourcing directly from farmer-producer organizations. E-commerce still accounts for less than 5% of total orange sales but posts annual gains of more than 25% in metro areas. Growers who meet grading and traceability requirements capture better prices and faster payments. Traditional wholesalers must upgrade service quality or risk obsolescence.
Restraints Impact Analysis*
| Restraint | (~) % Impact on CAGR Forecast | Geographic Relevance | Impact Timeline |
|---|---|---|---|
| Greening and canker outbreaks spreading beyond traditional hotspots | −0.5% | China, Australia, and Indonesia | Long term (≥ 4 years) |
| Chronic farm-labor shortages in Japan and South Korea | −0.3% | Japan and South Korea | Medium term (2-4 years) |
| High intra-regional freight rates | −0.2% | Australia to Japan and South Korea routes, and China inland freight | Short term (≤ 2 years) |
| Volatile farm-gate prices eroding small-holder profitability | −0.4% | India, Pakistan, and China | Medium term (2-4 years) |
| Source: Mordor Intelligence | |||
Greening and Canker Outbreaks Spreading Beyond Traditional Hotspots
Huanglongbing, transmitted by the Asian citrus psyllid, now infects over 30% of groves in parts of Guangdong and Fujian in China. The disease kills trees within five years, undermining output stability and deterring new plantings. Australia remains free of the pathogen but spends heavily on border surveillance and joint trials with Indonesia to test tolerant rootstocks. Citrus canker adds another layer of biosecurity cost because eradication requires tree removal and long quarantines. Smallholders lack capital for integrated pest management and therefore suffer disproportionately high yield losses during outbreaks.
High Intra-Regional Freight Rates
Container prices spiked during global logistics disruptions between 2022 and 2024, squeezing exporters' margins to North Asia, though citrus-specific rates are not publicly disclosed. Australia shipped 200,000 metric tons in the 2025-2026 year, facing longer lead times and erratic capacity. Chinese growers in inland Sichuan shoulder trucking costs on 1,000-kilometer hauls to eastern ports. Limited refrigerated warehousing pushes farmers to accept discounts or risk spoilage. Tariff-rate quotas under the Indonesia-Australia Comprehensive Economic Partnership Agreement require certificates that cost AUD 86 (USD 56) each, adding to transaction costs.
*Our forecasts treat driver/restraint impacts as directional, not additive. The impact forecasts reflect baseline growth, mix effects, and variable interactions.
Geography Analysis
China remains the largest consumer, holding 48.50% of the Asia-Pacific orange market share in 2025 and anchoring demand through its dense urban populations and year-round retail promotions. The country’s processors now absorb lower-grade fruit for juice, easing fresh-market gluts and sustaining household intake even during off-season months. India is the fastest-expanding buyer, with orange consumption advancing at a 5.10% CAGR over 2026-2031, driven by rising middle-class incomes and the penetration of modern grocery formats into tier-two and tier-three cities. Together, these two economies account for most of the incremental growth in the Asia-Pacific orange market, setting price and quality benchmarks for regional suppliers.
Japan and South Korea rely almost entirely on imports, so consumption tracks currency swings and phytosanitary protocols that favor Australian and United States fruit. Australia, despite its modest population, enjoys a stable per capita intake because domestic orchards supply competitively priced Navel and Valencia oranges across the May-to-October window. Vietnam and Indonesia are emerging demand centers where organized retail and e-commerce expose consumers to premium, traceable imports, although mandarins still outnumber oranges on store shelves. Pakistan’s appetite stays limited by lower disposable income, but incremental cold-chain investments hint at gradual shifts toward higher fruit purchases.
Rising health awareness, juice product launches, and traceability platforms are synchronizing consumption uptrends across the region. Improved cold storage and faster cross-border logistics now extend shelf life, enabling exporters to deliver sweeter, fresher oranges to inland urban hubs. Government support for e-commerce in China and India makes doorstep delivery of graded fruit routine, nudging shoppers to trade up from unbranded street purchases. As these structural catalysts deepen, regional demand is anticipated to widen the Asia-Pacific orange market size well beyond current projections, with each sub-market reinforcing growth through specialized channels that address its unique consumer preferences.
Competitive Landscape
The five largest suppliers, including COFCO Corporation, Costa Group Holdings Ltd, China Haisheng Juice Holdings Co., Ltd., Dole Asia Holdings Pte. Ltd., and Suntory Beverage and Food Ltd, together account for the majority share of the Asia-Pacific orange market size, indicating moderate concentration that still leaves scope for niche specialists. COFCO Corporation leverages integrated orchards, juice plants, and nationwide logistics to secure a steady flow of raw fruit and preferential retail shelf space across China. Costa Group Holdings Ltd controls sizable high-density orchards in Australia and aligns harvest windows with off-season demand in Japan and South Korea, underpinning premium pricing. Both leaders invest heavily in water-saving irrigation and digital traceability to reinforce retailer confidence and to hedge against climate and biosecurity shocks.
China Haisheng Juice Holdings Co., Ltd. focuses on bulk concentrate that absorbs cosmetically imperfect fruit and delivers stable offtake contracts to growers. Dole Asia Holdings Pte. Ltd. combines Philippine plantation-scale operations with drone and artificial intelligence tools that enhance spray precision and labor efficiency. Suntory Beverage and Food Ltd uses long-term procurement alliances and research collaborations to secure disease-resistant supply while promoting branded juice products in high-margin convenience channels. Together, these three companies anchor processing and marketing functions that bridge farm output with diversified consumer formats.
Growth strategies now converge on vertical integration, sustainability, and data-driven quality control that reduce waste and meet retailer audit requirements. New investments in high-capacity plants, blockchain platforms, and varietal research and development expand processing capacity and raise consumer trust in product provenance. Cross-border partnerships with technology firms and research institutes accelerate the deployment of rootstock trials and precision agriculture across multiple climates. As these initiatives mature, the competitive set is positioned to expand the Asia-Pacific orange market by boosting yields, safeguarding supply, and unlocking new juice and snack formats that broaden consumer appeal.
Recent Industry Developments
- June 2025: Hort Innovation Australia initiated a partnership with Indonesia to field-test Huanglongbing-tolerant rootstocks alongside high-density orchard layouts including orange. By strengthening disease resistance and lifting yields, the program is designed to stabilize long-term fruit supply including orange, lower unit production costs, and help exporters meet growing regional demand, thereby supporting sustained market expansion.
- March 2025: Patanjali Ayurved opened Asia’s largest orange processing plant in Nagpur, with a daily capacity of 800 metric tons, following an INR 1,500 crore (USD 180 million) investment. The new capacity absorbs surplus harvests, raising farmers’ offtake opportunities and reinforcing upward consumption momentum.
- January 2024: Japan’s Ministry of Agriculture, Forestry and Fisheries introduced labor reforms that will replace the Technical Intern Training Program in 2027 and expand the Specified Skilled Worker scheme, aiming to ease chronic farm workforce shortages. By improving labor availability for aging Ehime and Wakayama orchards, the policy seeks to slow domestic output declines and, in turn, temper Japan’s heavy reliance on imported oranges within the wider Asia-Pacific market.


Asia-Pacific Orange Market Report Scope
An orange is a round citrus fruit with a thick orange-colored rind and juicy segmented flesh that is typically sweet or slightly tangy in taste. It belongs to the genus Citrus and is widely cultivated in tropical and subtropical regions for fresh consumption as well as for juice production, flavoring, and food processing. Oranges are valued for their high vitamin C content, antioxidants, and dietary fiber.
The Asia-Pacific Orange Market Report is segmented by geography, including China, India, Thailand, Indonesia, Vietnam, Japan, Australia, and South Korea. The report includes production analysis by volume, consumption analysis by value and volume, import analysis by value and volume, export analysis by value and volume, wholesale price trend analysis and forecast, regulatory framework analysis, key player analysis, logistics and infrastructure analysis, and seasonality analysis. The market forecasts are provided in terms of value (USD) and volume (metric tons).
By Geography
| China | Production Analysis (Area Harvested, Yield, and Production Volume) |
| Consumption Analysis (Consumption Value and Volume) | |
| Import Market Analysis (Import Value, Volume, and Key Supplying Markets) | |
| Export Market Analysis (Export Value, Volume, and Key Destination Markets) | |
| Wholesale Price Trend Analysis and Forecast | |
| Regulatory Framework | |
| List of Key Players | |
| Logistics and Infrastructure | |
| Seasonality Analysis | |
| India | Production Analysis (Area Harvested, Yield, and Production Volume) |
| Consumption Analysis (Consumption Value and Volume) | |
| Import Market Analysis (Import Value, Volume, and Key Supplying Markets) | |
| Export Market Analysis (Export Value, Volume, and Key Destination Markets) | |
| Wholesale Price Trend Analysis and Forecast | |
| Regulatory Framework | |
| List of Key Players | |
| Logistics and Infrastructure | |
| Seasonality Analysis | |
| Thailand | Production Analysis (Area Harvested, Yield, and Production Volume) |
| Consumption Analysis (Consumption Value and Volume) | |
| Import Market Analysis (Import Value, Volume, and Key Supplying Markets) | |
| Export Market Analysis (Export Value, Volume, and Key Destination Markets) | |
| Wholesale Price Trend Analysis and Forecast | |
| Regulatory Framework | |
| List of Key Players | |
| Logistics and Infrastructure | |
| Seasonality Analysis | |
| Indonesia | Production Analysis (Area Harvested, Yield, and Production Volume) |
| Consumption Analysis (Consumption Value and Volume) | |
| Import Market Analysis (Import Value, Volume, and Key Supplying Markets) | |
| Export Market Analysis (Export Value, Volume, and Key Destination Markets) | |
| Wholesale Price Trend Analysis and Forecast | |
| Regulatory Framework | |
| List of Key Players | |
| Logistics and Infrastructure | |
| Seasonality Analysis | |
| Vietnam | Production Analysis (Area Harvested, Yield, and Production Volume) |
| Consumption Analysis (Consumption Value and Volume) | |
| Import Market Analysis (Import Value, Volume, and Key Supplying Markets) | |
| Export Market Analysis (Export Value, Volume, and Key Destination Markets) | |
| Wholesale Price Trend Analysis and Forecast | |
| Regulatory Framework | |
| List of Key Players | |
| Logistics and Infrastructure | |
| Seasonality Analysis | |
| Japan | Production Analysis (Area Harvested, Yield, and Production Volume) |
| Consumption Analysis (Consumption Value and Volume) | |
| Import Market Analysis (Import Value, Volume, and Key Supplying Markets) | |
| Export Market Analysis (Export Value, Volume, and Key Destination Markets) | |
| Wholesale Price Trend Analysis and Forecast | |
| Regulatory Framework | |
| List of Key Players | |
| Logistics and Infrastructure | |
| Seasonality Analysis | |
| Australia | Production Analysis (Area Harvested, Yield, and Production Volume) |
| Consumption Analysis (Consumption Value and Volume) | |
| Import Market Analysis (Import Value, Volume, and Key Supplying Markets) | |
| Export Market Analysis (Export Value, Volume, and Key Destination Markets) | |
| Wholesale Price Trend Analysis and Forecast | |
| Regulatory Framework | |
| List of Key Players | |
| Logistics and Infrastructure | |
| Seasonality Analysis | |
| Pakistan | Production Analysis (Area Harvested, Yield, and Production Volume) |
| Consumption Analysis (Consumption Value and Volume) | |
| Import Market Analysis (Import Value, Volume, and Key Supplying Markets) | |
| Export Market Analysis (Export Value, Volume, and Key Destination Markets) | |
| Wholesale Price Trend Analysis and Forecast | |
| Regulatory Framework | |
| List of Key Players | |
| Logistics and Infrastructure | |
| Seasonality Analysis | |
| South Korea | Production Analysis (Area Harvested, Yield, and Production Volume) |
| Consumption Analysis (Consumption Value and Volume) | |
| Import Market Analysis (Import Value, Volume, and Key Supplying Markets) | |
| Export Market Analysis (Export Value, Volume, and Key Destination Markets) | |
| Wholesale Price Trend Analysis and Forecast | |
| Regulatory Framework | |
| List of Key Players | |
| Logistics and Infrastructure | |
| Seasonality Analysis |
| By Geography | China | Production Analysis (Area Harvested, Yield, and Production Volume) |
| Consumption Analysis (Consumption Value and Volume) | ||
| Import Market Analysis (Import Value, Volume, and Key Supplying Markets) | ||
| Export Market Analysis (Export Value, Volume, and Key Destination Markets) | ||
| Wholesale Price Trend Analysis and Forecast | ||
| Regulatory Framework | ||
| List of Key Players | ||
| Logistics and Infrastructure | ||
| Seasonality Analysis | ||
| India | Production Analysis (Area Harvested, Yield, and Production Volume) | |
| Consumption Analysis (Consumption Value and Volume) | ||
| Import Market Analysis (Import Value, Volume, and Key Supplying Markets) | ||
| Export Market Analysis (Export Value, Volume, and Key Destination Markets) | ||
| Wholesale Price Trend Analysis and Forecast | ||
| Regulatory Framework | ||
| List of Key Players | ||
| Logistics and Infrastructure | ||
| Seasonality Analysis | ||
| Thailand | Production Analysis (Area Harvested, Yield, and Production Volume) | |
| Consumption Analysis (Consumption Value and Volume) | ||
| Import Market Analysis (Import Value, Volume, and Key Supplying Markets) | ||
| Export Market Analysis (Export Value, Volume, and Key Destination Markets) | ||
| Wholesale Price Trend Analysis and Forecast | ||
| Regulatory Framework | ||
| List of Key Players | ||
| Logistics and Infrastructure | ||
| Seasonality Analysis | ||
| Indonesia | Production Analysis (Area Harvested, Yield, and Production Volume) | |
| Consumption Analysis (Consumption Value and Volume) | ||
| Import Market Analysis (Import Value, Volume, and Key Supplying Markets) | ||
| Export Market Analysis (Export Value, Volume, and Key Destination Markets) | ||
| Wholesale Price Trend Analysis and Forecast | ||
| Regulatory Framework | ||
| List of Key Players | ||
| Logistics and Infrastructure | ||
| Seasonality Analysis | ||
| Vietnam | Production Analysis (Area Harvested, Yield, and Production Volume) | |
| Consumption Analysis (Consumption Value and Volume) | ||
| Import Market Analysis (Import Value, Volume, and Key Supplying Markets) | ||
| Export Market Analysis (Export Value, Volume, and Key Destination Markets) | ||
| Wholesale Price Trend Analysis and Forecast | ||
| Regulatory Framework | ||
| List of Key Players | ||
| Logistics and Infrastructure | ||
| Seasonality Analysis | ||
| Japan | Production Analysis (Area Harvested, Yield, and Production Volume) | |
| Consumption Analysis (Consumption Value and Volume) | ||
| Import Market Analysis (Import Value, Volume, and Key Supplying Markets) | ||
| Export Market Analysis (Export Value, Volume, and Key Destination Markets) | ||
| Wholesale Price Trend Analysis and Forecast | ||
| Regulatory Framework | ||
| List of Key Players | ||
| Logistics and Infrastructure | ||
| Seasonality Analysis | ||
| Australia | Production Analysis (Area Harvested, Yield, and Production Volume) | |
| Consumption Analysis (Consumption Value and Volume) | ||
| Import Market Analysis (Import Value, Volume, and Key Supplying Markets) | ||
| Export Market Analysis (Export Value, Volume, and Key Destination Markets) | ||
| Wholesale Price Trend Analysis and Forecast | ||
| Regulatory Framework | ||
| List of Key Players | ||
| Logistics and Infrastructure | ||
| Seasonality Analysis | ||
| Pakistan | Production Analysis (Area Harvested, Yield, and Production Volume) | |
| Consumption Analysis (Consumption Value and Volume) | ||
| Import Market Analysis (Import Value, Volume, and Key Supplying Markets) | ||
| Export Market Analysis (Export Value, Volume, and Key Destination Markets) | ||
| Wholesale Price Trend Analysis and Forecast | ||
| Regulatory Framework | ||
| List of Key Players | ||
| Logistics and Infrastructure | ||
| Seasonality Analysis | ||
| South Korea | Production Analysis (Area Harvested, Yield, and Production Volume) | |
| Consumption Analysis (Consumption Value and Volume) | ||
| Import Market Analysis (Import Value, Volume, and Key Supplying Markets) | ||
| Export Market Analysis (Export Value, Volume, and Key Destination Markets) | ||
| Wholesale Price Trend Analysis and Forecast | ||
| Regulatory Framework | ||
| List of Key Players | ||
| Logistics and Infrastructure | ||
| Seasonality Analysis | ||


Key Questions Answered in the Report
What is the current size of the Asia-Pacific orange market?
It stands at USD 16.6 billion in 2026 and is projected to reach USD 19.2 billion by 2031.
Which country supplies the largest share of Asia-Pacific orange exports?
Australia held the largest share of 39.70% of export value in 2025, shipping mainly to Japan and South Korea.
How significant is processed juice in regional demand growth?
Processed juice capacity in China and India is adding 40,000 metric tons of annual output, stabilizing grower prices and driving incremental demand.
What diseases pose the greatest risk to Asia-Pacific citrus?
Huanglongbing and citrus canker are the primary threats, capable of sharply reducing yields in affected provinces.
Page last updated on:


