
Online Sports Betting Market Size and Share
Market Overview
| Study Period | 2021 - 2031 |
|---|---|
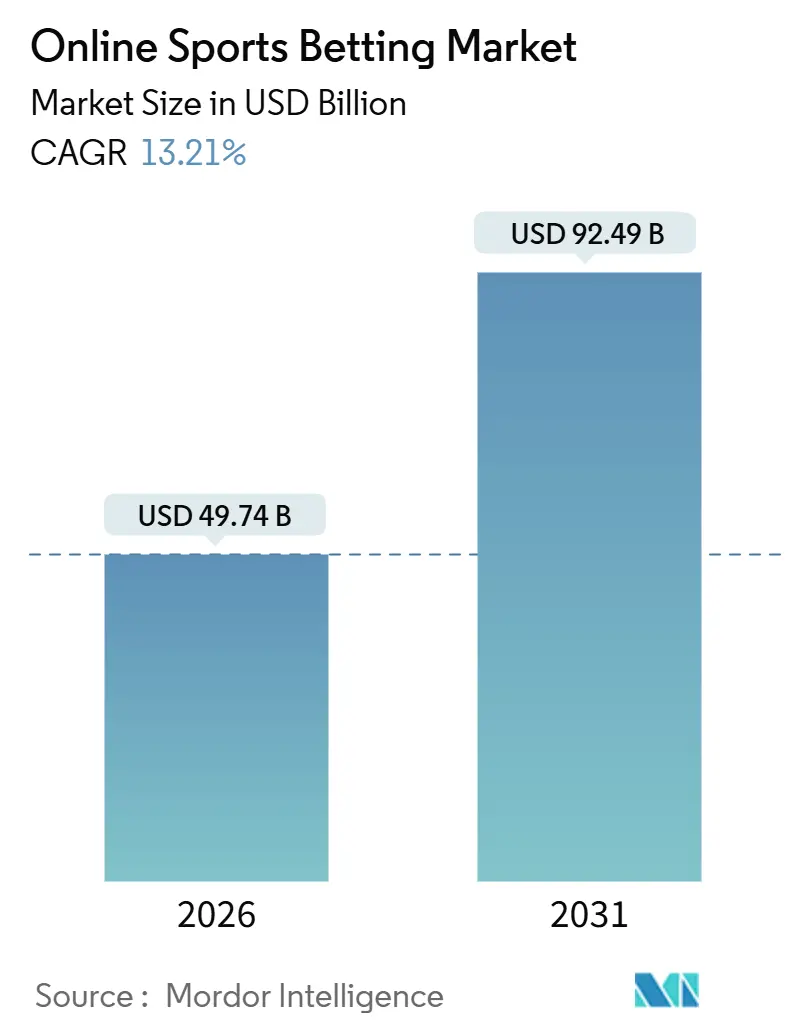
| Market Size (2026) | USD 49.74 Billion |
| Market Size (2031) | USD 92.49 Billion |
| Growth Rate (2026 - 2031) | 13.21 % |
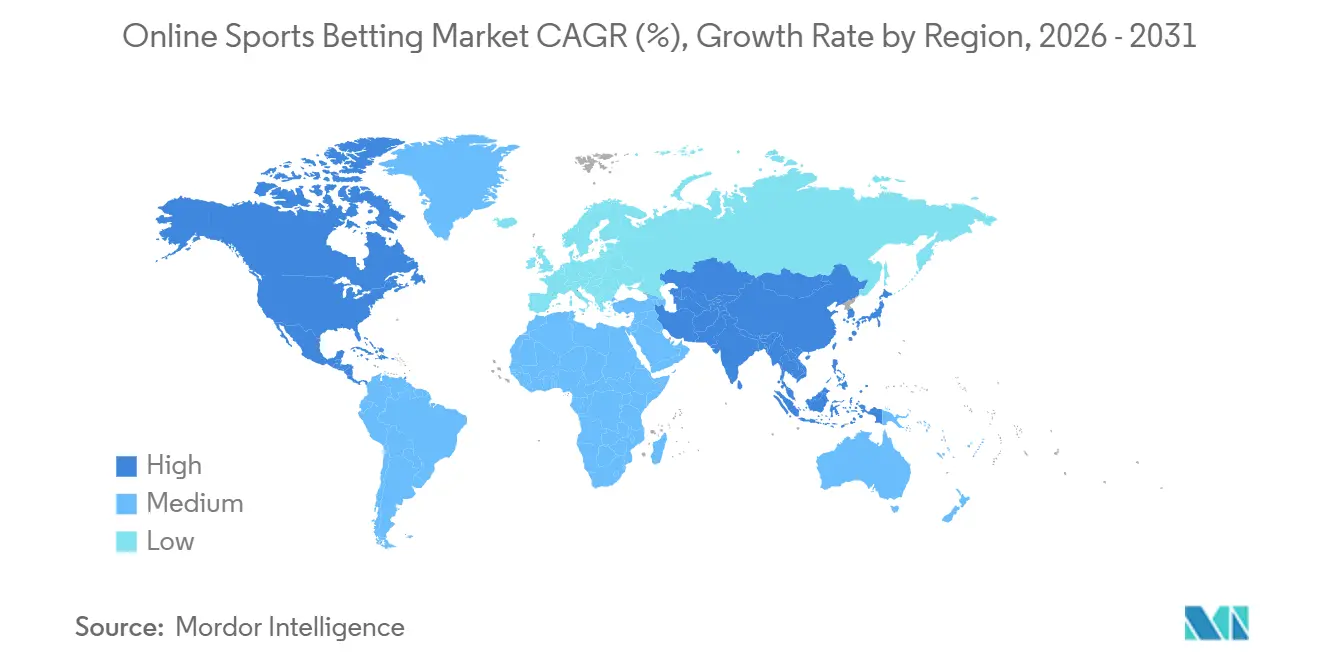
| Fastest Growing Market | North America |
| Largest Market | Europe |
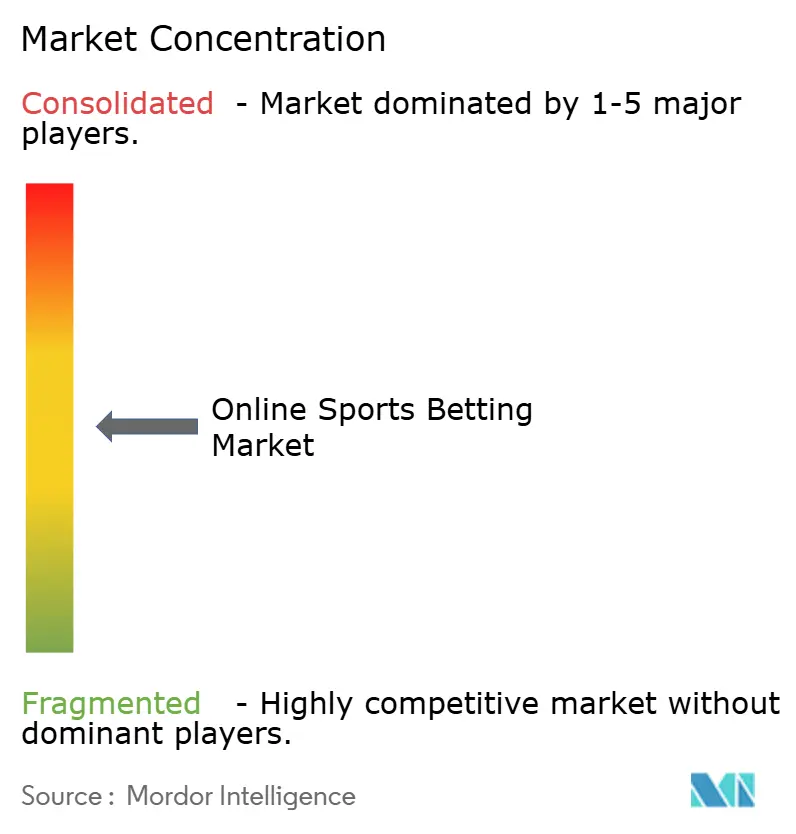
| Market Concentration | Medium |
Major Players
*Disclaimer: Major Players sorted in no particular order Image © Mordor Intelligence. Reuse requires attribution under CC BY 4.0. |
|
Online Sports Betting Market Analysis by Mordor Intelligence
The online sports betting market size stood at USD 49.74 billion in 2026 and is projected to reach USD 92.49 billion by 2031, reflecting a 13.21% CAGR. The increasing acceptance of online sports betting as a mainstream activity is driven by several factors, including the widespread adoption of smartphones, rapid advancements in live-streaming infrastructure, and a wave of legalization across major jurisdictions. Operators are leveraging innovative micro-betting tools that enable users to make decisions within seconds, enhancing the overall betting experience. Additionally, artificial intelligence models are being utilized to dynamically adjust odds, ensuring sustained user engagement. Global market leaders are strategically rationalizing their portfolios by prioritizing regions with higher growth potential and predictable tax environments. However, the market faces notable challenges, such as rising compliance costs, heightened risks of fraud, and ongoing competition from unlicensed operators, all of which continue to exert pressure on profitability, even in well-established markets.
Key Report Takeaways
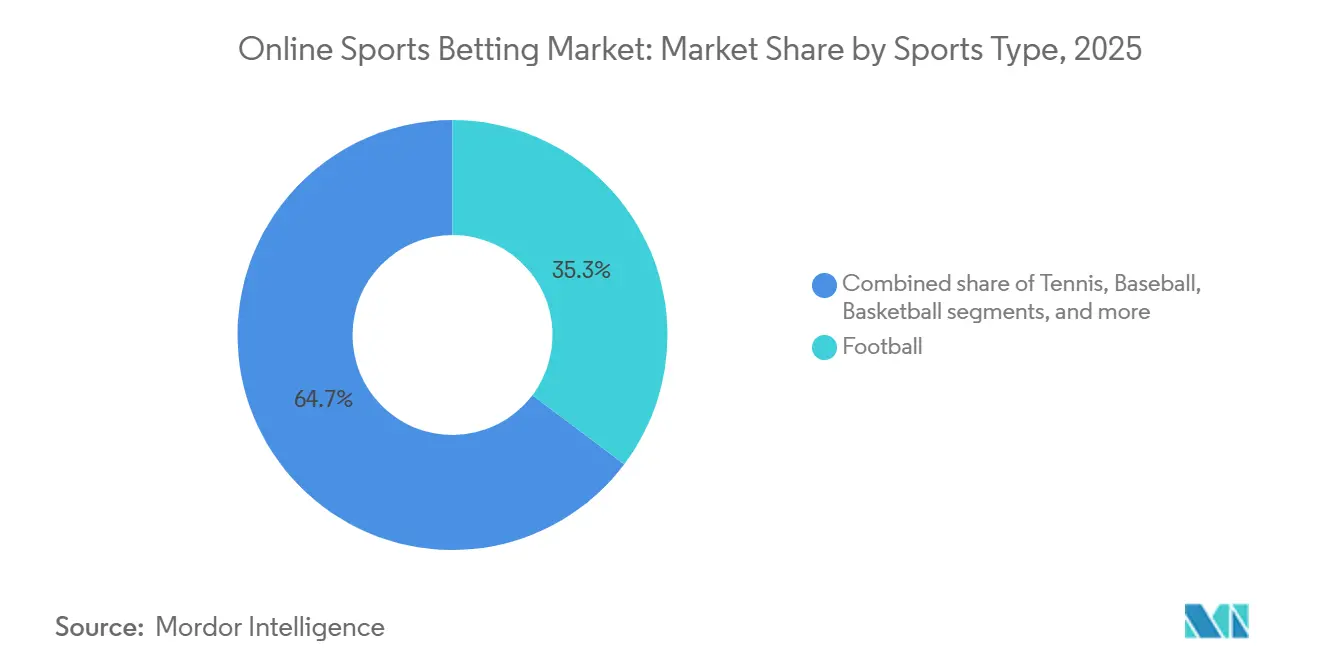
- By sports type, football held 35.27% of the online sports betting market share in 2025; tennis is set to expand at a 13.83% CAGR through 2031.
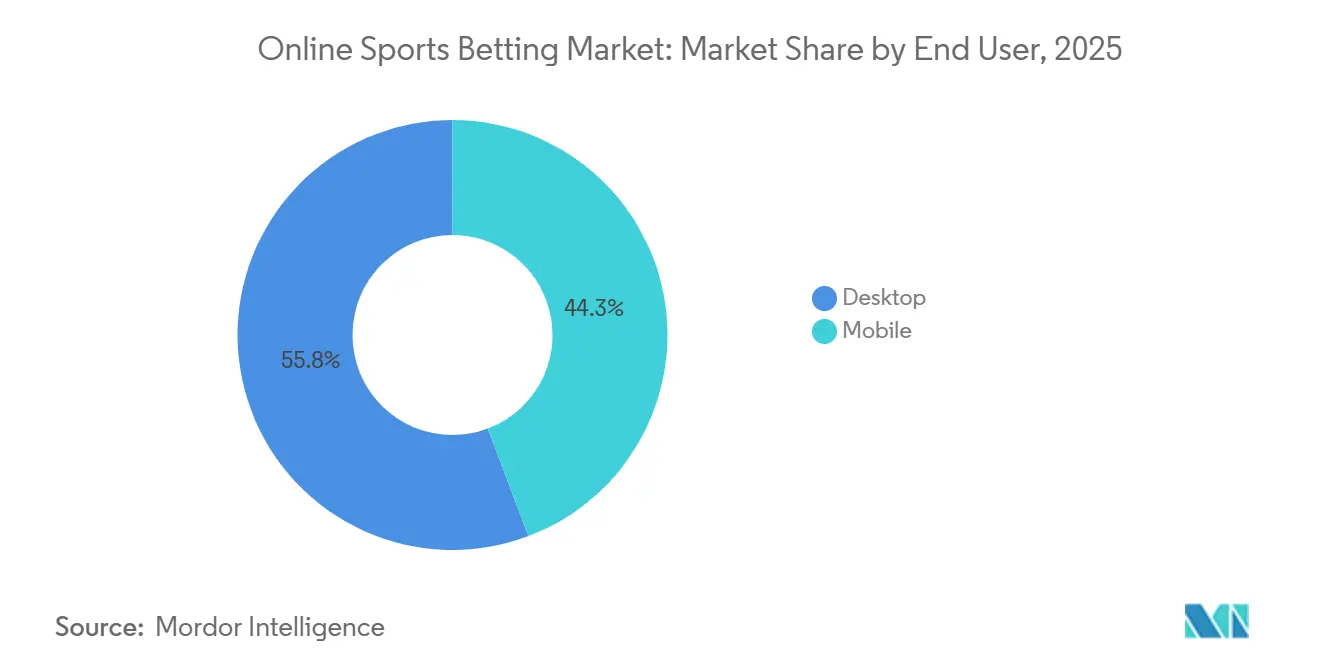
- By end user, desktop platforms controlled 55.75% of the online sports betting market size in 2025, while mobile is forecast to grow at a 13.75% CAGR to 2031.
- By betting type, live wagering accounted for 62.35% of the online sports betting market size in 2025 and is advancing at a 13.62% CAGR through 2031.
- By geography, Europe captured 50.17% revenue share in 2025; North America records the fastest projected CAGR at 13.94% to 2031.
Note: Market size and forecast figures in this report are generated using Mordor Intelligence’s proprietary estimation framework, updated with the latest available data and insights as of January 2026.
Market Trends and Insights
Drivers Impact Analysis of Online Sports Betting Market*
| Driver | (~) % Impact on CAGR Forecast | Geographic Relevance | Impact Timeline |
|---|---|---|---|
| Advertising and promotional activities by the operators | +1.8% | Global, with peak intensity in North America and Europe | Short term (≤ 2 years) |
| Increased smartphone penetration and mobile betting apps enable anytime access | +2.5% | Global, strongest in Asia-Pacific and North America | Medium term (2-4 years) |
| Data analytics and personalization benefiting the betting experience | +1.6% | North America, Europe, Oceanic countries | Medium term (2-4 years) |
| Integration of digital payment solutions | +1.4% | Global, early adoption in Europe and North America | Short term (≤ 2 years) |
| Technological advancements in live betting | +2.2% | Global, led by Europe and North America | Medium term (2-4 years) |
| Rising popularity of global sports events like the World Cup and esports attracts diverse demographics. | +1.9% | Global, with emerging strength in Asia-Pacific and South America | Long term (≥ 4 years) |
| Source: Mordor Intelligence | |||


Increased smartphone penetration and mobile betting apps enable anytime access
In 2024, 71% of the global population had access to smartphones, according to the Global System for Mobile Communications Association[1]Source: Global System for Mobile Communications Association, "The Mobile Economy 2025", gsma.com. This widespread smartphone adoption has significantly enhanced the convenience of online betting. Mobile betting apps now feature geolocation verification, biometric authentication, and push notifications for live events, enabling users to place bets in less than 10 seconds. Flutter Entertainment's FanDuel app introduced a single-tap bet-slip feature in 2024, simplifying parlay construction and driving a 22% year-over-year increase in mobile betting during the National Football League (NFL) season. Additionally, DraftKings' 2025 app update incorporated augmented-reality overlays for player-prop visualization, demonstrating how operators are integrating immersive content into core betting functions to increase user engagement. However, regulatory frameworks like the United Kingdom Gambling Commission's remote operating license require real-time age verification and session-time alerts. These regulations create technical challenges for smaller operators, leading to a consolidation of market share among larger, well-funded companies.
Technological advancements in live betting
In 2025, live or in-play betting represented 62.35% of the betting market share. This growth was driven by advancements in low-latency streaming infrastructure and the increasing popularity of micro-betting products. These products allow wagers on highly specific outcomes, such as the next pitch, serve, or possession. Operators leverage proprietary odds engines that recalculate probabilities every 200 to 500 milliseconds. This capability relies on edge-computing architecture and direct data feeds from sports leagues. In 2024, the National Basketball Association partnered with FanDuel, providing access to real-time player-tracking data. This partnership enabled innovative bet types like "next player to score" and "total points in the next 2 minutes" which recorded higher average frequencies compared to traditional full-game wagers. Furthermore, same-game parlays, which combine multiple correlated outcomes within a single contest, gained popularity. Cash-out features, which allow bettors to settle wagers before an event concludes, appeal to risk-averse segments. However, operators carefully price these exits to protect their margins, balancing user experience with profitability.
Rising popularity of global sports events like the World Cup and esports attracts diverse demographics.
Tennis is anticipated to grow at a 13.83% CAGR through 2031, making it the fastest-growing sport. This growth is driven by Grand Slam tournaments, which span multiple time zones and provide continuous in-play betting opportunities over their 14-day duration. In 2024 and 2025, the ATP and WTA established partnerships with betting operators, embedding official data feeds into platforms. This integration reduced latency and expanded the variety of bet types, particularly for point-by-point wagering. Esports betting, which includes popular titles like League of Legends, Dota 2, and Counter-Strike 2, has attracted a younger audience, primarily aged 18 to 34. This group demonstrates higher engagement with mobile apps and a greater tolerance for volatile odds. FIFA World Cup cycles create significant demand spikes, which operators leverage for customer acquisition. The 2026 tournament in North America is expected to drive a surge in new account registrations in the month leading up to the event. According to the American Gaming Association (AGA), Americans legally wagered over USD 147 billion on sports in 2024, marking a 23% increase from 2023[2]Source: American Gaming Association, “Commercial Gaming Revenue Tracker,” americangaming.org. This growth highlights the market's momentum and the impact of global events and promotional strategies.
Data analytics and personalization benefitting betting experience
Operators utilize artificial intelligence and machine learning to segment users by risk profiles, betting patterns, and sports preferences. This approach enables the delivery of customized odds boosts and content recommendations, driving higher conversion rates compared to generic promotions. In 2024, Entain strengthened its capabilities by acquiring Angstrom Sports, a sports-data analytics firm. This acquisition improved live-odds accuracy and reduced vulnerability to sharp bettors exploiting pricing inefficiencies. AI-powered responsible gambling tools, such as Mindway AI's behavioral-tracking algorithms, gained traction among European operators in 2025. These tools detect at-risk users by analyzing anomalies in session durations and stake-size increases, triggering automated measures like deposit-limit notifications and self-exclusion options. To comply with the United Kingdom Gambling Commission's 2025 mandate for stricter affordability checks, operators are now required to implement open-banking APIs. These APIs enable real-time evaluations of disposable income, increasing compliance costs but significantly lowering regulatory risks and potential fines.
Restraints Impact Analysis of Online Sports Betting Market*
| Restraint | (~) % Impact on CAGR Forecast | Geographic Relevance | Impact Timeline |
|---|---|---|---|
| Regulatory uncertainty and compliance costs | -1.5% | Global, acute in emerging markets and jurisdictions with evolving frameworks | Medium term (2-4 years) |
| Increasing fraudulent cases | -0.9% | Global, concentrated in regions with weak enforcement | Short term (≤ 2 years) |
| Growing concerns about gambling addiction | -1.2% | North America, Europe, Oceanic countries | Long term (≥ 4 years) |
| Competition from illegal betting platforms | -1.1% | Asia-Pacific, South America, Middle East and Africa | Medium term (2-4 years) |
| Source: Mordor Intelligence | |||
Regulatory uncertainty and compliance cost
Operators functioning across more than 10 jurisdictions face significant compliance costs due to fragmented regulatory frameworks. These costs include licensing fees, implementing technical solutions for geolocation and age verification, and securing legal counsel to navigate varying advertising restrictions. In 2024, the United Kingdom introduced a "whistle-to-whistle" advertising ban, which prohibits betting promotions during live sports broadcasts before 9 PM. This regulation has forced operators to reallocate their marketing budgets, focusing more on digital channels and partnerships with influencers to maintain visibility and customer engagement. Similarly, Italy enacted a comprehensive advertising ban on gambling services in 2025, which eliminated promotional opportunities across television, radio, and online display ads. As a result, operators have been compelled to rely on organic search strategies and affiliate networks, despite these methods being less effective in acquiring new customers. In the United States, state-level tax rates on gross gaming revenue vary widely, creating significant profitability challenges. For instance, Nevada imposes a relatively low tax rate of 6.75%, while New York enforces a much higher rate of 51%[3]Source: Tax Foundation, "Sports Betting Tax Revenue", taxfoundation.org. These stark differences in tax structures directly impact operators' decisions regarding market entry and the allocation of capital resources.
Growing concerns about gambling addiction
Public awareness of gambling-related harms has significantly increased due to high-profile incidents and academic research that link the accessibility of online betting to a growing prevalence of problem gambling among individuals aged 18 to 24. In response, Australia launched the BetStop register in 2024, which is managed by the Australian Communications and Media Authority (ACMA). This initiative allows users to self-exclude from all licensed gambling operators through a single, centralized portal. Previously, users faced the inconvenience of registering separately on each platform, which highlighted a lack of coordination in addressing gambling-related issues. Now, operators are under greater scrutiny, facing reputational risks and potential license revocation if they fail to implement robust harm-prevention measures. For instance, in 2024, the United Kingdom Gambling Commission imposed a fine on Betfred for failing to meet social responsibility and anti-money laundering standards. Technological tools such as deposit limits, session timers, and reality checks have become standard practices in the industry. However, the effectiveness of these measures largely depends on user compliance and the rigor with which operators enforce them. This dynamic underscores an ongoing tension between the industry's pursuit of revenue growth and its obligation to prioritize consumer protection and duty-of-care responsibilities.
*Our forecasts treat driver/restraint impacts as directional, not additive. The impact forecasts reflect baseline growth, mix effects, and variable interactions.
Online Sports Betting Market Segment Analysis
By Sports Type:
Tennis Surges on In-Play Betting DynamicsIn 2025, football accounted for 35.27% of the market share, driven by global leagues such as the English Premier League, La Liga, and Serie A. These leagues provide a consistent betting inventory throughout the year and appeal to both casual and professional bettors. Tennis, supported by its Grand Slam tournaments, is expected to grow at a 13.83% CAGR through 2031, the highest among sports types. These tournaments enable continuous in-play betting across multiple matches and time zones, helping operators sustain liquidity and user engagement during their 14-day durations. Basketball's high-scoring games and frequent lead changes keep live betting interest strong. On the other hand, horse racing, despite its established customer base, faces challenges from declining track attendance and increasing competition from other sports. Baseball's slower pace has traditionally limited its appeal for in-play betting compared to football and basketball. However, in 2025, several US operators introduced pitch-by-pitch prop bets to enhance engagement. Other sports, including esports, cricket, and mixed martial arts, are gaining traction as operators expand their content offerings to cater to niche audiences and regional preferences.
Esports betting, featuring games like League of Legends, Dota 2, and Counter-Strike 2, has attracted a younger demographic, primarily aged 18 to 34. This group demonstrates higher engagement with mobile apps and a greater tolerance for fluctuating odds. The regulatory environment for esports betting remains underdeveloped, with some jurisdictions categorizing it as skill-based gaming rather than traditional sports wagering. This creates compliance challenges, leading operators to adopt cautious market-entry strategies. Cricket betting dominates in South Asia, but regulatory restrictions in India and Pakistan often drive activity to unlicensed offshore platforms, limiting the market potential for licensed operators.


By End User:
Desktop Resilience Defies Mobile-First NarrativesDespite widespread assumptions favoring mobile dominance, desktop platforms captured 55.75% of the end-user share in 2025. This trend can be attributed to professional bettors favoring multi-screen analytics, larger displays for live events, and the efficiency of keyboard-based bet-slip construction, which hastens complex parlay assembly. Meanwhile, mobile platforms are set to expand at a 13.75% CAGR through 2031. This growth is fueled by rising smartphone penetration in North America and Europe, app-based geolocation verification meeting regulatory standards, and push notifications that boost engagement during live events. A testament to the industry's evolution, DraftKings integrated augmented-reality overlays for player-prop visualization in its 2025 app update, showcasing operators' efforts to blend immersive content with core wagering functions to prolong user sessions.
While desktops maintain a significant share, the user base is clearly divided: casual mobile bettors typically place small-stake wagers on single outcomes, whereas sophisticated desktop users employ statistical models, monitor multiple live events, and execute arbitrage strategies across different operators. To cater to both segments, operators ensure feature parity across platforms. However, they customize user interfaces based on device interactions: mobile platforms lean towards swipe gestures and one-handed navigation, while desktops focus on information density and multi-window workflows. Regulatory bodies, like the United Kingdom Gambling Commission, enforce compliance measures such as real-time age verification and session-time alerts on both desktop and mobile platforms. These requirements introduce technical challenges, especially for smaller operators, leading to a consolidation of market share among larger, well-capitalized incumbents.
By Betting Type:
Live Wagering Dominates Through Micro-Betting InnovationLive or in-play betting, which accounted for 62.35% of the betting-type share in 2025, is set to maintain a robust 13.62% CAGR through 2031. This growth is bolstered by advancements in low-latency streaming infrastructure and the rise of micro-betting products, enabling wagers on outcomes as specific as the next pitch, serve, or possession. Meanwhile, pre-match or fixed-odds betting, while still holding a dedicated customer base that appreciates research-driven handicapping and the advantage of locking in favorable lines days ahead of kickoff, is witnessing slower growth. This is largely because operators are increasingly focusing on live-betting features, which offer a higher frequency of bets and greater handling per user. To stay competitive, operators utilize proprietary odds engines that recalibrate probabilities every 200 to 500 milliseconds. Achieving this rapid recalibration demands an edge-computing architecture and direct data feeds sourced from sports leagues.
Same-game parlays allow bettors to bundle multiple correlated outcomes from a single contest. Additionally, cash-out features enable bettors to settle their wagers before an event concludes, appealing to those with a risk-averse mindset. However, operators strategically price these cash-out options to maintain their profit margins, creating a delicate balance between enhancing user experience and ensuring profitability. Bet builders empower users to craft custom parlays from a selection of prop bets. These builders utilize AI-driven correlation models for precise pricing of multi-leg wagers. This technical feat, however, is often outsourced by smaller operators to third-party risk-management experts like Kambi Group. Live-streaming integration in betting apps, a feature initially introduced by Bet365 and now adopted by leading operators, minimizes the need for users to switch between platforms. This not only boosts session duration but also amplifies bet frequency.
Geography Analysis
Europe Online Sports Betting Market
Europe accounted for 50.17% of the geographic share in 2025, supported by well-established regulatory frameworks in countries such as the UK, Germany, France, Spain, and Sweden. These frameworks effectively balance consumer protection with fiscal revenue generation. The UK Gambling Commission's 2025 National Strategy emphasized this shift by requiring stricter affordability checks and expanding the GAMSTOP self-exclusion register. These measures highlight a focus on harm prevention, pushing operators to integrate them into platform designs. In the same year, Italy implemented a comprehensive advertising ban, prohibiting television, radio, and online display ads. This change forced operators to depend on organic search and affiliate networks, which are less efficient for customer acquisition. Spain's Dirección General de Ordenación del Juego enforces strict advertising restrictions, including limited advertising windows and a ban on celebrity endorsements. However, the market remains appealing due to strong football engagement and a growing population.
North America Online Sports Betting Market
North America is experiencing rapid growth, with a 13.94% CAGR projected through 2031, the highest among all regions. This growth follows the introduction of licensing regimes across jurisdictions from Ohio to Massachusetts between 2023 and 2025, which unlocked pent-up demand and intensified competition among operators. New York imposes the nation's highest tax rate on gross gaming revenue at 51%, creating challenges for operators. Companies like DraftKings and FanDuel reported reduced margins, which limited their promotional activities and market expansion efforts. In Mexico, the regulatory framework remains fragmented, with federal oversight by the Dirección General de Juegos y Sorteos coexisting with state-level licensing. This complexity in compliance discourages some international operators.
APAC, South America and MEA Online Sports Betting Market
In the Asia-Pacific region, market dynamics vary significantly. Oceanic countries, particularly Australia, dominate the regulated market due to established licensing systems and a high propensity for betting. Australia's BetStop, a national self-exclusion register launched in 2024 and managed by the Australian Communications and Media Authority, exemplifies efforts to standardize consumer protections across the country's fragmented state systems. In South America, Brazil and Argentina, the region's largest markets, are working to formalize their regulatory frameworks. Brazil enacted its sports-betting law in 2024, with licensing expected to begin in 2025. This development presents a short-term opportunity for operators willing to navigate the associated political and fiscal uncertainties. The Middle East and Africa remain largely unregulated, with South Africa serving as the primary licensed market. However, a significant portion of activity occurs through unlicensed offshore platforms, driven by limited enforcement capabilities and consumer preference for cryptocurrency transactions that bypass capital controls.

Regulatory Landscape
Online sports betting regulation continues to fragment by jurisdiction, with tighter consumer-protection, advertising, and reporting requirements shaping operator economics. In Europe, the United Kingdom Gambling Commission has tightened remote-operator obligations through affordability checks and expanded self-exclusion tooling (for example, GAMSTOP), while several European markets retain restrictive advertising rules that steer customer acquisition toward affiliates and owned digital channels. In the United States, state-by-state frameworks and wide tax dispersion (for example, 6.75% in Nevada versus 51% in New York on gross gaming revenue) keep market-entry decisions tightly linked to compliance burden and post-tax unit economics.
In 2026, additional regulatory anchors emerged across regions. India formally notified and brought into force the Promotion and Regulation of Online Gaming Rules, 2026 (effective May 1, 2026) under MeitY, establishing an Online Gaming Authority of India and reinforcing centralized oversight for online gaming compliance. Brazil saw renewed scrutiny of enforcement and oversight routines in June 2026 as the Federal Public Prosecutor’s Office (MPF) initiated an inquiry into the Ministry of Finance’s regulatory oversight related to sports-betting laws. Offshore-facing hubs also tightened controls, with the Curaçao Gaming Authority confirming full enforcement of supplier licensing under the LOK effective December 24, 2026 and adding stricter crypto-gambling policies with compliance timelines extending into 2027.
Competitive Landscape
The online sports betting market exhibits moderate fragmentation, with Entain PLC, Flutter Entertainment PLC, DraftKings Inc., Hillside (New Media) Limited (Bet365), and Evoke Plc (888) capturing an estimated significant global regulated-market revenue. This fragmented due to regional licensing rules that benefit local operators and the growth of white-label platforms. These platforms, supported by third-party technology providers like Kambi Group and Sportradar, have intensified competition. Operators differentiate themselves by establishing exclusive content partnerships, integrating loyalty programs, and using proprietary technology to accelerate live-odds delivery. In 2024, Entain strengthened its position by acquiring Angstrom Sports, gaining proprietary modeling capabilities that enhanced live-odds accuracy and reduced risks from sharp bettors exploiting pricing inefficiencies.
Companies are increasingly utilizing advanced algorithms to thoroughly analyze user behavior, enabling the creation of highly personalized and engaging betting experiences. Furthermore, establishing strategic partnerships with sports leagues, teams, and media organizations has become a critical approach for enhancing market penetration and strengthening brand visibility. The industry is also placing significant emphasis on mobile platforms by developing feature-rich and user-friendly mobile applications to meet the rising demand from the expanding base of smartphone users.
Opportunities remain in underserved areas such as women's soccer and niche esports titles, regions with emerging regulatory frameworks like Brazil and South Africa, and among female bettors. Although they make up less than 30% of active users, female bettors demonstrate higher retention rates. Disruptors like Hard Rock Digital are utilizing their casino brand recognition to promote sports betting, while smaller operators like Rush Street Interactive stand out with superior customer service and localized content. Technology continues to be a critical competitive factor, with operators investing in AI-driven personalization, blockchain for transparent bet settlements, and biometric authentication to simplify onboarding.
Online Sports Betting Industry Leaders
-
DraftKings Inc
-
Hillside (New Media) Limited (Bet365)
-
Evoke Plc (888)
-
Entain Plc
-
Flutter Entertainment Plc
- *Disclaimer: Major Players sorted in no particular order
Online Sports Betting Market Companies Covered in this Report
- Flutter Entertainment plc (FanDuel, Paddy Power)
- Entain Plc (Ladbrokes, bwin)
- Bet365 Group Ltd
- DraftKings Inc.
- Evoke plc (888, William Hill)
- Kindred Group plc
- Betsson AB
- Penn Entertainment Inc. (ESPN BET, theScore)
- PointsBet Holdings Ltd.
- MGM Resorts International (BetMGM JV)
- Caesars Entertainment Inc.
- Sportradar Group AG
- Kambi Group plc
- Fanatics Betting and Gaming
- Super Group Ltd. (Betway)
- Hard Rock Digital
- Rush Street Interactive (BetRivers)
- Mozzart Limited
- SportPesa
- Intralot SA
- Smarkets (Malta) Limited
- Pinnacle Sports Group
- Parimatch Tech

Market Opportunities and Future Outlook
Large-scale market formalization, along with compliance-driven product redesign, is creating near-term opportunities for well-capitalized operators and specialist technology vendors. Brazil’s shift toward regulated licensing, including early operator licenses issued under the new framework, supports onshore customer acquisition and payments normalization versus offshore alternatives. India’s 2026 Online Gaming Rules also set up national oversight, expanding the addressable pool for compliant platforms, including identity verification and responsible-gaming tooling. In mature regulated markets, tightening requirements such as affordability checks, real-time verification, and reporting obligations continue to drive demand for regtech, open-banking integrations, and automated risk controls that can be embedded into sportsbook stacks.
Product and channel opportunities increasingly hinge on data rights, in-play latency, and responsible play automation. Live or in-play already represented 62.35% of betting-type share in 2025 in this study, and operators are expanding micro-betting and same-game parlay experiences that depend on direct league data feeds and rapid odds recalculation. Evidence of continued regulated-market activity supports investment in these capabilities, including the UK Gambling Commission’s reported total online Gross Gambling Yield of GBP 1.55 billion for Jan-Mar 2026 (up 7% year-on-year), and the American Gaming Association’s USD 12.1 billion in US commercial sports betting GGR in 2025. As regulators and sports bodies intensify integrity and consumer-protection scrutiny, operators with scalable identity, fraud, and behavioral analytics, including third-party platforms such as GiG’s X Suite and specialist responsible-gaming solutions, can compete more effectively in higher-compliance jurisdictions while limiting exposure to unlicensed channels.
Recent Industry Developments in Online Sports Betting Market
- June 2026: DraftKings launched DKeX, a proprietary prediction markets exchange integrated into the DraftKings Sportsbook and Casino app. The move internalizes a critical layer of product infrastructure and gives the company tighter control over pricing, risk management, and user experience within regulated workflows.
- July 2025: Flutter Entertainment secured 100% ownership of FanDuel through a new agreement to buy out Boyd Gaming Corporation’s 5% stake and extended the strategic partnership through 2038. Full ownership consolidates economics and product control in the largest US sportsbook brand, while the long-dated partnership supports stable market access and retail-to-digital linkage.
- February 2024: Betsson acquired Holland Gaming Technology Ltd and Holland Power Gaming B.V. for a combined EUR 27.5 million to expand its Dutch-licensed footprint. The transaction strengthened Betsson’s regulated market presence in the Netherlands and improved control over locally compliant content and platform capabilities.


Online Sports Betting Market Report Scope and Research Methodology
Market Definition and Coverage
For this study, the market covers real-money sports wagers placed through online channels, including operator websites and mobile apps, and captured as online sports betting revenue in USD.
Scope exclusions: We exclude retail or on-course betting, social or free-to-play games, casino games, and fantasy contests where outcomes are not settled as sports bets.
Segments Covered in This Report
-
By Sports Type
- Football
- Basketball
- Horse Racing
- Baseball
- Tennis
- Other Sports Type
-
By End User
- Desktop
- Mobile
-
By Betting Type
- Pre-Match /Fixed-Odds
- Live /In-Play
-
By Geography
-
North America
- United States
- Canada
- Mexico
- Rest of North America
-
Europe
- United Kingdom
- Germany
- France
- Italy
- Spain
- Sweden
- Rest of Europe
-
Asia-Pacific
- Oceanic Countries
- Rest of Asia-Pacific
-
Rest of the World
- South America
- Middle East and Africa
-
North America
Data Sources, Market Sizing, and Validation
Desk Research
Desk work starts by mapping the legal online sports betting footprint by country and state, and then tying that footprint to measurable demand signals. Public sources used for this include, for example, gaming regulator releases and annual reports, national statistics agencies for disposable income and internet use, central bank FX rate histories, and international bodies publishing digital economy and payments indicators.
We also review operator filings, investor presentations, earnings call transcripts, and press releases to capture reported online betting revenue, active customer trends, and product mix shifts between pre-match and in-play. Where it helps to validate company level scale, we use paid subscriptions for company financials and intelligence, and a patent database for technology direction (for example, risk management and live odds tooling). This list is not exhaustive, and many other public sources were used for data collection, validation, and clarification during analysis.
Primary Interviews and Surveys
Primary work is used to confirm what is counted as online sports betting revenue in each market, and how splits move between mobile versus desktop and pre-match versus in-play. We speak with a mix of operators, technology and data providers, and industry advisors across APAC, EMEA, and the Americas so assumptions on regulation timing, product take rates, and user behavior can be cross-checked and corrected.
Distribution of primary research fieldwork respondents
| Company type | Respondent position | Region |
|---|---|---|
| Top tier: 30% | CXOs: 14% | APAC: 39% |
| Mid tier: 53% | Functional/Unit leaders: 33% | EMEA: 36% |
| Smaller Players: 17% | Managers: 53% | Americas: 25% |
Market-Sizing & Forecasting
Sizing is built using a top-down approach once, where regulated market revenue pools are reconstructed by geography using published gaming revenue disclosures, licensing counts, and digital adoption indicators, and then filtered to online-only sports wagering. After that, we corroborate with selective bottom-up approximations, such as sampled operator revenue disclosures, channel checks on mobile share, and sanity checks using implied revenue per active account where data is available.
Inputs in the model include the pace of legalization and licensing, the mix shift toward in-play betting, mobile app penetration in betting activity, major sports calendar intensity, and FX conversion timing for cross-country rollups. Forecasts are derived using scenario analysis that reflects different regulatory rollout paths and expected product mix shifts, and these scenarios are tuned using expert consensus gathered in interviews. When company disclosures are missing in a smaller market, gaps are handled by using comparable markets with similar regulation and digital usage, and then adjusting for income levels and sports engagement.
Data Validation & Update Cycle
Outputs are cross-checked against independent signals like regulator totals, published tax receipts where available, and the expected direction of mobile and in-play shares. Variances are reviewed in more than one analyst pass, and outliers trigger a re-check of definitions and, when needed, a follow-up with a source-side expert.
The dataset and assumptions are refreshed annually, with interim updates applied when major legalization changes, taxation shifts, or reporting revisions materially alter the demand pool. Before delivery, a final review pass is completed so the published view reflects the most recent information available.
Mordor Intelligence's Online Sports Betting Market Size Measured Against Other Published Estimates
Published market sizes for online sports betting can differ quite a bit, even when the headline topic looks identical, because the underlying counting logic is not always the same. Most gaps come from what is treated as online sports betting revenue versus adjacent gambling revenue, and from how regulation timing and currency conversion are applied.
The main gap comes from whether a publisher counts total wager amounts or mixes in offline and other gambling categories. Mordor Intelligence treats the market as online-only sports betting revenue from regulated pre-match and in-play wagering and converts to USD using defined FX timing. Differences also show up when one estimate applies aggressive legalization assumptions early in the forecast window, or when mobile and in-play growth is projected with a flat uplift instead of being tied to observed adoption and sports calendar patterns.
Benchmark comparison
| Source | Market Size | Gaps in Research Methodology |
|---|---|---|
| Mordor Intelligence | USD 49.74 B (2026) | |
| Industry Publisher A | USD 42.50 B (2024) | Uses a different base year and does not clearly separate online sports betting revenue from broader online gambling adjacencies in the public summary, which can shift the counted pool and the implied growth path. |
| Research Publisher B | USD 47.50 B (2025) | Includes additional betting constructs in its stated scope (for example, exchange formats and broader payment method coverage), which can widen the definition beyond a strict online sports betting revenue view and change comparability across countries. |
Looking at the three numbers together, the spread is mainly explained by base year choices and by how tightly the scope stays on regulated online sports wagering revenue instead of wager volume or broader gambling categories. When the scope is pinned to clear revenue definitions and the forecast drivers are tied back to legalization pace, in-play mix, mobile usage, and FX timing, the resulting market size is easier to reproduce and to track over time.


Key Questions Answered in the Report
What size will global online sports betting reach by 2031?
It is forecast to climb to USD 92.49 billion, up from USD 49.74 billion in 2026, reflecting a 13.21% CAGR.
Which geography shows the fastest growth in online sports betting through 2031?
North America leads with a projected 13.94% CAGR, driven by new state rollouts and intense operator competition.
Which sports category is expected to expand the quickest?
Tennis is on track for a 13.83% CAGR because point-by-point in-play wagers keep younger bettors engaged throughout Grand Slam events.
Why does desktop still command more than half of online sports betting handle?
Professional bettors favor multi-screen analytics and larger displays, giving desktop a 55.75% share despite mobile convenience.
Page last updated on:




