
Market Overview
| Study Period | 2021 - 2031 |
|---|---|
| Forecast Data Period | 2026 - 2031 |
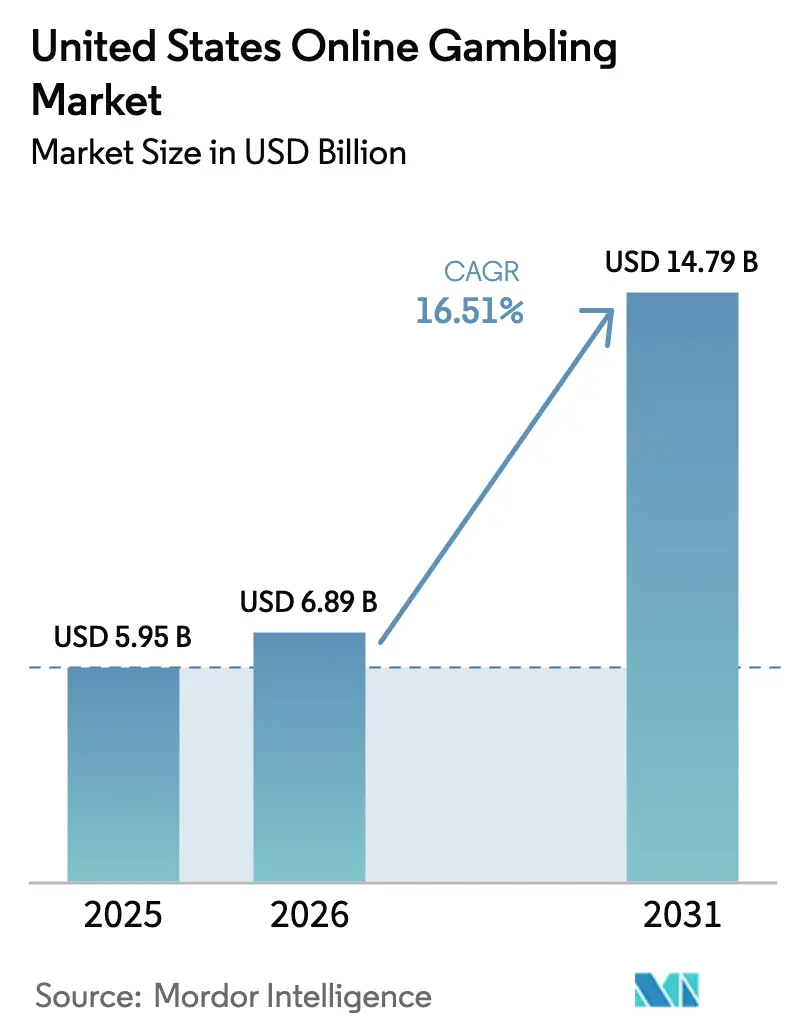
| Base Year Market Size (2025) | USD 5.95 Billion |
| Market Size (2026) | USD 6.89 Billion |
| Market Size (2031) | USD 14.79 Billion |
| Growth Rate (2026 - 2031) | 16.51 % |
| Market Concentration | High |
Major Players *Disclaimer: Major Players sorted in no particular order Image © Mordor Intelligence. Reuse requires attribution under CC BY 4.0. | |
United States Online Gambling Market Analysis by Mordor Intelligence
The United States online gambling market size was valued at USD 5.95 billion in 2025 and is estimated to grow from USD 6.89 billion in 2026 to reach USD 14.79 billion by 2031, at a compound annual growth rate (CAGR) of 16.51% during the forecast period (2026-2031). This growth is driven by strong state-level legalization, the rapid adoption of 5G technology, and the increasing use of mobile payment systems, which together enhance platform engagement. Partnerships such as the DraftKings and ESPN collaboration are converting broadcast audiences into active bettors. Operators are utilizing unified technology stacks across multiple jurisdictions, which reduces marginal expansion costs and enables faster multistate launches. Record iGaming revenue in Michigan demonstrates how diversified casino offerings help mitigate the impact of sports calendar seasonality on revenue. Furthermore, high device penetration, particularly among Generation Z, ensures a consistent influx of new customers into the United States online gambling market.
Key Report Takeaways
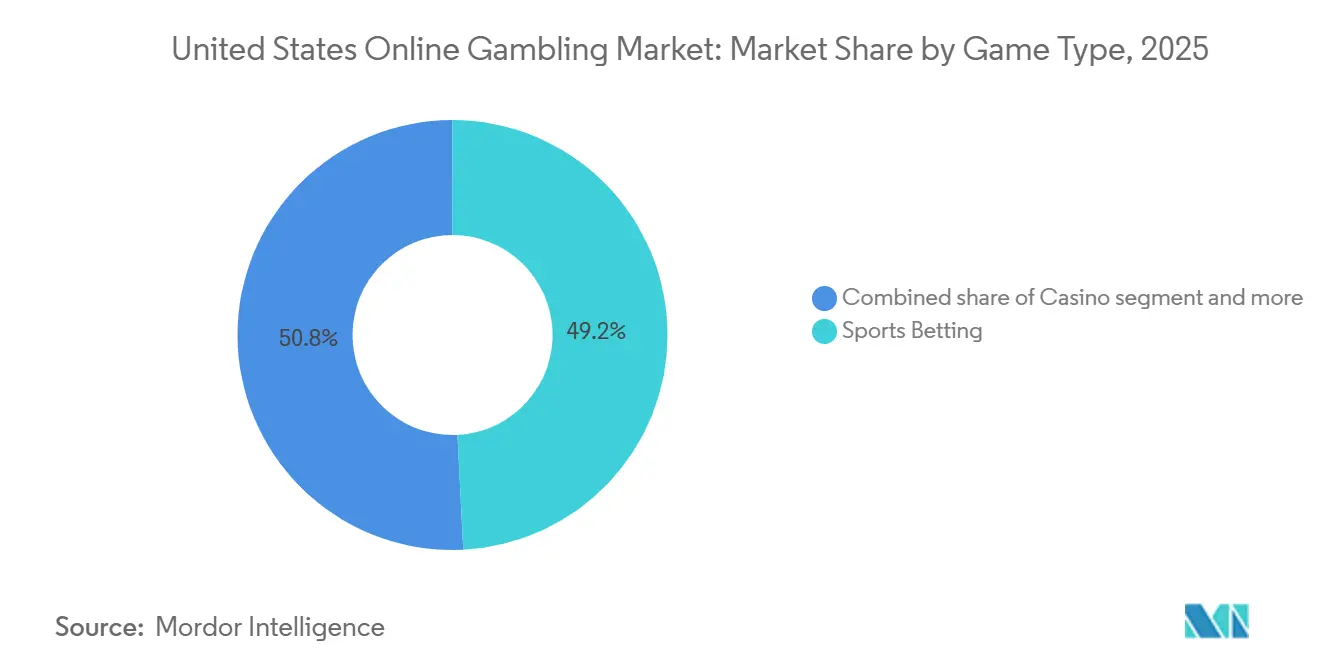
- By game type, sports betting led with 49.21% share of the United States online gambling market in 2025, whereas casino gaming is advancing at a 13.92% CAGR through 2031.
- By gender, male users held 69.01% share of the United States online gambling market in 2025, while the female cohort posts the fastest growth at a 10.12% CAGR.
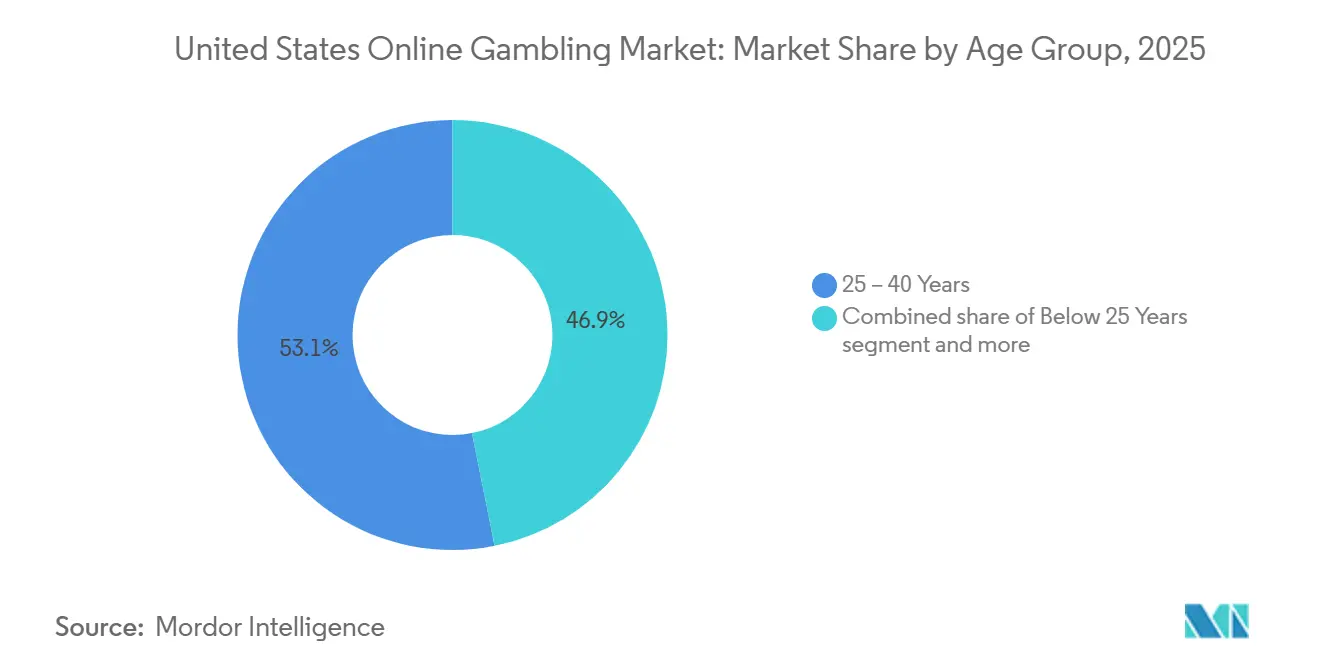
- By age group, the 25-40 years segment captured 53.13% share in 2025, yet the below-25 years cohort is projected to expand at a 14.42% CAGR to 2031.
- By device, mobile commanded 80.13% share of the United States online gambling market in 2025 and is set to grow at a 12.44% CAGR through the forecast period.
Note: Market size and forecast figures in this report are generated using Mordor Intelligence’s proprietary estimation framework, updated with the latest available data and insights as of January 2026.
United States Online Gambling Market Trends and Insights
Drivers Impact Analysis*
| Driver | (~) % Impact on CAGR Forecast | Geographic Relevance | Impact Timeline |
|---|---|---|---|
| High smartphone and broadband penetration enables seamless access to betting platforms anytime, anywhere within legal states | +3.2% | National, concentrated in states with legal frameworks (New York, New Jersey, Pennsylvania, Michigan, Illinois) | Medium term (2-4 years) |
| Integration of live in-play betting enhances user engagement through real-time odds and interactive wagering experiences | +2.8% | National, with higher adoption in mature markets (New Jersey, Nevada, Pennsylvania) | Short term (≤ 2 years) |
| Partnerships between sportsbooks and professional sports leagues increase brand visibility and betting content integration | +2.5% | National, amplified in states hosting major league franchises | Medium term (2-4 years) |
| Adoption of secure digital payments and e-wallets supports instant deposits, withdrawals, and cashless gambling behavior | +2.1% | National, accelerated in tech-forward states (California residents using out-of-state platforms, New York, Massachusetts) | Short term (≤ 2 years) |
| Increasing consumer familiarity with fantasy sports transitions users into regulated online sports betting ecosystems | +1.9% | National, legacy strength in daily fantasy sports (DFS) hubs (New York, California, Texas) | Medium term (2-4 years) |
| Growth of streaming platforms with integrated odds and live stats supports second-screen betting experiences | +1.6% | National, with early gains in cord-cutting demographics (urban centers, younger cohorts) | Long term (≥ 4 years) |
| Source: Mordor Intelligence | |||
High smartphone and broadband penetration enables seamless access to betting platforms anytime, anywhere within legal states
Mobile devices played a significant role in online gambling activity in 2025, a trend supported by the widespread availability of 4G networks and the growing coverage of 5G technology. These advancements enabled instant account access and real-time wagering. Operators improved applications to allow one-tap deposits through Apple Pay and Google Pay, reducing barriers that previously discouraged casual bettors. In 2024, PayPal's integration with major sportsbooks allowed users to fund accounts directly from linked bank accounts, bypassing card-network intermediaries and cutting transaction times to under 10 seconds. Furthermore, Venmo's peer-to-peer architecture was adapted for gambling wallets, enabling users to transfer winnings to friends or share parlay stakes, replicating the social experience of in-person betting. The shift to mobile-first design also incorporated geolocation verification using Global Positioning System (GPS) and Wi-Fi triangulation, ensuring compliance with state boundaries while allowing users to move freely within legal jurisdictions.
Integration of live in-play betting enhances user engagement through real-time odds and interactive wagering experiences
In-play betting now accounts for over 40% of the total sports-betting handle, supported by data feeds from Genius Sports and Sportradar that update odds every 2 to 3 seconds during live events. In 2024, DraftKings introduced micro-betting, enabling wagers on specific events such as individual pitches in baseball or possessions in basketball. This development increased the average session duration by 18 minutes, as reported in the company's third-quarter 2025 earnings call. Dolby's OptiView streaming solution, adopted by select operators in 2025, synchronized video streams with betting interfaces, addressing the previous 5 to 10-second delay that caused odds to shift before users could place bets. This integration of streaming and wagering has transformed passive viewing into an interactive experience, where each play generates new betting opportunities. The National Basketball Association (NBA) incorporated live odds into its League Pass streaming service in 2024, marking a shift from its earlier resistance to sports-betting integration. This change highlights how sports leagues are now monetizing real-time data as a valuable first-party asset.
Partnerships between sportsbooks and professional sports leagues increase brand visibility and betting content integration
The announcement in November 2025 that DraftKings would become ESPN's exclusive sports-betting partner, replacing PENN Entertainment's ESPN Bet, highlights the strategic importance of media distribution over standalone brand equity. ESPN's linear and digital reach, which averages 75 million monthly unique visitors, provides DraftKings with significant advantages such as in-content odds displays, pre-game betting segments, and talent endorsements. These benefits are difficult for competitors to replicate without access to equivalent media platforms. In February 2024, BetMGM entered into an exclusive partnership with X, formerly known as Twitter, integrating live odds into event timelines and enabling users to place bets with a single click without leaving the social platform. Furthermore, in September 2024, the Major League Baseball Players Association (MLBPA) filed a lawsuit against DraftKings and FanDuel over the unauthorized use of player name, image, and likeness (NIL) data. This legal action underscores the growing efforts by athletes to assert intellectual property rights over their statistical profiles, which are used as betting content. Hard Rock International has also indicated its willingness to partner with FanDuel or DraftKings in Florida, provided there are changes to state legislation. This reflects how regional operators are seeking co-branding opportunities to remain competitive with national platforms.
Adoption of secure digital payments and e-wallets supports instant deposits, withdrawals, and cashless gambling behavior
Paysafe's 2024 research revealed that 68% of US online gamblers prefer e-wallets over credit cards, citing enhanced transaction security and speed. In response, operators have integrated platforms such as PayPal, Venmo, Skrill, and Neteller into their checkout processes. FanDuel introduced instant withdrawal functionality in late 2024, leveraging real-time payment rails from The Clearing House's Real-Time Payments (RTP) network. This feature allows users to access their winnings within 15 minutes, compared to the typical 3 to 5 business days required for Automated Clearing House (ACH) transfers. In 2025, Visa issued updated guidelines for digital wallets in gambling, requiring tokenization and biometric authentication to mitigate fraud. As a result, operators have adopted fingerprint and facial recognition technologies for transactions exceeding USD 500. Cryptocurrency adoption remains limited due to regulatory uncertainties, although some offshore-licensed platforms accept Bitcoin and Ethereum in states with less stringent enforcement. The transition to cashless ecosystems has also enabled operators to implement dynamic pricing strategies. These strategies adjust odds and promotions in real time based on a user's wallet balance and betting history, offering personalized incentives that enhance customer lifetime value.
Restraints Impact Analysis*
| Restraint | (~) % Impact on CAGR Forecast | Geographic Relevance | Impact Timeline |
|---|---|---|---|
| Strict advertising regulations restrict promotional messaging, content placement, and targeting for gambling operators | -1.8% | National, with heightened enforcement in Massachusetts, Ohio, Virginia, and during NCAA events | Short term (≤ 2 years) |
| High taxation and licensing fees in leading states reduce operator margins and discourage smaller entrants | -2.3% | Concentrated in high-tax states (New York 51%, Pennsylvania 36%, Illinois 15%) | Medium term (2-4 years) |
| Concerns over problem gambling heighten regulatory scrutiny and demand for stricter consumer protection measures | -1.2% | National, with pilot programs in New Jersey, Michigan, and Massachusetts | Long term (≥ 4 years) |
| Data privacy regulations necessitate strong safeguards for personal and financial information, increasing compliance requirements | -0.9% | National, with California Consumer Privacy Act (CCPA) setting baseline standards | Medium term (2-4 years) |
| Source: Mordor Intelligence | |||
Strict advertising regulations restrict promotional messaging, content placement, and targeting for gambling operators
The National Collegiate Athletic Association (NCAA) has decided to prohibit gambling advertisements during its championship broadcasts, including the widely viewed March Madness, starting in 2024 [1]Source: The National Collegiate Athletic Association, “NCAA launches Draw the Line to address sports betting,” ncaa.org. This change eliminates a significant promotional opportunity that gambling operators had previously leveraged to attract millions of new users. In the same year, Massachusetts introduced regulations requiring that 20% of all gambling advertisements include responsible-gaming messaging. The state also banned celebrity endorsements by athletes under the age of 21, prompting operators to revamp campaigns that had relied heavily on endorsements from prominent figures. Similarly, Ohio implemented rules mandating a 10-second gap between gambling advertisements on television. This regulation prevents consecutive ads, a strategy that had previously helped reduce customer acquisition costs by 15% in states without such restrictions. Meanwhile, Virginia took steps to ban gambling advertisements targeting users under 21 through social media geofencing. This measure requires platforms such as Meta and Snap to implement age-verification processes, which have led to a 30% decline in click-through rates.
High taxation and licensing fees in leading states reduce operator margins and discourage smaller entrants
New York's 51% tax on gross gaming revenue (GGR) generated USD 1.76 billion for the state in the fiscal year 2023-2024. However, this high tax rate significantly reduced operator margins to single digits, leading smaller platforms, such as WynnBET, to exit the market. WynnBET also sold its Michigan internet gaming (iGaming) assets to Caesars in June 2024. In Pennsylvania, the 36% sports-betting tax, combined with a separate iGaming levy, resulted in over USD 1.1 billion in collections during fiscal 2024. To manage the tax burden, operators reduced promotional spending, which caused a 12% year-over-year decline in new-user acquisition [2]Source: Pennsylvania Gaming Control Board, “PA Gaming Control Board Reports Record Monthly Revenue in November Driven by All-Time Highs in Sports Wagering and iGaming,” gamingcontrolboard.pa.gov. Illinois imposes a 15% tax along with a progressive surcharge that reaches 40% for operators with annual revenues exceeding USD 200 million. This structure penalizes larger operators and discourages investment in technology upgrades. Licensing fees vary significantly, ranging from USD 10 million in New York to USD 500,000 in smaller states. These high fees create barriers to entry, limiting competition to well-capitalized incumbents such as Flutter, DraftKings, and MGM. BetMGM's third-quarter 2025 earnings before interest, taxes, depreciation, and amortization (EBITDA) of USD 41 million, achieved after years of losses, highlights that profitability in this market requires multi-state scale to amortize fixed costs. This threshold remains challenging for regional operators to achieve.
*Our forecasts treat driver/restraint impacts as directional, not additive. The impact forecasts reflect baseline growth, mix effects, and variable interactions.
Segment Analysis
By Game Type: Casino Outpaces Sports Betting Growth
Casino gaming is expected to grow at a compound annual growth rate (CAGR) of 13.92% through 2031, surpassing the growth of sports betting, which is projected to hold a 49.21% market share in 2025. This growth is driven by the stronger unit economics of online gaming (iGaming) and favorable regulatory developments in key states. For example, Michigan's iGaming revenue in October 2025 reached USD 278 million, representing a 31.8% year-over-year increase. This performance highlights the consistent engagement generated by live dealer games and slot titles, in contrast to the episodic nature of sports events.
BetMGM reported that its iGaming segment contributed 21% to its 15% overall gross gaming revenue (GGR) market share in the third quarter of 2025. Furthermore, iGaming demonstrated earnings before interest, taxes, depreciation, and amortization (EBITDA) margins that were 8 percentage points higher than sports betting. This is attributed to lower customer acquisition costs and reduced promotional expenses. Similarly, Pennsylvania's iGaming revenue in November 2024 amounted to USD 200 million, reflecting a 27% year-over-year increase. This growth underscores the expansion of slot and table-game libraries, which now feature branded titles from major studios. These branded titles create intellectual property synergies that are not available in sports wagering.



By Gender: Female Segment Redefines User Demographics
The female segment is expected to grow at a compound annual growth rate (CAGR) of 10.12% through 2031, gradually reducing the gap with male users, who held 69.01% of the market share in 2025. This growth is being driven by operators adopting marketing strategies that focus on community and entertainment rather than traditional sports fandom. The American Gaming Association reported that 46% of sports bettors were women in 2024, an increase from 38% in 2020. This rise has been supported by campaigns such as Caesars Sportsbook's "Queen of the Sportsbook," which highlights female athletes and influencers.
Women also make up a significant portion of online casino players, exceeding their participation in sports betting. This is largely due to the popularity of slot and live-dealer games, which require less sports-specific knowledge and therefore lower the barriers to entry. In 2024, FanDuel introduced promotions tailored to women, including risk-free bets associated with Women's National Basketball Association (WNBA) games and partnerships with female sports media personalities. This demographic is recognized for its higher lifetime value, as they tend to have lower churn rates and more consistent wagering patterns.
By Age Group: Gen Z Drives Long-Term Expansion
The Below 25 Years segment is anticipated to grow at a Compound Annual Growth Rate (CAGR) of 14.42% through 2031, making it the fastest-growing age group. However, it faces structural challenges due to 21+ age requirements in most states and National Collegiate Athletic Association (NCAA) restrictions on college-athlete betting. Age-verification technologies from providers such as ID.me, Jumio, and Onfido now utilize biometric facial recognition and document authentication. While these measures help reduce underage access, they also introduce additional steps that may discourage some legitimate users.
The 25-40 Years segment, projected to account for 53.13% of the market share in 2025, serves as the primary revenue base. This group is characterized by higher disposable income and familiarity with digital payment systems. Since 2018, their transition from daily fantasy sports to sports betting has been a significant growth driver. Operators have customized product features such as same-game parlays and cash-out options to align with the risk preferences of this segment.
By Device: Mobile Dominance Reshapes Infrastructure
Mobile devices accounted for 80.13% of the market share in 2025 and are expected to grow at a compound annual growth rate (CAGR) of 12.44% through 2031. This growth has shifted desktop platforms to secondary roles, primarily for account management rather than active wagering. Operators have prioritized the development of iOS and Android applications, achieving load times of under 2 seconds and enabling one-tap bet placement. In comparison, desktop interfaces often require multi-step authentication, making them less efficient. The integration of Apple Pay and Google Pay into mobile applications has reduced deposit friction by 40%, as highlighted in FanDuel's 2024 user-experience analysis. Furthermore, biometric login features, such as Face ID and fingerprint scanning, have effectively addressed issues related to password fatigue.
The expansion of 5G networks, now covering 70% of the United States population, has enabled real-time streaming of live games within betting applications. This advancement has streamlined the user experience by eliminating the need for a second screen, creating a unified platform. As a result, in-play wagering has increased by 30% compared to users who switch between devices.
Geography Analysis
The United States is a leader in the online gambling market, with state-level legalization creating a variety of regulatory frameworks. Operators must navigate these frameworks through multi-jurisdictional licensing and technology requirements. In New York, sports-betting tax revenue reached USD 1.76 billion during the fiscal year 2023-2024, supported by a 51 percent gross gaming revenue (GGR) tax rate, the highest in the nation. Despite challenges such as operator margin compression, New York's annual handle of USD 12 billion makes it the largest market by volume. New Jersey, the first state to legalize sports betting following the repeal of the Professional and Amateur Sports Protection Act (PASPA) in 2018, reported a combined handle of USD 12.4 billion from January to November 2024. Total gaming taxes exceeded USD 1.2 billion, reflecting a well-established ecosystem where internet gaming (iGaming) contributes 55 percent of operator revenue.
Michigan set a state record in October 2025 with iGaming revenue of USD 278 million, representing a 31.8 percent year-over-year increase. This growth was driven by the expansion of live-dealer offerings and slot libraries. Sports betting contributed USD 74 million during the same period, emphasizing the state's preference for casino gaming. Illinois collected USD 162 million in sports-betting taxes during fiscal year 2024 under a progressive tax structure that imposes higher rates on high-revenue operators. This policy has discouraged smaller entrants and concentrated market share among major players such as FanDuel, DraftKings, and BetMGM.
Emerging markets like Ohio, which legalized sports betting in 2023, and Massachusetts, which launched in 2024, are growing rapidly but remain smaller compared to the top five markets. Florida's regulatory environment continues to be complex due to tribal gaming compacts that grant the Seminole Tribe exclusive rights to online sports betting. This arrangement has limited competition and prompted Hard Rock International to explore partnerships with national operators, pending potential legislative changes.
Regulatory Landscape
Online gambling in the United States is regulated at the state level, with product scope and licensing requirements varying by jurisdiction. As of mid-2026, only a small set of states regulate online casino gaming, while federal law continues to anchor the broader framework through the Unlawful Internet Gambling Enforcement Act of 2006 without preempting state rules.
The baseline focuses on geolocation controls, KYC/AML processes, and licensing discipline. State authorities such as the Pennsylvania Gaming Control Board oversee licensing, technical compliance, and enforcement within authorized jurisdictions.
Competitive Landscape
The United States online gambling market is highly concentrated, with FanDuel and DraftKings together controlling a significant portion of the sports-betting handle. This dominance is attributed to their early-mover advantage in daily fantasy sports and their strategic shift to sports wagering following the repeal of the Professional and Amateur Sports Protection Act (PASPA). Flutter Entertainment's FanDuel reported USD 1.1 billion in revenue during the third quarter of 2024, marking a 28% year-over-year increase, with an EBITDA of USD 146 million. Similarly, DraftKings posted USD 1.144 billion in revenue for the third quarter of 2025, showcasing how achieving scale enables profitability through customer lifetime value optimization and reduced promotional expenses.
BetMGM, a joint venture between MGM Resorts and Entain, reached EBITDA positivity in the third quarter of 2025, reporting USD 41 million in earnings on USD 667 million in revenue. This achievement highlights the importance of sustained investment to compete in a market where customer acquisition costs can exceed USD 500 per user in high-tax states. The ability to achieve profitability in such a competitive environment demonstrates the value of long-term strategic planning.
There are still opportunities to address underserved demographics and verticals. For example, Fanatics Sportsbook, which launched in New Jersey in May 2024 and Pennsylvania in January 2024 after acquiring PointsBet's United States assets, utilizes its 95 million e-commerce customer database to cross-sell wagering services. This approach provides a significant distribution advantage by avoiding traditional customer acquisition channels and leveraging an existing customer base.
United States Online Gambling Industry Leaders
Caesars Entertainment Inc.
Bally’s Corporation
Flutter Entertainment plc
DraftKings Inc.
MGM Resorts International
- *Disclaimer: Major Players sorted in no particular order


Market Opportunities and Future Outlook
The clearest opportunity sits in regulated iGaming and online poker in states that permit those products. Operators can leverage shared-liquidity structures to deepen player pools and strengthen game ecology without introducing a separate customer acquisition channel.
By mid-2026, operators continued building cross-state liquidity and content deployment approaches, supported by compliance stacks that help extend content availability across the regulated footprint. Payments, identity, and compliance tooling remain key differentiators as operators compete with offshore and unregulated options, and Regulation GG driven controls and ongoing enforcement shape how geolocation, KYC, age verification, and responsible gaming features evolve.
Recent Industry Developments
- June 2026: DraftKings launched DKeX, a proprietary prediction markets exchange, integrated into the Sports & Casino application. The launch expands DraftKings' product toolkit beyond traditional sportsbook formats and increases control over pricing and user experience through owned exchange infrastructure.
- May 2026: Pennsylvania Gaming Control Board approved phased geolocation, identity verification, and AML enhancements for all licensees, accelerating onboarding across jurisdictions. The decision also strengthens compliance practices for operators operating under PGCB oversight.
- April 2026: DraftKings expanded its regulated footprint by launching a multi-state online poker liquidity network across Michigan, Pennsylvania, and New Jersey. The rollout supports deeper player pools and increased cross-state engagement within the regulated framework.


Research Methodology Framework and Report Scope
Market Definition and Coverage
For this study, the market covers legal, real money gambling placed online in the United States, where wagers are made through websites or apps and revenue is captured as gross gaming revenue reported to regulators.
Scope exclusions: Offshore unlicensed sites and free-to-play social casino style apps are excluded from this market size.
Segmentation Overview
- By Game Type
- Sports Betting
- Football
- Horse Racing
- Tennis
- Other Game Types
- Casino
- Live Casino
- Baccarat
- Blackjack
- Poker
- Slots
- Other Casino Games
- Lottery
- Bingo
- Other Game Types
- Sports Betting
- By Gender
- Male
- Female
- By Age Group
- Below 25 Years
- 25 – 40 Years
- Above 40 Years
- By Device
- Desktop
- Mobile
- Other Devices
Data Sources, Market Sizing, and Validation
Desk Research
Desk work starts with public regulatory releases that show how online gross gaming revenue is reported and how rules differ by state. We also use official data and publications such as state gaming commission dashboards and annual reports, U.S. Census Bureau population and income series, Bureau of Economic Analysis consumer spending indicators, and Bureau of Labor Statistics inflation metrics to keep dollars and demand context consistent.
To cross-check direction and timing, we review trade association publications such as American Gaming Association releases, along with earnings materials, 10-K filings, investor presentations, and reputable financial press coverage. Where available, patent databases help validate platform feature trends that can influence engagement, for example live betting mechanics. For company financials and news tracking, we reference a paid company financials and intelligence subscription and a news and financials subscription. These examples are not exhaustive, and we also relied on other sources for data collection, validation, and clarification.
Primary Interviews and Surveys
Primary work was used to pressure test our assumptions on state rollout timelines, operator reporting behavior, and how gaming revenue mixes shift between casino games and sports wagering. We spoke with operators, platform and service providers, and state level ecosystem participants, and we kept coverage broad across major online gambling states as well as emerging legalization markets. This balance was intended to make sure the model reflects real demand signals rather than only mature-state reporting patterns.
Distribution of primary research fieldwork respondents
| Company type | Respondent position |
|---|---|
| Top tier: 36% | CXOs: 16% |
| Mid tier: 45% | Functional/Unit leaders: 33% |
| Smaller Players: 19% | Managers: 51% |
Market-Sizing & Forecasting
The size model uses a top-down approach where state reported online gross gaming revenue is reconstructed and then aggregated to a national total, with adjustments for timing differences in reporting periods and rule changes. The totals are then corroborated using selective bottom-up checks, such as sampled operator revenue disclosures, channel checks on active state participation, and implied revenue per active adult online gambler, which helps us identify overcounting and undercounting.
A few practical inputs shape the model, including the count of active legal online states by product, the cadence of new launches, and online share of total gaming revenue where reported. We also account for seasonality around major sports calendars, and we use inflation adjusted consumer spending trends to reflect how discretionary budgets move. When gaps exist, for example limited public detail for early stage states, we use ranges validated through interviews and then narrow them using nearby state analogs with similar regulation and population.
For forecasting, we use scenario analysis since outcomes depend heavily on the pace of state legalization, tax and promotional rules, and product availability by state. Assumptions on take rates, expected online adoption, and revenue normalization after launch are reviewed with industry experts so the forward view stays aligned with what operators and regulators are reporting.
Data Validation & Update Cycle
Outputs are checked against independent signals such as publicly released state revenue totals, reported year over year growth rates, and known launch dates, and then the biggest variances are investigated before final sign-off. If a state shows an abnormal jump or drop, we revisit assumptions, recheck source tables, and, when needed, re-contact interviewees to confirm what changed.
Before delivery, we review the latest public releases again so the numbers reflect recent material events such as major state launches, rule changes, and reporting revisions. The report cadence is annual, and interim updates are made when market moving events occur.
Mordor Intelligence's United States Online Gambling Market Size Measured Against Other Published Estimates
Published market sizes for US online gambling often differ because writers mix different revenue lines, apply different legal coverage rules, and sometimes use handle or player spend proxies instead of reported gaming revenue. Timing also matters, since a single new state launch can move the annual run rate quickly.
The table below shows that the widest gaps are driven by scope rather than calculation. In Mordor Intelligence's model, the total is limited to regulated, state licensed real money online gambling revenue reported as taxable gross gaming revenue, instead of broader online gaming activity totals that can blend retail sports betting, adjacent gaming, or non-licensed play.
Benchmark comparison
| Source | Market Size | Gaps in Research Methodology |
|---|---|---|
| Mordor Intelligence | USD 5.95 B (2025) | |
| Industry Association A | USD 22.12 B (2024) | Often presented as combined online gaming and online sports betting revenue, which can represent a broader reported online total than a strictly defined online gambling revenue pool for a single base year, and it is tied to a different year with different legalization and launch timing. |
| Trade Journal B | USD 13.78 B (2024) | Focuses on online sports betting revenue only, so casino style iGaming, online poker, and other regulated online gambling categories are not counted, which naturally pushes the figure below a full online gambling total. |
Taken together, the comparison shows that the biggest driver is scope, not math. By anchoring the model to state reported online gross gaming revenue, and then validating with launch timing and mix shifts between products, we get a transparent figure that can be traced back to clear public signals and repeatable checks.


Key Questions Answered in the Report
What is the current value of online gambling in the United States?
The sector is worth USD 6.89 billion in 2026 and is projected to reach USD 14.79 billion by 2031, reflecting a 16.51% CAGR.
Which states collect the most online gambling taxes?
New York tops the list with USD 1.76 billion in fiscal 2023-2024, while Pennsylvania follows with more than USD 1.1 billion for the same period.
How quickly is mobile wagering expanding?
Mobile devices already account for 80.13% of wagers in 2025 and are growing at a 12.44% CAGR through 2031.
Who are the dominant operators in U.S. online gambling?
FanDuel and DraftKings together control about 70% of total handle, with BetMGM a distant third but recently EBITDA-positive.
Page last updated on:


 Your data is secure and never sold or shared.


