Traditional Toys And Games Market Size and Share
Market Overview
| Study Period | 2021 - 2031 |
|---|---|
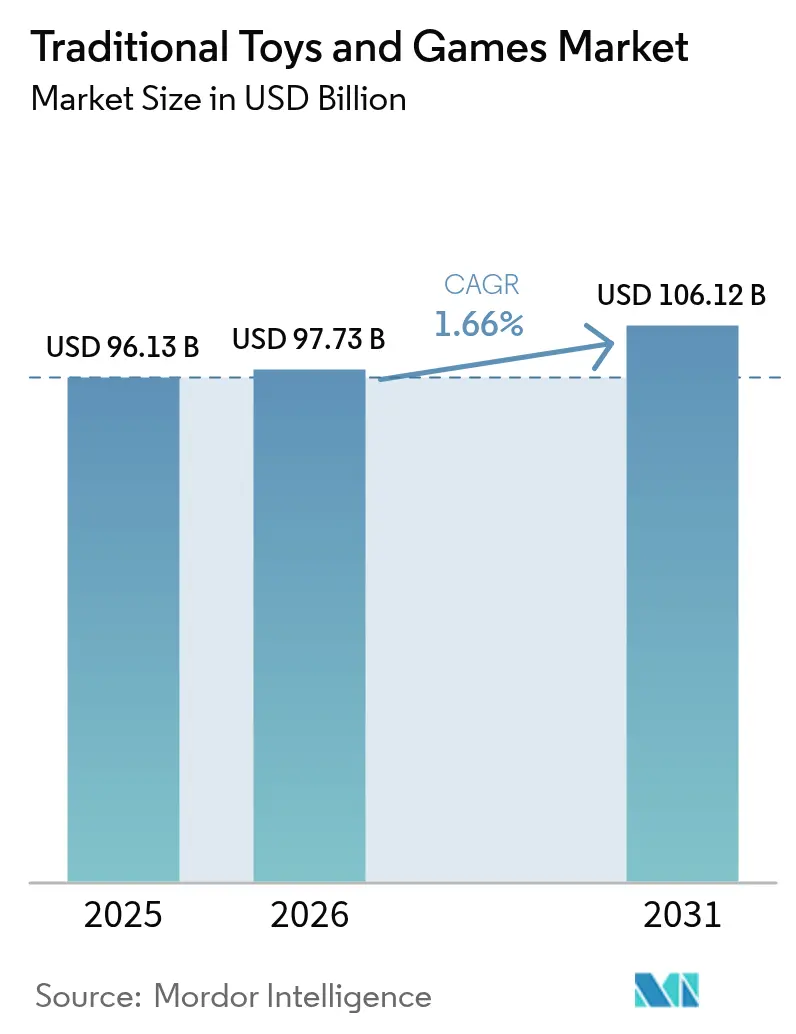
| Market Size (2026) | USD 97.73 Billion |
| Market Size (2031) | USD 106.12 Billion |
| Growth Rate (2026 - 2031) | 1.66% CAGR |
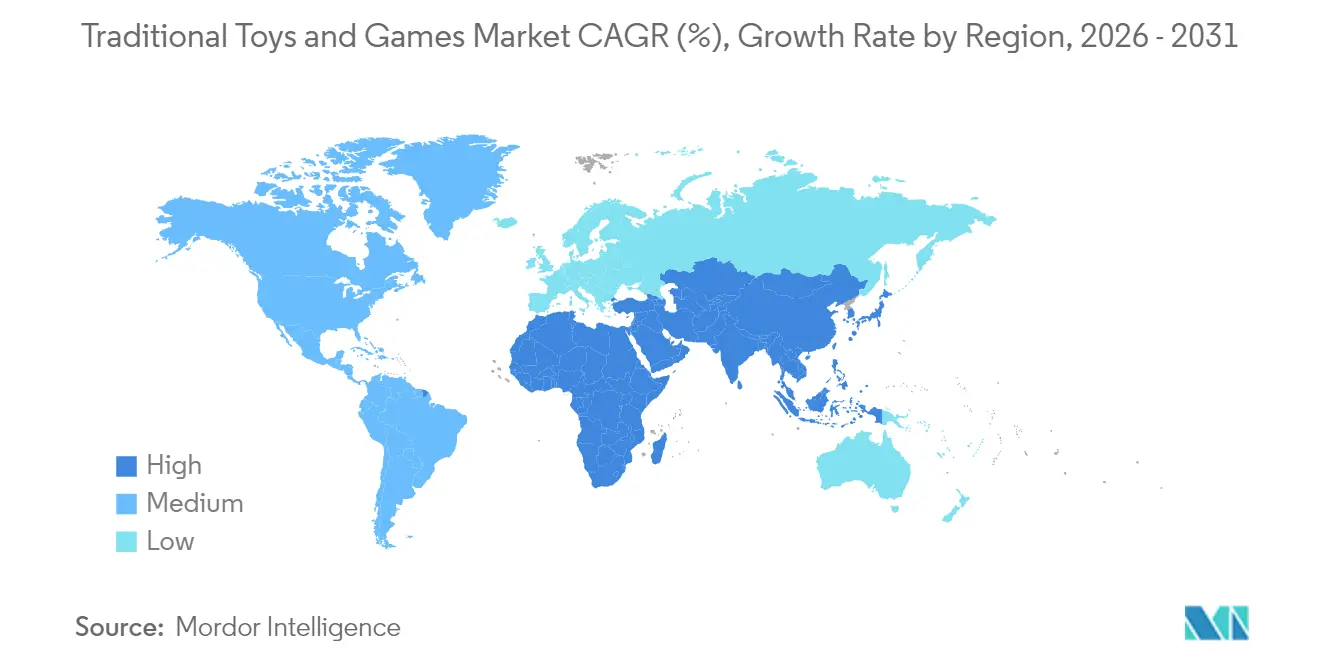
| Fastest Growing Market | Asia Pacific |
| Largest Market | North America |
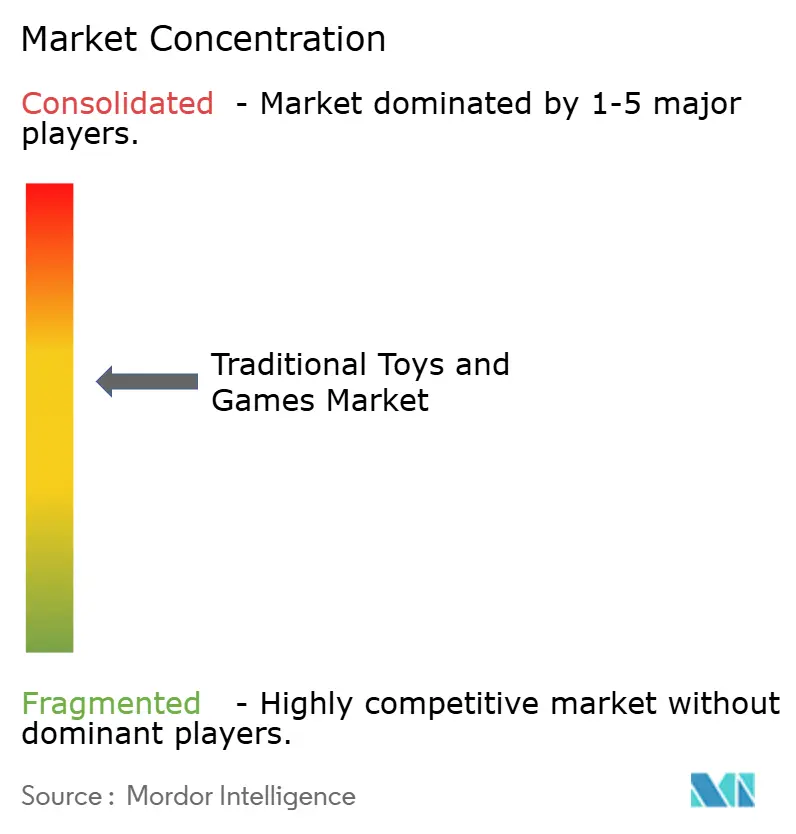
| Market Concentration | Medium |
Major Players
*Disclaimer: Major Players sorted in no particular order Image © Mordor Intelligence. Reuse requires attribution under CC BY 4.0. |
|
Traditional Toys And Games Market Analysis by Mordor Intelligence
The global traditional toys and games market size was valued at USD 96.13 billion in 2025 and estimated to grow from USD 97.73 billion in 2026 to reach USD 106.12 billion by 2031, at a CAGR of 1.66% during the forecast period (2026-2031). Parents' preference for toys with educational and developmental benefits, especially STEM-focused products and eco-friendly options, supports market expansion. The enduring appeal of classic toys, strong brand recognition, and hands-on play experiences maintain market stability despite competition from video games, mobile apps, and digital entertainment platforms. Manufacturers continue to address supply chain challenges while adapting to consumer preferences. Additionally, increasing parental concerns about excessive screen time strengthen the market as families incorporate traditional toys to promote balanced childhood development. These market dynamics indicate sustained growth potential for traditional toys, particularly in segments that emphasize learning and development.
Key Report Takeaways
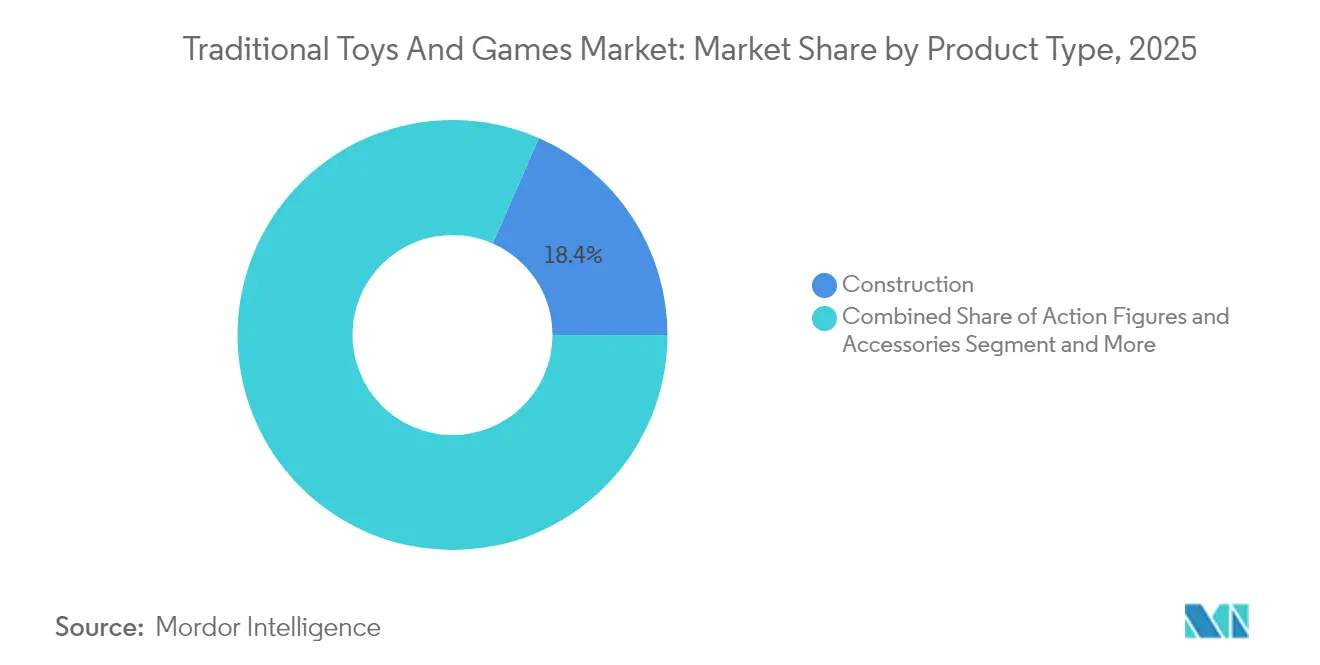
- By product type, construction toys captured 18.42% of the global toy market share in 2025, while games and puzzles are projected to expand at a 1.98% compound annual growth rate (CAGR) through 2031.
- By mode of operation, manual toys accounted for 73.88% of the global toy market size in 2025; electric/battery-operated toys are expected to lead growth with a 2.38% CAGR to 2031.
- By age group, the children/teenager cohort accounted for 63.92% of the global toy market size in 2025, whereas infant and toddler toys are set to grow at a 3.75% CAGR in the forecast period.
- By category, mass-market products held 69.02% revenue share in 2025, but premium toys are advancing at a 3.11% CAGR through 2031.
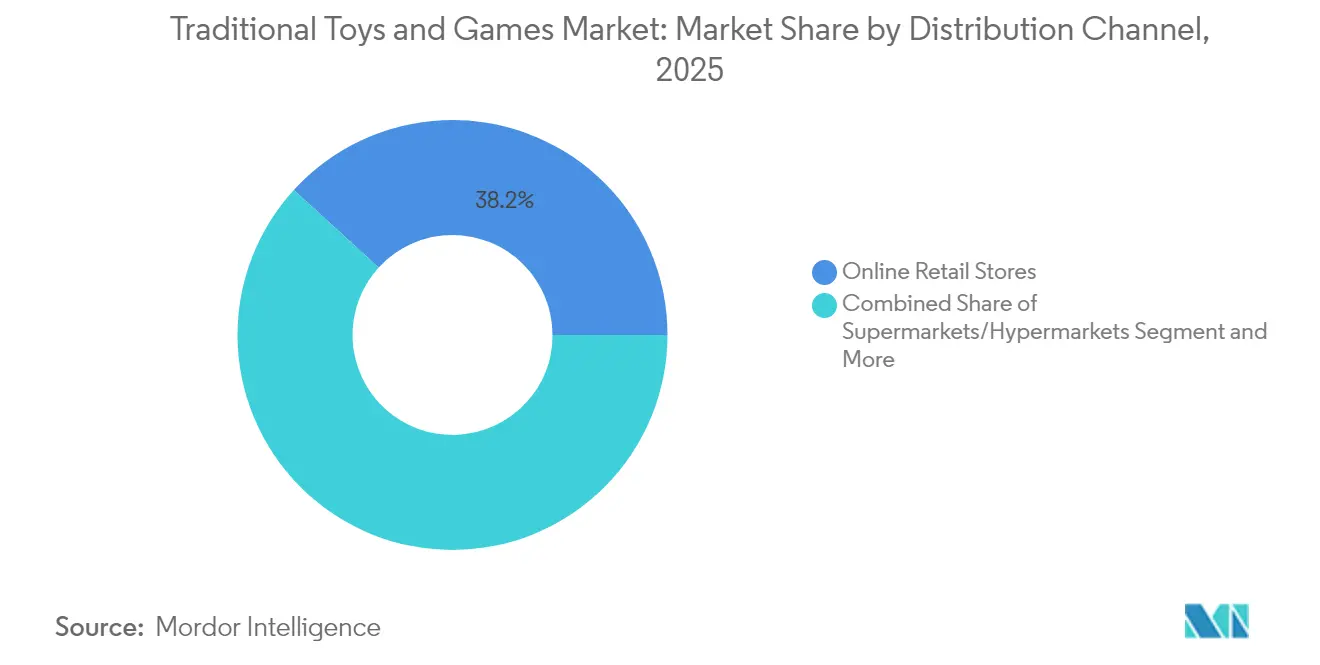
- By distribution channel, online retail stores dominated with a 38.21% share in 2025 and will rise at a 3.62% CAGR to 2031.
- By geography, North America led with 34.21% of the global toy market size in 2025, yet Asia-Pacific is poised for the fastest regional CAGR at 4.15% between 2026-2031.
Note: Market size and forecast figures in this report are generated using Mordor Intelligence’s proprietary estimation framework, updated with the latest available data and insights as of 2026.
Global Traditional Toys And Games Market Trends and Insights
Drivers Impact Analysis*
| Driver | (~) % Impact on CAGR Forecast | Geographic Relevance | Impact Timeline |
|---|---|---|---|
| Educational toy demand | +0.8% | Global; early gains in North America, Europe, APAC | Medium term (2-4 years) |
| Construction toy popularity | +0.6% | Global | Short term (≤ 2 years) |
| Health and outdoor play awareness | +0.4% | North America & EU; spill-over to APAC | Medium term (2-4 years) |
| Technological integration with traditional toys | +0.5% | APAC core, North America, selective EU markets | Long term (≥ 4 years) |
| Sustainability and eco-friendly materials | +0.3% | EU, North America, global premium segment | Long term (≥ 4 years) |
| Growth of 3D games and graphics | +0.2% | Developed markets worldwide | Medium term (2-4 years) |
| Source: Mordor Intelligence | |||
Increasing Demand of Educational Toys
Educational toy demand is experiencing significant growth, driven by parents' increasing emphasis on STEM learning and cognitive development over passive entertainment. This shift is reflected in rising export figures, with China's toy exports reaching USD 2.94 billion in April 2025, indicating robust market expansion[1]Source: China Customs, “China: monthly toy exports,” english.customs.gov.cn. Parents' growing concerns about excessive screen time have led to a preference for hands-on learning experiences that develop spatial reasoning, problem-solving abilities, and persistence. STEM toys effectively combine learning with play, making complex concepts more accessible and enjoyable for children while enhancing critical thinking skills. This trend is exemplified by recent market developments, such as the October 2024 launch of the Wondery Kids and Wow in the World STEM toy line, which integrates educational elements into traditional toys to foster meaningful engagement between children and caregivers. The integration of technology in educational toys, such as coding robots and augmented reality learning tools, has further enhanced their appeal among tech-savvy parents seeking balanced educational experiences. Additionally, manufacturers are responding to this demand by investing in research and development to create innovative educational toys that align with current educational curricula and developmental milestones.
Rising Popularity of Construction Toys
Construction toys are experiencing a renaissance driven by their cross-generational appeal and technological integration. These toys, including building blocks and Lego sets, stimulate cognitive development, enhance fine motor skills, and foster creativity while encouraging problem-solving, logical thinking, and engineering skills. The category's growth is further amplified by social media platforms showcasing elaborate builds, creating viral marketing effects that traditional advertising cannot replicate. Manufacturing innovations enable increasingly sophisticated designs while maintaining safety standards, with players like Mattel, which launched its Brick Shop brand in May 2025, challenging established players in high-growth building set segments. The integration of augmented reality features and mobile applications has added new dimensions to traditional construction play patterns, allowing children to interact with their physical creations in digital environments. Educational institutions increasingly incorporate construction toys into their STEM curricula, recognizing their value in developing spatial awareness and engineering concepts. Additionally, the rise of adult fans of construction toys has led to the development of more complex sets targeting mature audiences, expanding the market beyond its traditional youth demographic.
Health and Outdoor Play Awareness
The growing recognition among parents of the developmental benefits of tactile, three-dimensional play experiences over screen-based activities is driving the traditional toys and games market. This trend particularly benefits categories like sports equipment, outdoor games, and physical building sets that promote motor skill development and social interaction. The movement is supported by pediatric recommendations limiting screen time for young children and research linking physical play to cognitive development and emotional regulation. According to Toy Association data, retail sales of outdoor and sports toys in the United States reached approximately USD 4.3 billion in 2024[2]Source: Toy Association, "Outdoor and sports toy retail sales in the United States from 2020 to 2024", toyassociation.org. The Children's Hospital of Philadelphia emphasizes that outdoor play helps children socialize, understand their bodies better, engage in imaginative play, and enjoy the outdoors[3]Source: Children’s Hospital of Philadelphia, “Benefits of Outdoor Play,” chop.edu. This growing preference for traditional play experiences is reflected in the market performance. Manufacturers are responding to this trend by developing innovative outdoor play equipment and traditional toys that incorporate educational elements while maintaining their physical nature. Additionally, schools and educational institutions are increasingly incorporating traditional play-based learning methods into their curricula, further strengthening the market demand for conventional toys and games.
Sustainability and Eco-Friendly Materials
Environmental consciousness is transforming material sourcing and production processes across the toy industry, with key players investing heavily in sustainable alternatives. For instance, in March 2024, PLAYMOBIL selected plant-based styrenics material from INEOS Styrolution for new sustainable toys. Consumer willingness to pay premiums for eco-friendly toys is driving innovation in bioplastics, recycled materials, and packaging reduction, addressing mounting criticism of the industry's plastic waste contribution while creating competitive differentiation opportunities for early adopters. This shift toward sustainable practices is expected to significantly influence the traditional toys and games market's growth trajectory in the coming years. Industry participants are increasingly incorporating recycled ocean plastics and biodegradable materials into their production processes, demonstrating their commitment to environmental stewardship. Additionally, market leaders are redesigning packaging to minimize waste and implementing take-back programs to ensure proper recycling of end-of-life products.
Restraints Impact Analysis*
| Restraint | (~) % Impact on CAGR Forecast | Geographic Relevance | Impact Timeline |
|---|---|---|---|
| Digital and screen-based entertainment | -0.9% | Global | Short term (≤ 2 years) |
| Supply-chain disruptions and raw-material shortages | -0.6% | Global; China-dependent chains | Medium term (2-4 years) |
| Competition from educational apps | -0.4% | North America, Europe, urban APAC | Medium term (2-4 years) |
| Stringent regulatory and safety standards | -0.3% | EU and North America | Long term (≥ 4 years) |
| Source: Mordor Intelligence | |||
Intense Competition from Digital and Screen-Based Entertainment
Digital entertainment platforms, including video games, streaming content, and social media, pose a significant threat to traditional toy engagement. According to the Entertainment Software Association's 2024 data, 83% of parents play video games with their children, indicating the growing prevalence of digital entertainment in family activities[4]Source: Entertainment Software Association, “Essential Facts About the U.S. Video Game Industry 2024,” theesa.com . The increasing time spent on these digital platforms, which offer instant gratification and social connectivity, particularly appeals to children and restrains the growth of the traditional toys and games market. This shift in entertainment preferences has prompted traditional toy manufacturers to adapt their strategies, with many incorporating digital elements into their product offerings. The integration of augmented reality features and app-connected toys represents manufacturers' efforts to remain competitive in an increasingly digitalized play environment. Studies show that children aged 5-12 spend an average of 4-6 hours daily on digital devices, further highlighting the challenge faced by traditional toy manufacturers.
Rising Competition from Educational Apps and E-Learning Tools
Educational technology platforms create a significant market restraint for traditional toys and games, as consumers increasingly shift towards digital learning solutions. These platforms deliver interactive learning experiences with personalized paths, immediate feedback, and progress tracking capabilities that conventional toys cannot replicate. The COVID-19 pandemic accelerated the adoption of digital learning solutions, establishing persistent usage patterns that continue to influence consumer behavior. This shift in learning preferences compels traditional toy manufacturers to emphasize their unique advantages in tactile learning, spatial reasoning development, and face-to-face social interaction to maintain market relevance. Many traditional toy manufacturers are responding by incorporating hybrid elements that combine physical play with digital components to stay competitive. Parents increasingly seek toys that offer both educational value and traditional play experiences, creating opportunities for innovative product development. The continuous evolution and accessibility of educational technology platforms present an ongoing challenge for traditional toy manufacturers, potentially limiting their market growth and requiring constant adaptation to maintain competitiveness.
*Our forecasts treat driver/restraint impacts as directional, not additive. The impact forecasts reflect baseline growth, mix effects, and variable interactions.
Segment Analysis
By Product Type: Construction Leads Innovation-Driven Growth
Construction toys dominate the traditional toys and games market with an 18.42% share in 2025, driven by their perceived educational value and appeal across multiple generations. This segment's success extends beyond children to engage adults, while Games and Puzzles emerge as the fastest-growing category with a projected 1.98% CAGR from 2026-2031, reflecting increased family engagement and focus on cognitive development. Action Figures and Accessories maintain robust performance through licensed properties and collectibles, though Dolls and Accessories face challenges from evolving play patterns and digital entertainment alternatives.
Model Vehicles show sustained growth by targeting adult collectors and incorporating premium detailing, with particular emphasis on electric and autonomous vehicle themes. The market also encompasses various emerging categories, including STEM kits and sensory toys, which address specific developmental requirements and therapeutic applications, demonstrating the industry's adaptation to changing consumer needs and educational priorities. These specialized segments benefit from increasing parental awareness of developmental milestones and educational benchmarks in early childhood. Additionally, manufacturers continue to innovate within these categories by incorporating sustainable materials and eco-friendly packaging to align with growing environmental consciousness among consumers.


By Mode of Operation: Manual Dominance Faces Electric Innovation
Manual toys continue to dominate the market with a 73.88% share in 2025, as consumers consistently prefer tactile, hands-on play experiences that enhance creativity and motor skill development. While electric/battery operated toys represent a smaller segment, they exhibit stronger growth potential with a 2.38% CAGR, driven by increasing emphasis on early learning and parental investment in developmental toys. This preference for manual toys is particularly evident in emerging markets, where traditional play patterns remain deeply ingrained in cultural practices. Additionally, the lower price points and durability of manual toys contribute to their sustained market leadership, especially in price-sensitive regions.
The electric toy segment faces regulatory challenges, particularly from Consumer Product Safety Commission proposals regarding button and coin cell battery safety, which may necessitate design modifications and increase compliance costs. However, advancements in battery life, safety features, and interactive capabilities are enabling manufacturers to expand electric toy applications beyond traditional categories into educational and therapeutic markets, supporting the segment's growth trajectory. The integration of smart features and connectivity options in electric toys is creating new opportunities for manufacturers to differentiate their products. Furthermore, the growing focus on STEM education has led to increased demand for programmable and tech-enabled toys, despite the regulatory hurdles.
By Age Group: Children/Teenager Segment Drives Market Dynamics
The children/teenager segment (2-18 years) dominates the toy market with a 63.92% share in 2025, while the infant and toddler segment (below 2 years) exhibits the highest growth rate at 3.75% CAGR from 2026-2031. The infant and toddler segment maintains consistent demand through developmental toys and safety-certified products, while the children/teenager segment's expansion is driven by the emerging kidult market phenomenon. The parents are increasingly prioritizing educational value in toys for children aged 2-18 years, leading to higher spending in this segment. Additionally, the integration of technology in traditional toys has created new opportunities within the children/teenager segment, particularly in STEM-focused products.
The growing trend of adult consumers purchasing toys for personal enjoyment rather than gifting has transformed traditional age-based consumption patterns. This shift has prompted manufacturers to adapt their product development and marketing strategies, particularly in collectibles, construction sets, and licensed properties that combine nostalgic appeal with display value. Consumer insights show that adults aged 25-40 represent a significant portion of premium toy purchases, especially in categories like action figures and limited-edition collectibles. Furthermore, social media communities centered around toy collecting have strengthened this market segment, encouraging manufacturers to release more sophisticated and detailed products that appeal to adult collectors.
By Distribution Channel: Online Retail Transforms Market Access
Online retail stores dominate the market with a 38.21% share in 2025 and are projected to grow at a CAGR of 3.62% from 2026-2031. This leadership position stems from accelerated digital adoption and consumer preference for convenience, which has continued beyond the pandemic period. While specialty retail stores maintain their relevance through experiential shopping and expert guidance, supermarkets and hypermarkets face increasing pressure from online competition and declining impulse purchases. The integration of mobile shopping applications and seamless payment systems has further strengthened online retail's market position. Additionally, the expansion of same-day delivery services in urban areas has addressed immediate gratification needs, traditionally a strength of physical retail.
The e-commerce channel's growth is supported by enhanced logistics networks, virtual try-before-buy technologies, and effective social media marketing that facilitates product discovery and viral trends. This digital transformation has created opportunities for smaller manufacturers to access global markets without significant retail infrastructure investments, while alternative channels like direct-to-consumer platforms and subscription services offer personalized product curation and exclusive offerings. The implementation of artificial intelligence for personalized recommendations and inventory management has improved the online shopping experience. Furthermore, the integration of augmented reality tools for product visualization has reduced return rates and increased consumer confidence in online purchases.
By Category: Premium Segment Capitalizes on Quality Focus
Mass market toys command a dominant 69.02% market share in 2025, driven by consumer price sensitivity and volume-focused retail strategies. However, the Premium toys segment is experiencing faster growth at a 3.11% CAGR from 2026-2031, as consumers increasingly value superior quality, educational features, and sustainable production methods. This shift reflects a growing willingness to invest in durable toys that offer long-term value, particularly benefiting established brands with strong safety records and innovative features. The mass market segment maintains its position through extensive distribution networks and economies of scale, enabling competitive pricing strategies. Additionally, mass market manufacturers focus on licensed products and popular entertainment franchises to maintain market relevance and consumer appeal.
The premium segment's growth aligns with evolving consumer preferences that emphasize quality over quantity and educational value. Companies like LEGO exemplify successful premium positioning through their commitment to innovation, rigorous safety standards, and brand heritage. This strategic approach enables them to maintain higher price points and margins, which in turn supports continued research and development investments for market expansion. Premium toy manufacturers are increasingly incorporating advanced technologies and sustainable materials in their products to justify premium pricing. The segment also benefits from growing parental awareness about the developmental benefits of high-quality educational toys, leading to increased investment in premium products despite their higher cost.
Geography Analysis
North America holds the dominant market position with a 34.21% share in 2025, supported by high disposable income levels, robust toy safety regulations, and well-developed retail infrastructure. The region's market strength is further reinforced by the presence of major toy company headquarters in Los Angeles. The market benefits from sophisticated e-commerce platforms and omnichannel retail strategies that enhance consumer accessibility to toy products. Additionally, the region's strong intellectual property protection framework encourages innovation and investment in new toy development.
Asia-Pacific is experiencing the most rapid market expansion with a projected CAGR of 4.15% during 2026-2031. While China maintains its position as the primary manufacturing hub for US and European toys, increasing labor costs and trade tensions are prompting companies to diversify their supply chains. India's manufacturing transformation is contributing significantly to the region's growth trajectory. The emergence of local toy brands in countries like Japan and South Korea is reshaping regional market dynamics. The growing middle-class population across Southeast Asian nations is also driving increased toy consumption and market expansion.
Europe exhibits steady market growth, characterized by strict safety standards and sustainability requirements that influence product development. The region's strong focus on environmental responsibility has increased demand for eco-friendly toys and sustainable packaging, creating market opportunities for manufacturers who adopt environmentally conscious production methods. The market is particularly influenced by the European Union's comprehensive toy safety directives, which set global benchmarks for quality and safety standards. The region's emphasis on educational and developmental toys aligns with consumer preferences for products that combine learning with play.

Competitive Landscape
The global toy market demonstrates moderate concentration with oligopolistic characteristics, as major players like LEGO, Mattel, and Hasbro hold substantial market shares while smaller companies operate in niche segments. Companies focus on brand portfolio diversification, entertainment property licensing, and expansion into emerging markets to maintain competitive positions. Market consolidation continues through strategic acquisitions and partnerships, enabling larger companies to strengthen their market presence. The industry's competitive dynamics are further shaped by regional preferences and distribution networks, with successful companies maintaining strong relationships with retailers and e-commerce platforms.
Technology integration has become essential for market differentiation, with companies incorporating AI-powered personalization, augmented reality experiences, and connected play platforms to enhance user engagement beyond physical products. Additionally, manufacturers are diversifying their supply chains away from China in response to trade tensions and sustainability concerns, creating opportunities for companies with flexible and regional production capabilities. Digital transformation initiatives extend to manufacturing processes, improving efficiency and reducing production costs. The integration of data analytics enables companies to better understand consumer preferences and optimize product development cycles.
The market continues to evolve as manufacturers explore new segments and opportunities. For instance, Jazwares' introduction of BLDR, a construction toy brand in February 2025, demonstrates the industry's expansion into new categories. Companies are also targeting previously underserved segments, including sustainable toy manufacturing, educational technology integration, and adult collector markets. Innovation in materials and manufacturing processes has enabled the development of more environmentally friendly products. The rise of direct-to-consumer sales channels has created new opportunities for market entry and brand development.
Traditional Toys And Games Industry Leaders
-
Mattel
-
Hasbro
-
TOMY Company Ltd
-
Kirkbi A/S
-
Bandai Namco Holdings, Inc.
- *Disclaimer: Major Players sorted in no particular order

Recent Industry Developments
- May 2025: LEGO opened Asia’s largest store in India through a partnership with Ample Group, expanding from its online presence and multi-brand retailers to a dedicated retail location.
- April 2025: Hasbro renewed its multi-year licensing agreement with Disney Consumer Products to continue manufacturing toys and games based on Star Wars and Marvel properties.
- February 2025: Hasbro introduced PLAY-DOH Barbie playsets through a licensing agreement with Mattel. The product line features dolls with fashion-making tools that enable children to design and create their own PLAY-DOH clothing and accessories.
- September 2024: Cobi initiated a partnership with Hobbycraft through a soft launch of its core products in select Hobbycraft premium locations; broader rollout is planned before the Christmas season.


Research Methodology Framework and Report Scope
Market Definitions and Key Coverage
Our study defines the traditional toys and games market as retail and institutional sales of non-digital playthings, including action figures, construction sets, dolls, model vehicles, board games, puzzles, plush, and sports and outdoor toys, designed for manual or battery-assisted use by children or adult collectors.
Products whose primary play value is delivered through video, mobile, or VR software lie outside this report.
Segmentation Overview
-
By Product Type
- Action Figures and Accessories
- Construction
- Dolls and Accessories
- Games and Puzzles
- Model Vehicles
- Other Product Types
-
By Mode of Operation
- Manual
- Electric/Battery Operated
-
By Age Group
- Infant and Toddler (Below 2 Years)
- Children/Teenager (2-18 Years)
-
By Category
- Mass
- Premium
-
By Distribution Channel
- Supermarkets/Hypermarkets
- Specialty Retail Stores
- Online Retail Stores
- Others
-
By Geography
-
North America
- United States
- Canada
- Mexico
- Rest of North America
-
Europe
- Germany
- United Kingdom
- Italy
- France
- Spain
- Netherlands
- Poland
- Belgium
- Sweden
- Rest of Europe
-
Asia-Pacific
- China
- India
- Japan
- Australia
- Indonesia
- South Korea
- Thailand
- Singapore
- Rest of Asia-Pacific
-
South America
- Brazil
- Argentina
- Colombia
- Chile
- Peru
- Rest of South America
-
Middle East and Africa
- South Africa
- Saudi Arabia
- United Arab Emirates
- Nigeria
- Egypt
- Morocco
- Turkey
- Rest of Middle East and Africa
-
North America
Detailed Research Methodology and Data Validation
Primary Research
Mordor analysts interviewed manufacturers, specialty retailers, national toy guilds, and logistics providers across North America, Europe, Asia-Pacific, and Latin America. Discussions validated channel splits, checked seasonality assumptions, and refined our pricing ladder for premium versus mass categories before we finalized the model.
Desk Research
We started with macro indicators from sources such as the UN Comtrade database (global HS-9503 export flows), the World Bank's child population tables, and retail sales audits released by The Toy Association, Eurostat, and StatCan, which helped us benchmark volume and spending patterns. Company filings accessed through D&B Hoovers offered insight on segment revenue mixes, while Dow Jones Factiva tracked price moves and licensing deals shaping average selling prices. Supplementary signals came from patent counts in Questel and safety-recall alerts published by the US Consumer Product Safety Commission. This list is illustrative; numerous additional open-source documents were reviewed throughout secondary data collection.
Market-Sizing & Forecasting
A hybrid top-down build began with country-level retail expenditure on traditional toys, adjusted for gray-market leakage and institutional demand, and was corroborated through bottom-up spot checks, including selected supplier revenues, import values, and sampled ASP × unit calculations to close gaps. Key inputs included: 1) births and 0-14-year population, 2) per-capita disposable income, 3) e-commerce share of total toy sales, 4) licensing deal counts for entertainment franchises, 5) resin and cardboard cost indices that sway pricing, and 6) toy-safety regulatory revisions that can suppress or boost volumes. A multivariate regression, supported by scenario analysis around economic growth bands, projected demand to 2030. Outlier years were smoothed with exponential smoothing where volatility exceeded two standard deviations.
Data Validation & Update Cycle
Outputs pass a three-layer review, including analyst, senior peer, and research manager, before sign-off. Material variances trigger re-contact with sources, and each dataset is rerun annually, with interim refreshes when recalls, tariff changes, or large M&A events occur, ensuring clients receive the latest vetted view.
Why Our Traditional Toys And Games Baseline Earns Trust
Published estimates differ because firms vary in scope, channel coverage, price-mix assumptions, and refresh cadence.
Key gap drivers here include whether video-linked smart toys sneak into totals, how collector-grade ASP inflation is handled, the depth of gray-market netting, and the cadence at which exchange rates are frozen. Mordor's study fixes a child and kidult only scope, applies live FX averaging, and is updated every twelve months, which together deliver a balanced midpoint for decision-makers.
Benchmark comparison
| Market Size | Anonymized source | Primary gap driver |
|---|---|---|
| USD 96.13 B (2025) | Mordor Intelligence | - |
| USD 96.31 B (2024) | Global Consultancy A | Counts institutional learning aids within totals |
| USD 104.8 B (2025) | Trade Journal B | Includes smart-connected toys and uses constant 2023 FX rates |
| USD 9.63 B (2025) | Industry Association C | Covers North America only; excludes mass retail private labels |
These contrasts show that once definitions, channels, and currency treatments are aligned, Mordor's number stands as a transparent, reproducible baseline that bridges aggressive and conservative viewpoints.


Key Questions Answered in the Report
What is the current size of the global traditional toys and games market?
The global traditional toys and games market reached USD 97.73 billion in 2026.
How fast will the global traditional toys and games market grow through 2031?
The market is projected to advance at a 1.66% CAGR, reaching USD 106.12 billion by 2031.
Which product segment holds the largest share in the global traditional toys and games market?
Construction toys led with an 18.42% share in 2025 due to cross-generational educational appeal.
What distribution channel is expanding fastest?
Online retail stores, which captured 38.21% share in 2025, are set to grow at a 3.62% CAGR through 2031.
Why are premium toys gaining traction?
Consumers value durability, educational features, and sustainable materials, driving premium toys to a 3.11% CAGR outlook.
Which region will offer the highest growth rate?
Asia-Pacific is forecast to post a 4.15% CAGR between 2026-2031 thanks to rising middle-class spending and supply-chain localization.
Page last updated on:


