
E-book Market Analysis by Mordor Intelligence
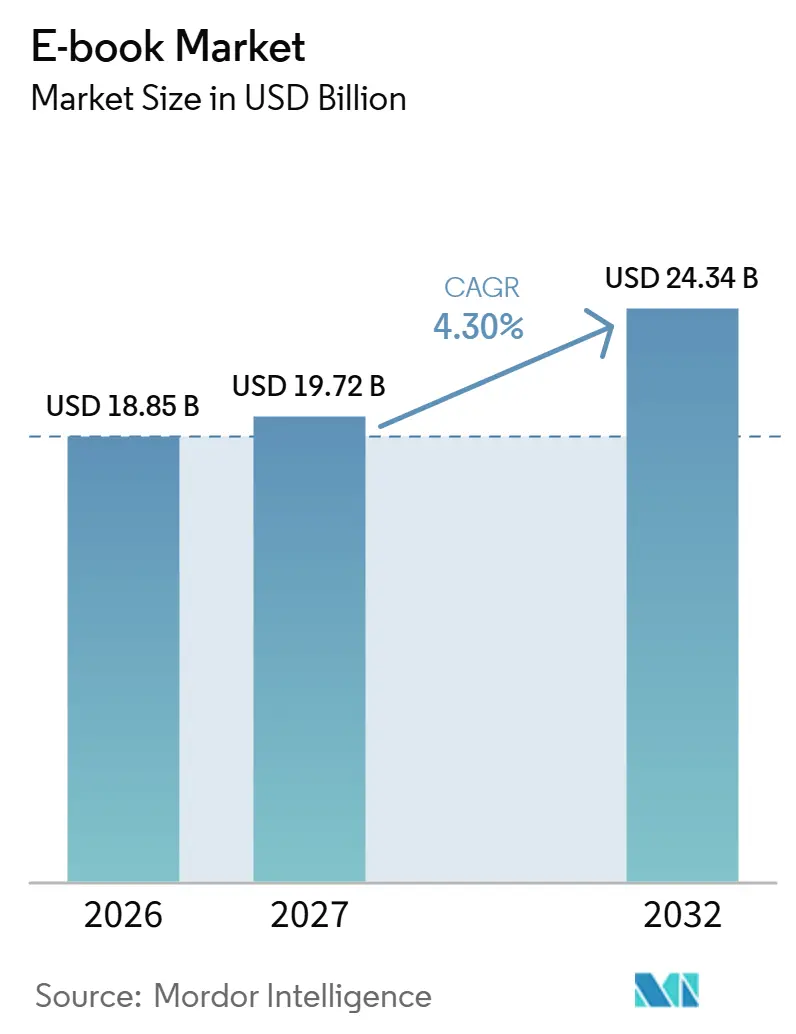
The e-book market size is estimated at USD 18.85 billion in 2026 and is projected to be USD 19.72 billion in 2027, reaching USD 24.34 billion by 2032, growing at a CAGR of 4.3% from 2027 to 2032.
Broader connectivity and mobile access expand distribution, putting the design of digital reading services alongside catalog availability as a commercial differentiator. Subscription audiences in France and mixed-format textbook provision in the United States create routes for repeated reading access. Retailers and intermediaries offer different payment models and distribution routes, making catalog placement a strategic commercial choice. Print preferences and library licensing limits can constrain conversion, so a useful digital edition must pair the right content with workable access terms.
Key Report Takeaways
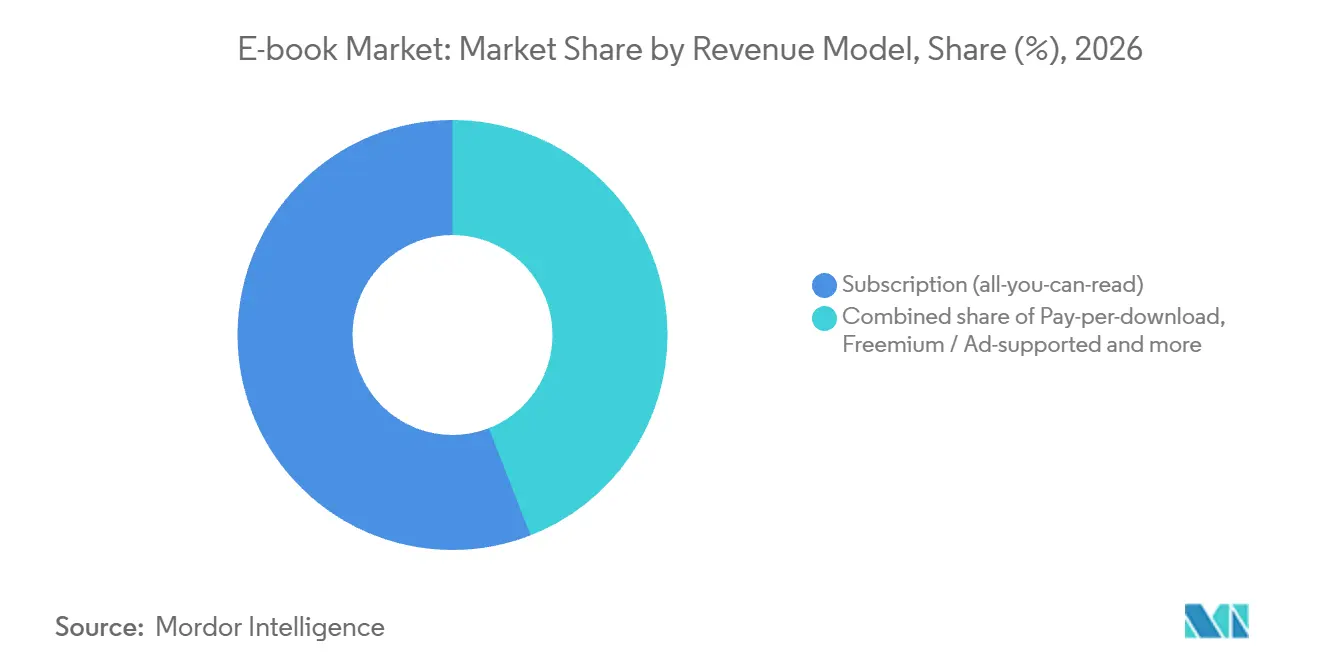
- By revenue model, subscription (all-you-can-read) held a 55.91% e-book market share in 2026, while institutional licensing is forecast to grow fastest at a 4.85% CAGR from 2027 to 2032.
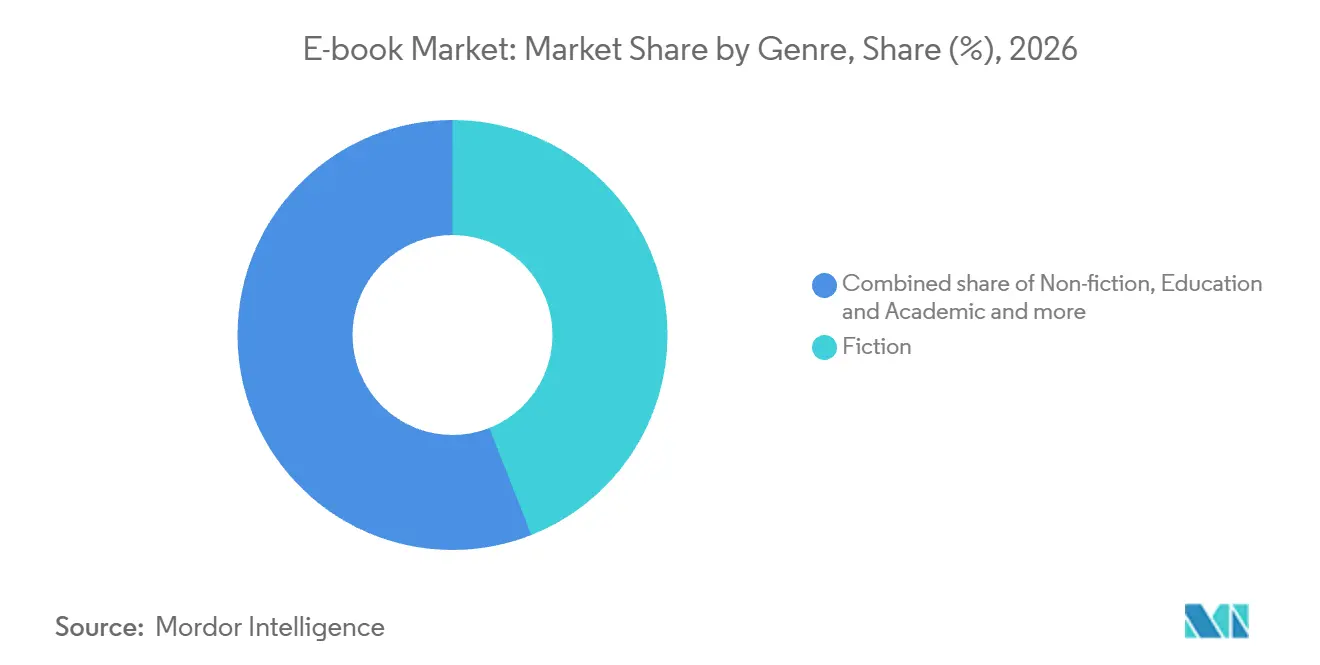
- Across genres, fiction accounted for a 44.02% share of the e-book market size in 2026, and comics and graphic novels are projected to be the fastest-growing segment at a 4.65% CAGR from 2027 to 2032.
- Among end users, individual consumers led with 61.8% of e-book revenue in 2026, whereas institutional buyers are forecast to expand fastest at a 5% CAGR from 2027 to 2032.
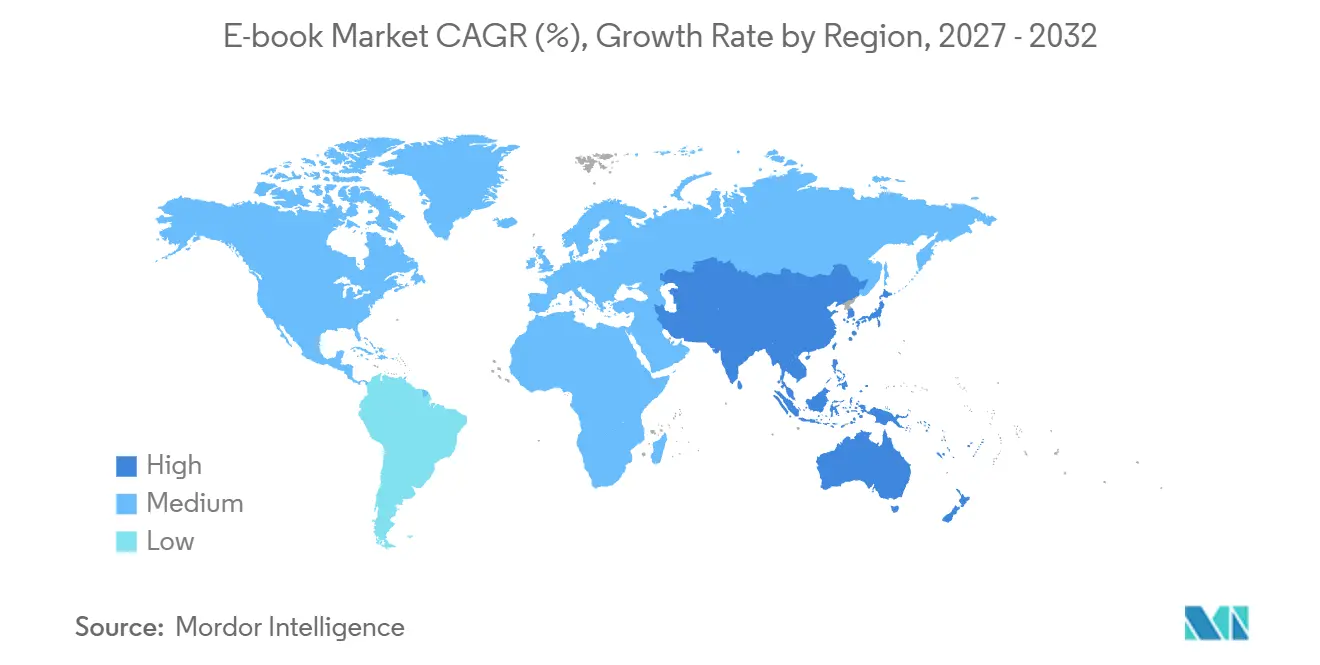
- Geographically, North America led with 39.5% of e-book revenue in 2026, and Asia Pacific is forecast to grow fastest at a 4.55% CAGR from 2027 to 2032.
Note: Market numbers in this report are based on Mordor Intelligence's proprietary estimation framework, which combines nine months of actuals with Q4 projections for base year 2026.
Market Trends and Insights
Drivers Impact Analysis of E-book Market*
| Driver | (~) % Impact on CAGR Forecast | Geographic Relevance | Impact Timeline |
|---|---|---|---|
| Increasing penetration of mobile devices | +1.3% | Europe, Asia-Pacific and the Americas | Medium term (2-4 years) |
| Expanding global internet connectivity | +1.1% | Europe, the Americas, Asia-Pacific and Africa | Medium term (2-4 years) |
| Growth of digital education and e-learning | +1.7% | The United States | Medium term (2-4 years) |
| Rising adoption of subscription-based reading platforms | +1.5% | France and Canada | Short term (≤ 2 years) |
| Blockchain-enabled rights management and micropayments | +0.2% | North America, Europe and Asia Pacific | Long term (≥ 4 years) |
| Publisher D2C storefront integration with CRM data | +0.5% | The United Kingdom | Medium term (2-4 years) |
| Source: Mordor Intelligence | |||
Increasing penetration of mobile devices
Mobile access expands the potential readership for digital books without making a dedicated reading device the starting requirement. By the end of 2025, around 4.8 billion people used mobile internet on their own device worldwide. That installed base gives publishers a route to readers who can consider digital titles through equipment they already use. Mobile internet adoption added around 160 million users in 2025, compared with around 190 million in 2024. Continued expansion supports a wider addressable audience. Slower mobile internet additions strengthen the case for converting existing connected users into paying readers alongside reaching newcomers.
Expanding global internet connectivity
Connectivity expands digital distribution reach while improving affordability can ease the cost of maintaining access. ITU estimated that 6 billion people, or 74% of the world's population, used the internet in 2025, up from 5.8 billion people, or 71%, in 2024.[1] The global median data-only mobile broadband basket price fell from 1.5% of gross national income per capita in 2024 to 1.4% in 2025. For publishers, the combination strengthens the potential audience for delivering books beyond a physical retail footprint. The enlarged connected audience makes paid-content affordability a separate question from technical reach. Even after the improvement in broadband affordability, readers face connectivity costs alongside book prices, so content pricing competes within the same total outlay.
Growth of digital education and e-learning
Educational demand can expand through digital complements to print rather than depend on complete textbook replacement. Among surveyed US K-12 teachers, provision of required textbooks in both formats rose from 49% in 2021-22 to 60% in 2024-25. Print-only provision fell from 32% to 20% over the same academic years. The shift creates a clearer opening for publishers to integrate digital reading into an existing textbook relationship. The decline in print-only provision also narrows the set of classrooms where a publisher can rely on the physical edition alone. Educational e-book suppliers therefore gain more by pairing with the print textbook already in the classroom than by seeking to displace it.
Rising adoption of subscription-based reading platforms
Paid book subscriptions can bring a publisher's catalog into an ongoing relationship with readers who already accept service-based access. In France, 44% of digital book readers in 2025 subscribed to at least one platform for reading or listening to books. Storytel Group's combined audiobook and e-book streaming service added 220,000 paying subscribers in 2025, reaching 2.67 million at year-end, compared with 2.45 million in 2024. These reading-and-listening audiences make the commercial setting broader than the sale of an individual electronic title. Subscriber growth makes sustained selection of e-books within a mixed reading-and-listening service a more relevant publisher objective than catalog inclusion alone.
Restraints Impact Analysis of E-book Market*
| Restraint | (~) % Impact on CAGR Forecast | Geographic Relevance | Impact Timeline |
|---|---|---|---|
| Privacy and copyright issues among e-sellers and authors | -0.8% | Countries across Europe | Medium term (2-4 years) |
| Persistent preference for print books in emerging markets | -0.6% | Indonesia and Brazil | Medium term (2-4 years) |
| Interoperability limitations across e-reader ecosystems | -0.4% | The United Kingdom | Short term (≤ 2 years) |
| Digital fatigue driving screen-time reduction initiatives | -0.2% | Republic of Ireland | Short term (≤ 2 years) |
| Source: Mordor Intelligence | |||
Privacy and copyright issues among e-sellers and authors
Copyright-related permissions can limit both an author's digital sales channels and a library's lending service. Amazon requires voluntarily enrolled KDP Select e-books to be distributed only through KDP or public libraries during each 90-day term, while permitting other formats elsewhere. Enrollment automatically renews unless the author opts out, making the restriction a continuing channel decision for participating authors. Rightsholders' licensing provisions and technical protection measures restricted some European libraries' freedom to lend e-books. In a European library e-lending study, respondents indicated that titles might be withdrawn from packages and offered again on different terms. These limits can leave enrolled authors with fewer digital outlets and affected libraries with extra acquisition work before readers can access a collection.
Persistent preference for print books in emerging markets
Print preference can be anchored in the reading experience itself, limiting the effect of digital availability on format choice. In GoodStats' 2025 survey, 79% of Indonesian respondents preferred print books, compared with 18.5% who preferred electronic books. In GoodStats' online survey of 1,000 respondents across Indonesia, reading experience, including a book's touch and smell, was one of the reasons for format preference. These sensory attributes give the physical edition a form of value that a downloadable file cannot reproduce. A digital edition needs a distinct reading proposition to compete for these readers. The remaining constraint is the effort needed to win a purchase when digital availability leaves the valued physical experience unaddressed.
*Our forecasts treat driver/restraint impacts as directional, not additive. The impact forecasts reflect baseline growth, mix effects, and variable interactions.
E-book Market Segment Analysis
By Revenue Model:
Subscription Scale and Institutional UsageSubscription (all-you-can-read) accounted for a 55.91% share of the e-book market size in 2026. Amazon reported USD 69.3 million in total KDP Select author earnings for September 2026. Books enrolled in KDP Select are automatically included in Kindle Unlimited, which allows subscribers to read as many books as they want. Subscribers can move between enrolled titles without making a new purchase for each book, giving frequent readers a reason to value a broad subscription catalog. For an enrolled title, earning from the KDP Select Global Fund requires Kindle Unlimited reading, making readership valuable beyond catalog inclusion.
Institutional licensing is the fastest-growing segment, with a projected CAGR of 4.85% from 2027 to 2032. Libraries and schools in OverDrive's global network recorded 379.4 million e-book checkouts in 2025, up 3% from 2024.[2] That activity gives institutional suppliers an observable use case for expanding the reading access that library and school collections provide. A licensing proposal can therefore be judged against the reading service it enables, alongside the content being offered. Because libraries license titles to be borrowed, circulation rather than title count is the measure an institutional supplier is likely to answer to.

By Genre:
Fiction Preference and Digital Comics SupplyFiction represented a 44.02% e-book market share in 2026. Among 718 surveyed Canadian e-book readers, 70% read adult fiction in 2025, with respondents able to read multiple categories. Amazon reported that romance led Kindle reading genres in Brazil from January 1 to December 1, 2025, followed by Literature & Fiction and Young Adult. Genre depth matters because the broad fiction category includes preferences more specific than a general willingness to read an electronic edition. A dedicated romance line would give publishers a more specific editorial offer for Brazil's Kindle readers than a broadly labeled fiction collection.
Comics and graphic novels are the fastest-growing segment, with a projected CAGR of 4.65% from 2027 to 2032. At December 31, 2025, WEBTOON Entertainment had approximately 400,000 web-comic creators and over 500,000 web-comic stories on its platform. The company said web-comics generated most of its platform revenue. That revenue weight gives publishers a commercial reason to expand serialized digital comics, connecting visual storytelling with an established platform earning model. Against this extensive catalog, a specialist publisher needs a recognizable editorial selection to draw reader attention.
By End-user:
Consumer Participation and Local Library CapacityIndividual consumers held 61.8% of e-book revenue in 2026, making them the largest segment. Among 327 surveyed Canadian e-book buyers, 96% reported buying the book for themselves in 2025, compared with 84% of all surveyed Canadian book buyers. The gap makes purchasing for personal use a more defining feature of the digital channel than of book buying overall, tying the transaction closely to the intended reader. This supports consumer editions and discovery offers organized around personal reading choices, with gift-oriented promotion playing a smaller role in the commercial proposition for this surveyed buyer base.
Institutional buyers are the fastest-growing segment, with a projected CAGR of 5% from 2027 to 2032. Spain's eBiblio service made 647,345 e-book licenses available at the end of 2025, 17.94% more than in 2024. License availability varied by participating autonomous community and city, which could supplement collections according to financial availability and user demand. This combination of a shared service and locally shaped provision creates room for suppliers to address different collection priorities within the same national system. A national listing cannot be treated as a uniform local order, because participating authorities can supplement provision according to their own resources and demand.
Geography Analysis
North America E-book Market
North America held a 39.5% share of the e-book market size in 2026. In the United States, publisher-reported e-book revenue reached USD 2.2 billion in 2025, up 3.2% from 2024. Canadian publisher University of Toronto Press (UTP) and Paradigm Publishing Services announced a dual-platform access collaboration for libraries subscribing to UTP e-book collections in September 2026. Paradigm is a division of De Gruyter Brill, and the proposed arrangement would give access to licensed UTP collections through UTP Publishing and De Gruyter Brill. Such an arrangement would make platform choice part of the licensing terms, giving content owners a service distinction beyond the titles included.
Asia Pacific E-book Market
Asia Pacific is the fastest-growing geography, with a projected CAGR of 4.55% from 2027 to 2032. China's online-literature user base reached 646 million in 2025, up 1.2% year over year, with the measure based on 31 major companies and about 30,000 surveyed users. Southeast Asia tied with North America as the leading destination for Chinese online-literature exports in 2025, covering text, audio, and adaptation formats. Indonesia's Perpusnas digital-library service iPusnas recorded 770,106 new users in 2025, illustrating how institutional access can expand the audience for publishers' reading collections alongside commercial online literature.
In South America, Brazilian publishers' e-book subscription revenue grew 63% in 2025 compared with 2024, showing a commercial role for recurring access. Colombia's technical-scientific and education digital books predominantly use PDF or EPUB e-books and multiuser licenses, giving institutional access a distinct local role. In Europe, digital sales accounted for a lower proportion of French publishers' literature sales in 2025 than in 2024. In the Netherlands, Bol.com Kobo Plus and Kobo Books were the most-used e-book platforms in 2026, making their readership relevant to publishers' distribution choices. For the Middle East and Africa, Amazon and the Abu Dhabi Arabic Language Centre launched a globally available storefront with more than 33,000 Arabic Kindle e-books in 2026, offering a language-led route across national boundaries.
Regulatory Framework and Outlook
The comparison assesses selected jurisdictions from the perspective of providers of newly supplied e-books for consumers and public libraries. Title accessibility, public-library web access, and digital-content management place obligations on different parts of the offer. Public reading plans add a policy route to digital access, making the relevant compliance and channel questions depend on the service being supplied.
Regulatory Table of E-book Market
| Decision factor | United States | Germany | China | Brazil |
|---|---|---|---|---|
| Primary authority | Department of Justice | Joint state Market Surveillance Authority for the Accessibility of Products and Services (MLBF) | National Press and Publication Administration | Culture and Education ministries, joint PNLL coordinators |
| Key instruments or direction | ADA Title II web rule, WCAG 2.1 Level AA | Accessibility Strengthening Act (BFSG) and implementing ordinance (BFSGV), covering new e-books after June 28, 2025 | National Reading Promotion Regulation, effective February 1, 2026 | Approved National Book and Reading Plan (PNLL) 2026-2036, including a free public digital-library goal |
| Commercial effect | Accessibility for public-library catalogs and vendor content supplied on a public entity's behalf | Accessibility is generally a condition of covered supply, subject to statutory exceptions and transitions | Mandatory content management, with accessible formats encouraged | Potential free public digital-reading channel under approved goals |
| Current policy attractiveness | Medium | Medium | Medium | Medium |
| Future direction of policy attractiveness | Hardening | No change | No change | No change |
| Source: Mordor Intelligence | ||||
DOJ's April 2026 interim final rule extended US WCAG 2.1 Level AA deadlines without removing the requirement, which becomes mandatory on April 26, 2027 for public entities serving at least 50,000 people, except special districts, and April 26, 2028 for smaller entities and special districts. Germany's covered new supply faces an established accessibility condition, and the amendment effective July 16, 2026 left the e-book provision unchanged. China's content-management duty creates an operational requirement, while its September 2026 implementation priorities support continuity of the existing framework. Brazil's approved 2026-2036 free public digital-library goal places implementation with the relevant minister after governance-body agreements, keeping the focus on public digital access.
Value Chain Stages
The chain compares content publication, file preparation, and distribution through retail and institutional channels, with different earnings mechanisms at each stage. Amazon KDP offers authors 35% and 70% e-book royalty options. The 70% option calculates royalties from the list price excluding VAT, then deducts delivery costs, and applies only to eligible books in listed territories. Public-domain works are ineligible for that higher option, making content status and sales territory part of the payment calculation.
Value Chain Analysis Table of E-book Market
| Primary activity | Key participants | Value capture | Bottleneck | Resilience response |
|---|---|---|---|---|
| Content publication and rights supply | Trade publishers such as Amazon Publishing | Publisher receipts from digital book sales | Clearing the rights needed for a digital edition | Resolve publication rights before release |
| File preparation and aggregation | Author-service aggregators such as Draft2Digital | Commission on sales-channel receipts outside Smashwords.com | Conversion accuracy across book files | Check converted files before channel delivery |
| Retail and institutional distribution | Digital retailers such as Google Play Books; institutional distributors such as OverDrive | Retail revenue sharing; institutional content sales | Retail sales territories unsupported by the channel | Match retail channels to the intended sales territory |
| Source: Mordor Intelligence | ||||
Under terms effective April 14, 2026, Draft2Digital deducts a 15% commission from sales-channel payments for e-books or audiobooks sold, leased, rented, or otherwise distributed outside Smashwords.com. Participants must own or hold the required publication and distribution rights and grant a nonexclusive worldwide license for their chosen channels. Draft2Digital claims no copyright or ownership in the works, making channel execution a paid service separable from content ownership. For authors, a royalty percentage and an intermediary commission require comparison on their respective payment bases because they describe different parts of the earnings chain.
Competitive Landscape
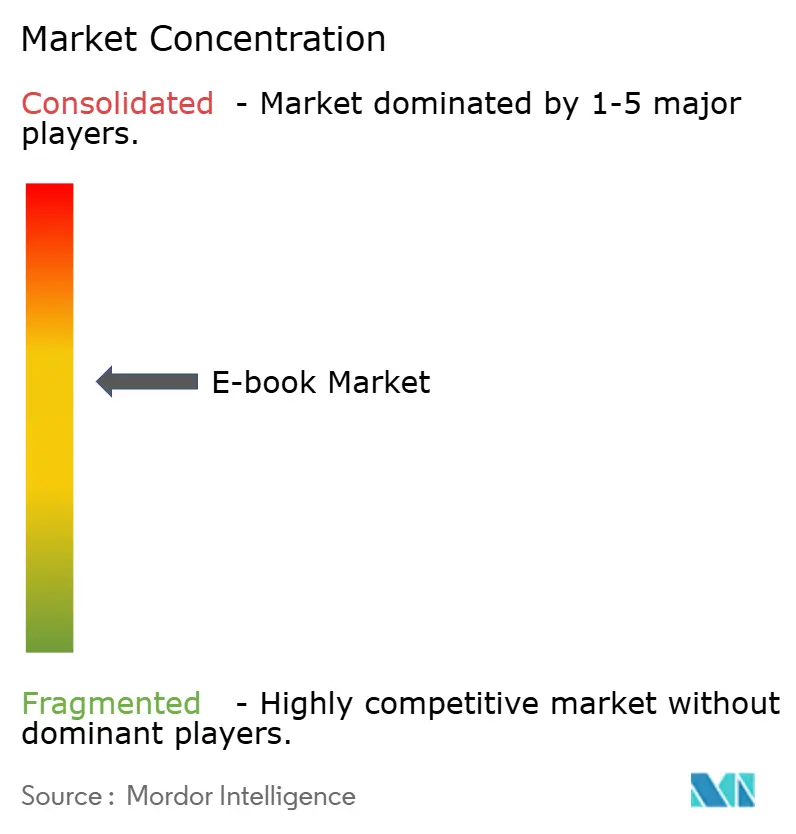
Amazon.com, Inc. and Rakuten Kobo Inc. operate consumer reading ecosystems, helping create a platform-led retail structure that connects reading services with access to a store. Apple Inc. operates Apple Books, while Barnes & Noble Booksellers, Inc. connects NOOK reading across its app, devices, and BN.com. Draft2Digital, LLC supplies a specialist self-publication and distribution route through third-party sales channels. In its recap of 2025, Draft2Digital reported that migration of Smashwords author and publisher accounts was complete apart from minor cleanup. The commercial divide is between operating the reader's storefront and helping authors reach outlets that an intermediary does not operate.
In August 2026, Rakuten Kobo made its e-readers available in more than 500 Best Buy locations across the United States, with the devices connecting to Kobo Store and Kobo Plus. Apple Books lets Mac users in India buy e-books individually at listed prices, in contrast with Kobo Plus's all-you-can-read subscription. These alternatives give publishers distinct decisions about how to present a catalog, either through ongoing service access or a reader's selection of individual paid titles. Kobo's retail expansion makes a physical device encounter an entry point to digital reading services, while Apple's per-title offer competes at the point of book selection.
Rights permissions set a further boundary for channel expansion because an additional outlet must fit the terms governing the title. In 2025, Amazon began allowing KDP Select e-books to be distributed to libraries, according to Draft2Digital. That permission created a specific institutional-channel option for enrolled authors, making the scope of allowed distribution relevant alongside storefront access. For intermediaries, distinguishing an authorized route from automatic library placement is part of a credible commercial offer to authors weighing consumer sales against institutional reach. Challengers such as Draft2Digital can differentiate by helping enrolled authors use the permitted library route, without promising automatic placement or broader distribution rights.
E-book Industry Leaders
-
Amazon.com, Inc.
-
Rakuten Kobo Inc.
-
Apple Inc.
-
Barnes & Noble Booksellers, Inc.
-
Draft2Digital, LLC
- *Disclaimer: Major Players sorted in no particular order
E-book Market Companies Covered in this Report
- Amazon.com, Inc.
- Rakuten Kobo Inc.
- Apple Inc.
- Barnes & Noble Booksellers, Inc.
- Draft2Digital, LLC
- Blurb, Inc.
- DIY Media Group, Inc.
- Lulu Press, Inc.
- Macmillan Publishers Ltd
- Scribd, Inc.
- Google LLC
- Hachette Livre SA
- HarperCollins Publishers LLC
- Penguin Random House LLC
- OverDrive, Inc.
- Storytel AB
- Wattpad Corp.
- Inkitt GmbH
- John Wiley & Sons, Inc.
- Pearson plc
- Cengage Learning, Inc.
Key Opportunities for Market Participants
The comparison focuses on accessible consumer editions, scholarly reading collections, and public-library licensing. The European Accessibility Act began applying in the EU on June 28, 2025, requiring covered e-books to be accessible to people with disabilities. This creates separate publishing decisions for consumer releases and academic collections, even when both respond to the same legal requirement. The commercial task is to make accessibility part of a usable reading offer, while library licensing addresses a distinct financial constraint.
Market Opportunities Table of E-book Market
| Opportunity | Why now | Buyer / lead segment | Recommended play | Main barrier | Likely beneficiaries |
|---|---|---|---|---|---|
| Accessible consumer e-book editions | Accessibility is an operative condition for covered EU supply | Consumer booksellers and individual readers | Build accessibility into covered new releases | Verifying usability across the supplied edition | Publishers supplying covered accessible books |
| Accessible scholarly reading collections | Covered academic e-books face the same accessibility requirement | Academic libraries and scholarly readers | Offer covered collections with verified descriptions and accessibility metadata | Title-level accessibility work across collections | Publishers such as Elsevier |
| Budget-matched public-library licenses | Buyer pressure for sustainable digital access | North American public libraries | Negotiate access terms around library resources and reading demand | Library budget strain and agreement on viable licensing terms | Institutional platforms such as OverDrive and their publisher partners |
| Source: Mordor Intelligence | |||||
On May 26, 2026, North American public-library groups called on publishers and platform providers to change e-book licensing as rising use strained library budgets.[3] This gives the licensing opportunity a defined buyer problem that a supplier proposal can address through its access terms. A viable offer must make the cost of maintaining reading access workable within the library's resources.
Recent Industry Developments in E-book Market
- Sep 2026: University of Toronto Press and Paradigm Publishing Services announced a collaboration that would give libraries subscribing to UTP e-book collections access to their licensed content through UTP Publishing and De Gruyter Brill.
- Aug 2026: Bookwire onboarded Centraal Boekhuis's digital catalog, comprising 80,000 e-books and 25,000 audiobooks, onto Bookwire OS and took over fulfillment for the Dutch distributor's network.
- Jun 2026: Ingram Publisher Services upgraded IndiePubs, its direct-to-consumer storefront for distribution clients selling print and e-books, adding publisher-site checkout and access to shopper data upon opt-in.
E-book Market Report Scope and Research Methodology
Market Definition and Coverage
The e-book market measures annual revenue from digital books sold or licensed for reading worldwide. It covers consumer and institutional purchases, access subscriptions, and advertising revenue attributable to free or ad-supported digital book reading across all genres.
Scope exclusions: Printed books, printing services and physical distribution, audiobooks, and e-readers and other reading devices are excluded.
Segments Covered in This Report
- By Revenue Model
- Subscription (all-you-can-read)
- Pay-per-download
- Freemium / Ad-supported
- Institutional licensing
- By Genre
- Fiction
- Non-fiction
- Education and Academic
- Comics and Graphic Novels
- Professional and Technical
- By End-user
- Individual Consumers
- Adults
- Children and Young Adults
- Institutional
- K-12 Schools
- Higher Education
- Corporate / Professional Training
- Public Libraries
- Individual Consumers
- By Geography
- North America
- United States
- Canada
- South America
- Brazil
- Argentina
- Chile
- Rest of South America
- Europe
- United Kingdom
- Germany
- France
- Spain
- Italy
- Russia
- Rest of Europe
- Asia Pacific
- China
- Japan
- India
- South Korea
- Indonesia
- Rest of Asia Pacific
- Middle East and Africa
- Middle East
- Saudi Arabia
- United Arab Emirates
- Turkey
- Rest of Middle East
- Africa
- South Africa
- Nigeria
- Egypt
- Rest of Africa
- Middle East
- North America
Data Sources, Market Sizing, and Validation
Desk Research
Official, association and operator sources such as ITU Facts and Figures, Eurostat's household ICT survey, the Association of American Publishers' StatShot, and OverDrive's global lending summaries provide distinct checks on connectivity, online e-book purchasing, publisher-reported US e-book revenue, and institutional digital borrowing. These indicators help align regional and annual demand signals while keeping reader activity, publisher revenue, and market revenue distinct.
Company annual reports and SEC 10-K filings can clarify geographic reach, digital product disclosures, licensing arrangements, and channel economics, while investor materials and reputable press can date launches and changes in distribution or access terms. Analysts compare those disclosures with official statistics and public market indicators to identify gaps in coverage and timing. These sources are not exhaustive, and further sources inform collection, validation and clarification.
Primary Interviews and Surveys
Structured interviews would seek perspectives from publishers, e-book retailers and subscription platforms, digital distributors, library and education license buyers, and analysts responsible for digital publishing or collection budgets. These discussions would test secondary estimates on transaction types, bundled subscription allocation, regional channel reach, licensing terms, and the relationship between borrowing activity and paid market revenue. Where public series or company disclosures leave gaps, analysts would record the affected variable, compare it with adjacent indicators and sampled prices, and use evidence from more than one respondent type before adjusting assumptions.
Distribution of primary research fieldwork respondents
| Company type | Respondent position | Region |
|---|---|---|
| Top tier: 32% | CXOs: 18% | APAC: 38% |
| Mid tier: 48% | Functional/Unit leaders: 37% | EMEA: 32% |
| Smaller Players: 20% | Managers: 45% | Americas: 30% |
Market-Sizing & Forecasting
The model starts with the global annual revenue estimate and distributes value across revenue models, genres, end users, and geographies using observed publishing revenue, transaction and subscription activity, and channel evidence. Connectivity and mobile internet adoption indicate the reachable reader base, Eurostat e-book purchase activity and publisher-reported digital sales indicate paid demand, and library e-book checkouts indicate institutional use without being treated as revenue. Where historical series permit, multivariate regression can relate revenue movement to these indicators, while scenario analysis tests how changes in paid conversion, subscription access, and institutional licensing affect the forecast through 2032.
Segment shares would be built from available revenue disclosures and channel evidence, with reader and checkout measures used as directional checks where revenue splits are unavailable. Selective bottom-up checks would multiply sampled end-user prices by estimated paid transaction volumes for selected channels or territories, then compare those totals with the top-down allocation. Missing transaction counts would be bounded with public activity data and interview evidence, and gaps would remain explicit until supported. Analysts with publishing, platform, library, and education experience would review the variable-level outlooks, including whether borrowing or usage indicators have a defensible link to paid license value.
Data Validation & Update Cycle
Analysts triangulate official statistics, publisher disclosures, channel evidence, and primary research, checking each measure for year, geography, transaction basis, and overlap before combining it. Independent signals such as connectivity, online purchase activity, publisher e-book revenue, and library lending are compared with the model, and unusual movements or variances from prior estimates are traced back to source definitions and input changes before sign-off. A second analyst reviews calculations, segment reconciliations, and documented adjustments, with re-contact triggered when respondents provide conflicting definitions or when a material source change alters an input. The model is refreshed annually, updated between cycles after material market events, and given a fresh source and calculation review before delivery.
Mordor Intelligence's E Book Market Size Measured Against Other Published Estimates
Published estimates can differ in the transactions and products they count and the inputs used to model demand. The e-book market measures annual revenue from digital books sold or licensed for reading worldwide.
Key Gap Drivers include the study's defined coverage and market-specific modeling choices. Analysts with publishing, platform, library, and education experience would review the variable-level outlooks, including whether borrowing or usage indicators have a defensible link to paid license value.
Benchmark comparison
| Source | Market Size | Gaps in Research Methodology |
|---|---|---|
| Mordor Intelligence | USD 19.72 B (2027) | |
| Global Consultancy A | USD 15.39 B (2025) | At its 2025 base, this estimate is 22.0% below this report's 2027 value of USD 19.72 B, 2 years later. Its stated 2.46% forecast CAGR is slower and can contribute to a lower comparison. |
| Global Market Research Firm B | USD 17.5 B (2025) | At its 2025 base, this estimate is 11.3% below this report's 2027 value of USD 19.72 B, 2 years later. Its stated 3.5% forecast CAGR is slower and can contribute to a lower comparison. |
For Mordor Intelligence, a second analyst reviews calculations, segment reconciliations, and documented adjustments, with re-contact triggered when respondents provide conflicting definitions or when a material source change alters an input.
Key Questions Answered in the Report
What is the e-book market size and growth outlook?
The size is estimated at USD 18.85 billion in 2026. It is projected to be USD 19.72 billion in 2027 and USD 24.34 billion by 2032, with a 4.3% CAGR from 2027 to 2032.
What supports demand for electronic books?
Mobile access, digital education, and subscriptions support demand. In France, 44% of digital book readers in 2025 subscribed to at least one platform for reading or listening to books.
Which e-book revenue model has the largest share?
All-you-can-read subscriptions led with 55.91% of e-book revenue in 2026.
Which companies compete in e-book retail and distribution?
Major participants are Amazon.com, Inc., Rakuten Kobo Inc., Apple Inc., Barnes & Noble Booksellers, Inc., and Draft2Digital, LLC.
What constrains wider e-book adoption?
Print preference and distribution or lending restrictions can constrain expansion. In GoodStats' 2025 survey, 79% of Indonesian respondents preferred print books.
Which region leads e-book revenue and which is forecast to grow fastest?
North America held 39.5% of e-book revenue in 2026, and Asia Pacific is forecast to grow fastest at a 4.55% CAGR from 2027 to 2032.