
Market Overview
| Study Period | 2020 - 2031 |
|---|---|
| Market Size (2026) | USD 93.79 Billion |
| Market Size (2031) | USD 111.5 Billion |
| Growth Rate (2026 - 2031) | 3.52 % |
| Fastest Growing Market | Asia Pacific |
| Largest Market | North America |
| Market Concentration | Medium |
Major Players *Disclaimer: Major Players sorted in no particular order Image © Mordor Intelligence. Reuse requires attribution under CC BY 4.0. | |
Diabetes Drugs Market Analysis by Mordor Intelligence
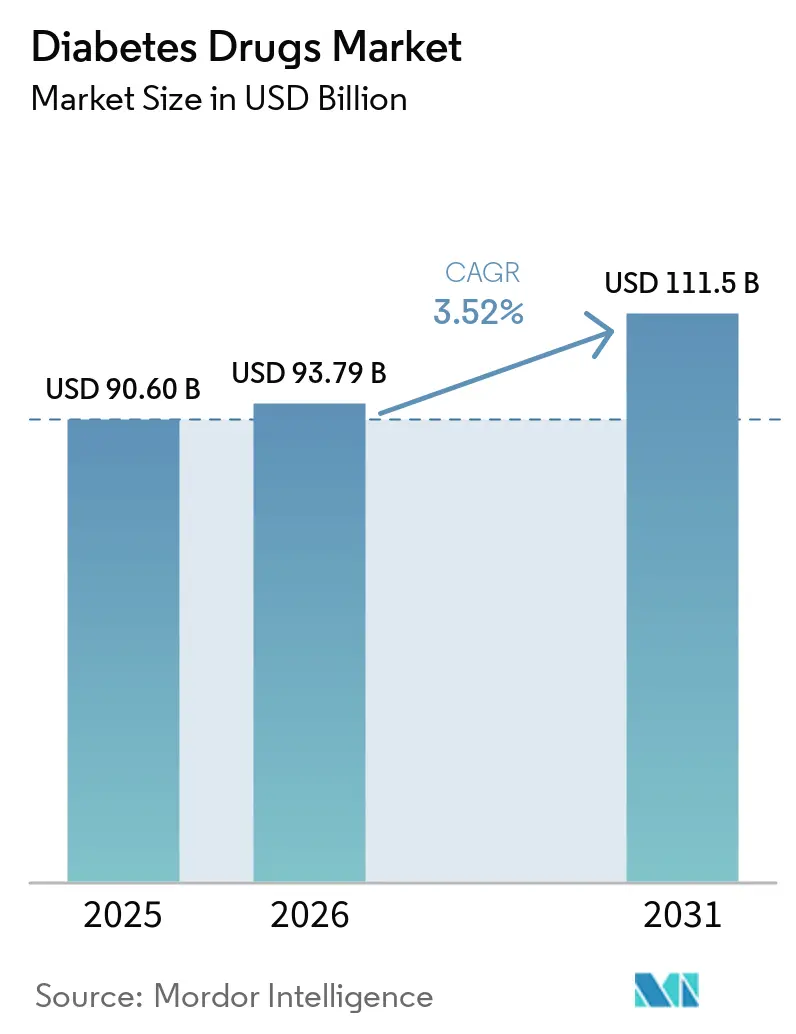
The Diabetes Drugs Market size is expected to grow from USD 90.60 billion in 2025 to USD 93.79 billion in 2026 and is forecast to reach USD 111.5 billion by 2031 at 3.52% CAGR over 2026-2031.
Rapid uptake of GLP-1 receptor agonists and the first dual incretin co-agonists is shifting value away from basal insulins, while biosimilar entrants compress pricing across Europe and large emerging economies. Global prevalence keeps climbing: 588.7 million adults lived with diabetes in 2024 and the total is expected to hit 852.5 million by 2050, with nearly 43% of cases still undiagnosed and newly discovered through nationwide screening drives in China, India and the Gulf states. Evidence from major cardiovascular and renal outcome trials has pushed semaglutide, tirzepatide and empagliflozin into guideline-endorsed first-line positions, accelerating share gains for non-insulin injectables. Digital pharmacies are eroding hospital channel dominance, particularly in North America, where transparent cash-pay models now price rapid-acting insulin at USD 27.50 per vial compared with more than USD 300 at traditional outlets. On the supply side, Novo Nordisk, Eli Lilly and Sanofi are investing more than USD 15 billion in new capacity to relieve a multiyear GLP-1 shortage, yet legislative headwinds such as Inflation Reduction Act price negotiations in the United States and volume-based procurement in China will tighten margins through 2031.
Key Report Takeaways
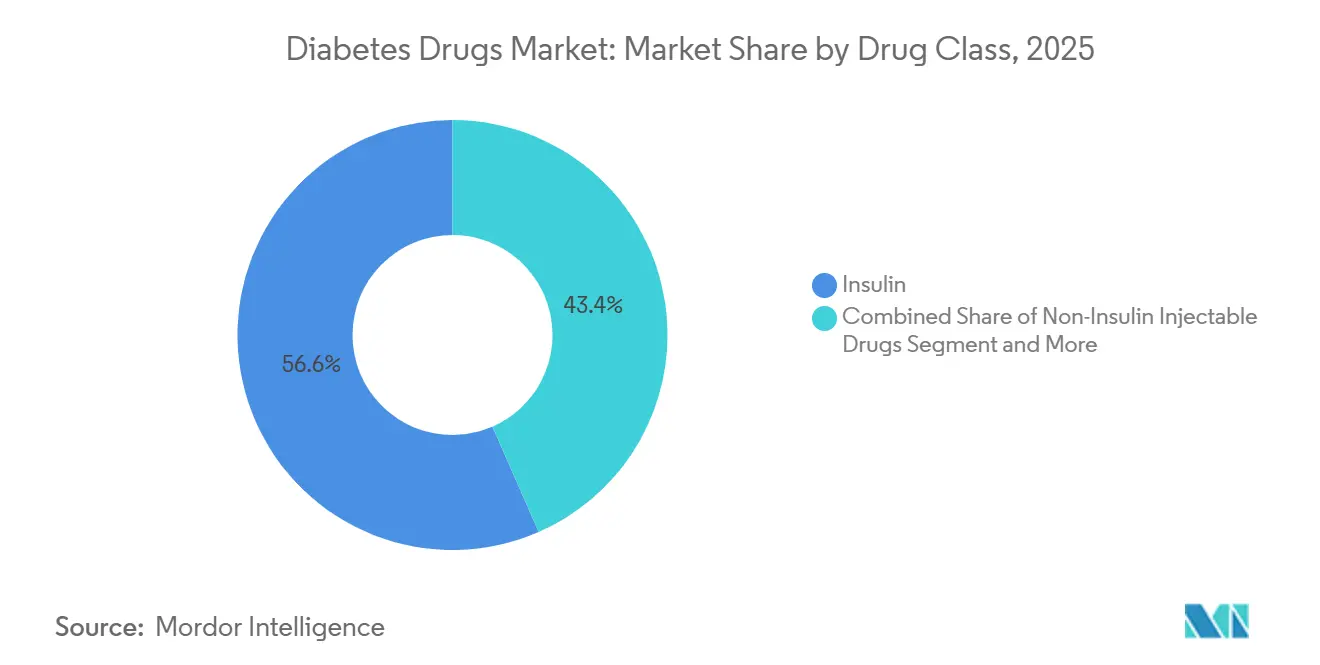
- By drug class, insulin held 56.56% of the diabetes drugs market share in 2025, while non-insulin injectables are forecast to grow at a 4.25% CAGR through 2031.
- By route of administration, subcutaneous formats captured 71.53% of the diabetes drugs market size in 2025; oral antidiabetics are advancing at a 4.85% CAGR to 2031.
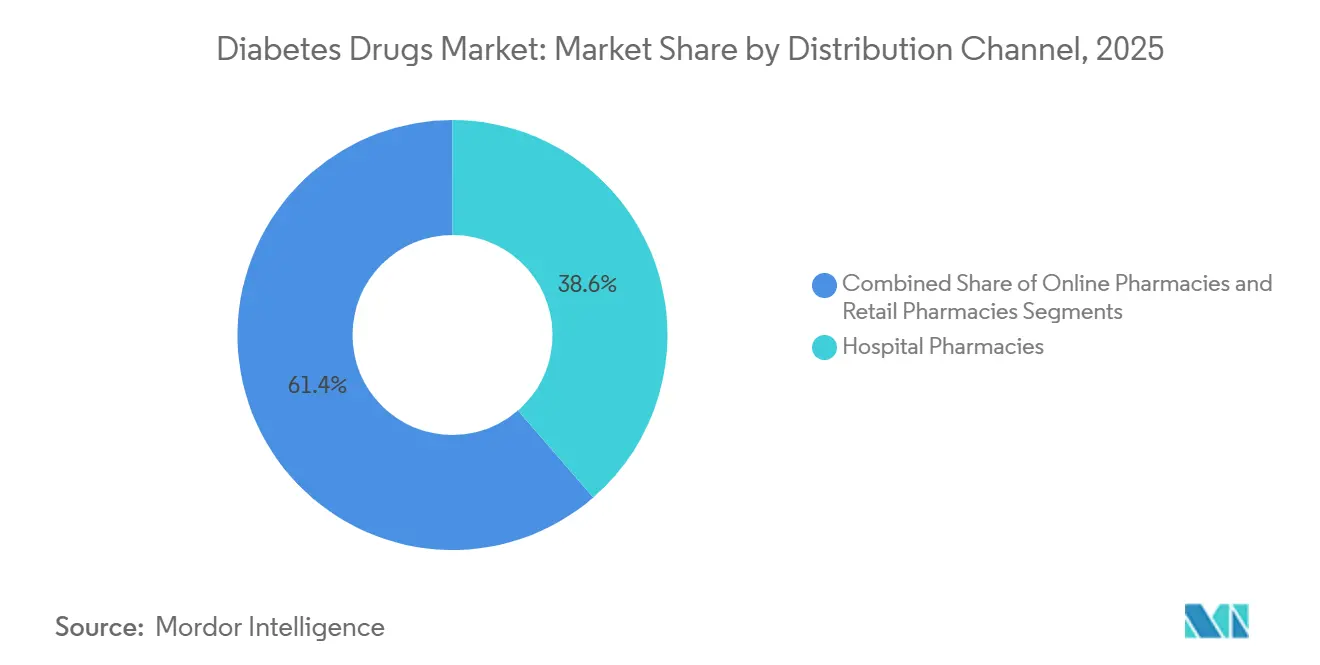
- By distribution channel, hospital pharmacies accounted for 38.63% of revenue in 2025, yet online pharmacies represent the fastest expansion, rising at 5.87% CAGR through 2031.
- By geography, North America commanded 42.13% of the diabetes drugs market share in 2025, whereas Asia-Pacific is projected to expand at a 5.51% CAGR to 2031.
Note: Market size and forecast figures in this report are generated using Mordor Intelligence’s proprietary estimation framework, updated with the latest available data and insights as of January 2026.
Market Trends and Insights
Drivers Impact Analysis of Diabetes Drugs Market*
| Driver | (~) % Impact on CAGR Forecast | Geographic Relevance | Impact Timeline |
|---|---|---|---|
| Escalating global diabetes prevalence & earlier screening | +1.2% | Global, with acceleration in Asia-Pacific, Middle East & Africa, and Latin America | Medium term (2-4 years) |
| Rising healthcare expenditures in emerging markets | +0.8% | Asia-Pacific core, spillover to Middle East & Africa and Latin America | Long term (≥ 4 years) |
| Strong clinical evidence & guideline endorsements for GLP-1 & SGLT-2 classes | +1.5% | North America & Europe lead, expanding to Asia-Pacific urban centers | Short term (≤ 2 years) |
| Growing adoption of biosimilar basal insulins | +0.6% | Europe, India, China, with emerging penetration in Latin America and Southeast Asia | Medium term (2-4 years) |
| Once-weekly ultra-long-acting basal insulin analogues | +0.4% | North America & Europe initial adoption, followed by Asia-Pacific high-income markets | Medium term (2-4 years) |
| Payor-integrated digital therapeutic bundling | +0.3% | North America dominance, pilot programs in Europe and Asia-Pacific urban markets | Long term (≥ 4 years) |
| Source: Mordor Intelligence | |||
Escalating Global Diabetes Prevalence & Earlier Screening
The International Diabetes Federation logged 588.7 million adults with diabetes in 2024, up 45% from 2021, yet 251.7 million remain undiagnosed, creating large latent demand that mass screening in China, India and Gulf states is beginning to unlock. Africa shows the highest undiagnosed rate at 72.6%, while Asia-Pacific hosts 60% of total cases, concentrating growth where healthcare infrastructure is scaling quickly. Gulf Cooperation Council governments subsidize HbA1c testing and SGLT-2 reimbursement, a blueprint Indonesia and Pakistan now emulate to counter fast-growing type 2 incidence. Japan and South Korea weave HbA1c checks into employer health exams, pulling treatment initiation forward by roughly three years and extending lifetime drug exposure. As screening penetrates deeper, diagnosed prevalence rises faster than epidemiology alone, permanently enlarging the diabetes drugs market[1]Ministry of Health, Labour and Welfare Japan, “Health Statistics,” mhlw.go.jp.
Rising Healthcare Expenditures in Emerging Markets
China’s 2023 update to the National Reimbursement Drug List added semaglutide, dulaglutide, empagliflozin and dapagliflozin, unlocking coverage for 1.4 billion citizens and lifting GLP-1 prescriptions 68% year over year in top-tier cities[2]National Medical Products Administration China, “Drug Approval Information,” nmpa.gov.cn. India earmarked USD 1.2 billion for 2024-2026 to fund district-level diabetes clinics and biosimilar insulin procurement, cutting patient out-of-pocket spending by 40% in pilot states. Brazil’s public health system awarded glargine biosimilar contracts at 55% discounts to originators, a model Argentina and Colombia now replicate to stretch limited budgets. These moves convert cash-pay patients to reimbursed status, boosting volume for oral antidiabetics and biosimilar insulin. Asia-Pacific and Latin America together will represent roughly 80% of incremental diabetes drug spending through 2031, more than offsetting price pressure in North America and Europe.
Strong Clinical Evidence & Guideline Endorsements for GLP-1 & SGLT-2 Classes
The FDA broadened Ozempic’s label to chronic kidney disease in March 2024 after the FLOW trial cut kidney-failure risk 24%. Wegovy gained cardiovascular risk-reduction approval the same month on SELECT trial data, making it the first obesity therapy reimbursed under Medicare Part D’s cardiac criteria. Jardiance used EMPA-KIDNEY results to secure 35% of U.S. nephrology prescriptions for diabetic kidney disease by late-2024, and Farxiga earned European clearance for heart failure with preserved ejection fraction, enlarging its addressable base. Updated 2024 ADA-EASD guidelines now recommend GLP-1 or SGLT-2 inhibitors first line for patients with cardiovascular or renal comorbidity, demoting metformin’s long-held primacy, which is reshaping treatment demand across the type 2 diabetes drugs and devices market. Tirzepatide’s SUMMIT data further bolster dual agonists ahead of a planned 2026 filing, positioning the class for continued out-performance.
Growing Adoption of Biosimilar Basal Insulins
The FDA approved Kirsty, the first interchangeable biosimilar insulin aspart, in July 2025, enabling automatic substitution in nearly all U.S. states and cutting Novo Nordisk’s rapid-acting revenue 12% within six months. Merilog, cleared five months earlier, penetrated Medicare Part D formularies at a 35% discount, shifting 18% of new insulin starts to biosimilars by year-end 2025. Biocon and Viatris export glargine biosimilars to 70 countries under WHO prequalification, supplying UNICEF and Global Fund tenders where branded supply faltered during the pandemic. WHO’s 2024 interchangeability guidance accelerated approvals in Indonesia, Pakistan and Nigeria by up to two years, tipping European volume mix to 55% biosimilar and India’s to 70%. Originators now defend share mainly with weekly insulin innovation rather than price.
Restraints Impact Analysis of Diabetes Drugs Market*
| Restraint | (~) % Impact on CAGR Forecast | Geographic Relevance | Impact Timeline |
|---|---|---|---|
| Safety concerns regarding GLP-1-linked pancreatitis & thyroid risks | -0.4% | Global, with heightened regulatory scrutiny in North America & Europe | Short term (≤ 2 years) |
| Public-sector insulin price caps & tender-based procurement | -0.7% | China, India, Brazil, with policy diffusion to other emerging markets in Asia-Pacific and Latin America | Medium term (2-4 years) |
| Affordability gaps in low- and middle-income countries | -0.5% | Sub-Saharan Africa, South Asia, Southeast Asia, and rural Latin America | Long term (≥ 4 years) |
| Cold-chain integrity risk in last-mile delivery across tropical regions | -0.2% | Sub-Saharan Africa, Southeast Asia, tropical Latin America, and rural India | Medium term (2-4 years) |
| Source: Mordor Intelligence | |||
Safety Concerns Regarding GLP-1-Linked Pancreatitis & Thyroid Risks
All GLP-1 agents carry boxed thyroid warnings in the United States, mirrored by European labels, dampening prescriptions for patients with relevant family history. A 2024 Nature Medicine review linked GLP-1 therapy to higher relative risks of pancreatitis, gallbladder disease and 15-20% early discontinuation from gastrointestinal intolerance, prompting label revisions and slower uptitration schedules. Litigation over delayed gastroparesis disclosures added further caution, elongating dose-escalation to mitigate side effects. The EMA opened a safety probe in 2025 after isolated suicidal-ideation reports, temporarily stalling new-patient starts in Germany and France. These issues weigh most heavily on obesity prescriptions, where benefit-risk calculus is less clear than in diabetes.
Public-Sector Insulin Price Caps & Tender-Based Procurement
China’s 2024 insulin tender cut median prices 42%, saving USD 2.85 billion and switching 1.6 billion daily doses to biosimilar suppliers. Provinces report vial costs falling by one-half, forcing originators to accept volume guarantees at slim margins or relinquish access. The U.S. Inflation Reduction Act selected Jardiance, Januvia and Farxiga for 2026 Medicare negotiation and Ozempic for 2027, with projected 25-60% list-price cuts. India’s essential-medicines list imposed a USD 1.80 cap on insulin glargine in 2024 and extended controls to SGLT-2 inhibitors in 2025, leading multinational firms to withdraw premium formulations. Academic analysis shows U.S. state copay caps benefit few patients, highlighting coverage gaps among uninsured groups.
*Our forecasts treat driver/restraint impacts as directional, not additive. The impact forecasts reflect baseline growth, mix effects, and variable interactions.
Diabetes Drugs Market Segment Analysis
By Drug Class:
Incretin Agonists Displace Insulin VolumeInsulin retained 56.56% of 2025 revenue, yet non-insulin injectables are expanding at a 4.25% CAGR through 2031, the strongest pace among all classes, as GLP-1 and dual agonists cannibalize basal insulin starts. Tirzepatide generated USD 3.1 billion in Q3 2024 alone, showcasing the commercial leverage of 15-20% weight-loss efficacy relative to single-agonist semaglutide’s 5-10%. Oral SGLT-2 and DPP-4 inhibitors captured 28% of prescriptions, buoyed by multi-organ benefit data and generic DPP-4 availability. Combination agents such as Xultophy and Synjardy simplify regimens but remain reimbursement-constrained in cost-sensitive markets, limiting share to 8%.
Basal insulins saw double-digit volume erosion in mature regions as physicians delay initiation in favor of GLP-1s, while biosimilar glargine and degludec compress branded prices in Europe. Bolus insulins hold demand in type 1 diabetes, but even here faster-acting analogs like Fiasp gain share by improving post-meal control. Conventional human formulations still dominate low-income markets because they tolerate warmer storage and cost far less than analogs. Weekly insulins icodec and efsitora await U.S. clearance after European approval in 2024, with limited near-term impact on the diabetes drugs market size.



By Route of Administration:
Oral Formulations Gain on Subcutaneous DominanceSubcutaneous formats commanded 71.53% of 2025 sales owing to insulin pens and GLP-1 auto-injectors. Oral medicines, however, are set to widen share at a 4.85% CAGR, aided by Rybelsus, which captured 12% of new GLP-1 starts among needle-averse patients. SGLT-2 label expansions into heart failure and chronic kidney disease further raise cardiologist and nephrologist prescribing of oral agents. Metformin remains the universal entry therapy, but 1 in 4 users switch within six months because of gastrointestinal effects, creating churn in favor of newer classes.
Intravenous delivery serves narrow inpatient emergencies and represents less than 2% of the diabetes drugs market. Looking forward, pipeline oral peptides aim to boost bioavailability above today’s 1-2% threshold. If successful, they could take 15-20% of insulin-naïve patients by 2031. Japan illustrates oral preference: DPP-4 inhibitors held 55% of prescriptions in 2025, reflecting cultural aversion to injections and lower obesity rates.
By Distribution Channel:
Digital Platforms Erode Traditional Pharmacy ShareHospital pharmacies represented 38.63% of 2025 volumes through inpatient dosing and high-touch specialty networks. Yet online pharmacies are rising at 5.87% CAGR, integrating telemedicine consults, connected glucose monitors and same-day fulfillment. Mark Cuban Cost Plus Drug Company lists insulin lispro at USD 27.50 per vial, winning 8% of U.S. cash-pay insulin sales and forcing retail chains to institute price-match pledges that halve margins. Retail outlets now lean on 90-day mail-order partnerships to stem share loss, while Medicare Advantage plans incentivize mail fulfillment via lower copays.
Digital uptake remains uneven: regulation limits China’s e-pharmacies to hospital-affiliated platforms and rural logistics hinder India’s penetration outside major metros. Specialty pharmacies carve out an 18% share by bundling patient education and assistance programs for pricey GLP-1s and insulin pumps, maintaining 25-30% markups that broader e-commerce cannot replicate.
Geography Analysis
North America Diabetes Drugs Market
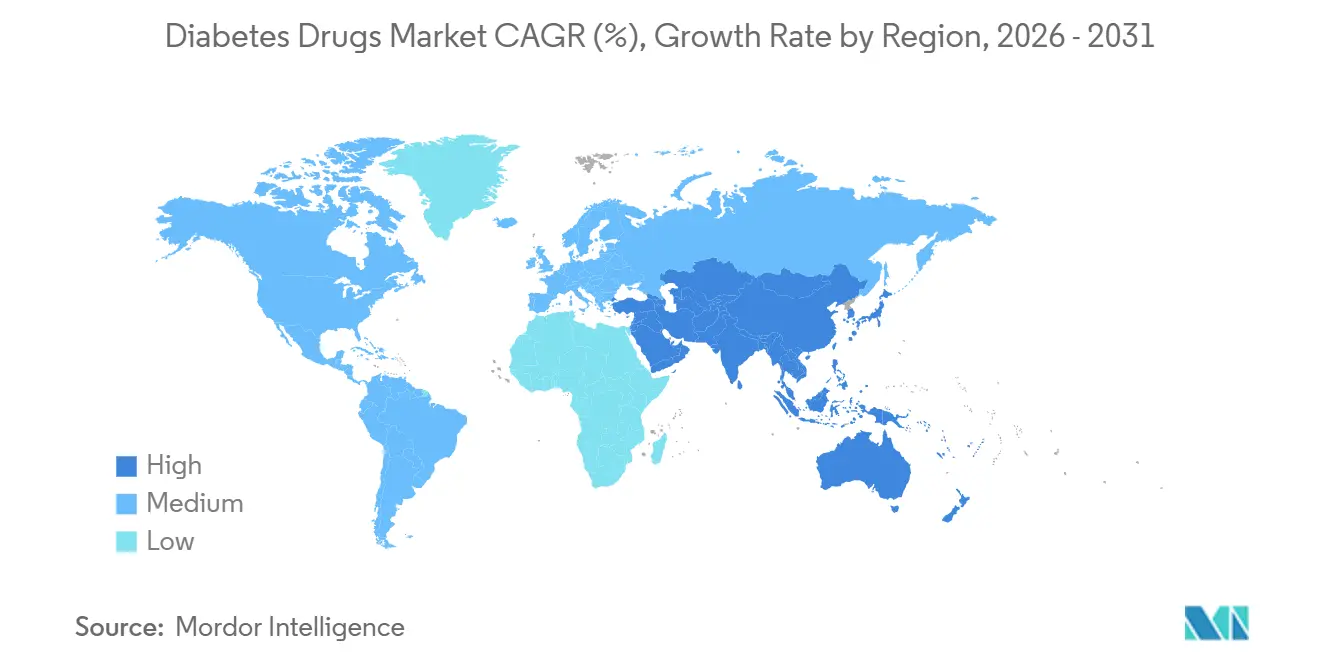
North America held 42.13% of 2025 revenue but will trail the global growth average at a 2.8% CAGR amid price controls and biosimilar encroachment. U.S. list prices remain five-fold higher than Europe’s, sustaining per-patient spend despite volume stagnation. Canada caps GLP-1 coverage with strict HbA1c thresholds, limiting uptake, while Mexico procures glargine at the world’s lowest price via public tenders.
APAC Diabetes Drugs Market
Asia-Pacific is the fastest-growing region at 5.51% CAGR to 2031, led by China’s 140 million-patient pool and reimbursed access to modern agents. India’s WHO-vetted biosimilars ship to 70 countries, positioning the country as the low-cost supply hub. Japan’s DPP-4 dominance underscores differing clinical practice where low obesity reduces the urgency for weight-centric GLP-1s. South Korea’s broad subsidy for insulin pumps and continuous glucose monitors fosters the world’s highest closed-loop adoption rate.
EMEA and South America Diabetes Drugs Market
Europe’s share in 2025 masks diverging dynamics: biosimilar insulin already accounts for a notable share of volume, and mandatory substitution ensures further penetration. The Middle East and Africa capture a minor share of global revenue in 2025, concentrated in subsidized Gulf states, yet expatriate exclusion limits volume despite high prevalence. South America is similarly polarized: Brazil’s public insulin coverage reaches 8 million patients, yet private-market GLP-1 access remains restricted to higher-income groups.

Regulatory Landscape
Regulatory landscape across major markets continues to tighten around GLP-1 and insulin therapies, balancing faster access with safety and supply safeguards. In March 2026 the US FDA approved Awiqli (insulin icodec-abae) for adults with type 2 diabetes, establishing the first once-weekly basal insulin option in the US. Health Canada followed in July 2026 with Mounjaro (tirzepatide) approval for pediatric patients aged 10 to 17, expanding the pediatric treatment landscape. EMA actions in 2026 included CHMP support for new entrants across GLP-1 and long-acting insulin, alongside biosimilar insulin lispro authorization, reinforcing a pro-competition stance. Regulators are also refining supply-chain controls and payer-policy mechanisms, such as the April 2026 FDA policy clarifications for compounders under sections 503A and 503B and a May 2026 New Zealand Special Authority criteria proposal for empagliflozin, liraglutide, and dulaglutide, which influence uptake by aligning reimbursement with risk-based clinical use.
Competitive Landscape
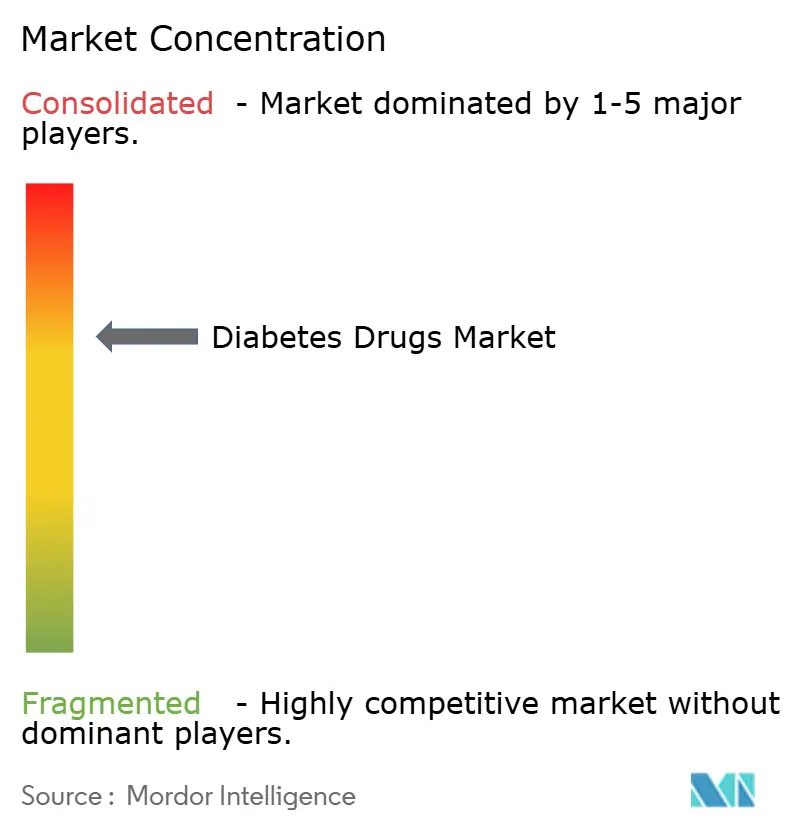
The diabetes drugs market is moderately concentrated. Novo Nordisk, Eli Lilly, and Sanofi jointly generated a significant percentage of global revenue in 2025, underpinned by exclusive GLP-1 and next-generation insulin franchises. Ozempic and Wegovy surpassed USD 20 billion combined revenue in 2024, while Mounjaro and Zepbound delivered USD 8 billion, demonstrating the pricing power of dual glycemic and weight-loss benefit profiles. Strategy centers on outcome trials that unlock cardiology and nephrology reimbursements without additional R&D. Manufacturing remains the bottleneck: Novo Nordisk’s USD 4.1 billion North Carolina site and Eli Lilly’s USD 5.3 billion Indiana plant, due 2027-2029, aim to close a supply gap that left USD 12 billion in backorders at the end of 2024.
Chinese biosimilar producers Gan & Lee and Tonghua Dongbao secured domestic approvals for insulin analogues in 2024-2025 and are leveraging 60% cost advantages to penetrate Southeast Asia and Africa. Oral GLP-1 formulations remain a white-space opportunity: Rybelsus suffers from low bioavailability, leaving room for improved tablets in development. Weekly insulins await FDA clearance, offering the next competitive battleground. Digital therapeutics partners such as Dexcom and Teladoc siphon value toward data-driven care bundles that insurers favor for 15-20% hospitalization savings.
Diabetes Drugs Industry Leaders
Novo Nordisk
Sanofi
AstraZeneca
Boehringer Ingelheim
Eli Lilly and Company
- *Disclaimer: Major Players sorted in no particular order
Diabetes Drugs Market Companies Covered in this Report
- AstraZeneca
- Biocon
- Boehringer Ingelheim
- Bristol-Myers Squibb
- Eli Lilly and Company
- Gan & Lee Pharmaceuticals
- Hanmi Pharmaceutical
- Innovent Biologics
- Johnson & Johnson
- Merck
- Mitsubishi Tanabe Pharma
- Novartis
- Novo Nordisk
- Pfizer
- Sanofi
- Sun Pharmaceuticals Industries
- Teva Pharmaceutical Industries
- Tonghua Dongbao
- Viatris (Mylan)
- Wockhardt
- Zealand Pharma

Market Opportunities and Future Outlook
Manufacturing scale-up and formulation innovation are creating significant whitespace where shortages and injection burden have constrained access. Novo Nordisk announced a 432 million euro expansion (March 2026) of its Athlone, Ireland, tabletting facility to increase oral GLP-1 production capacity, and separately disclosed additional investment to expand production lines and injection pen assembly at its Tianjin, China, manufacturing base (June 2026). These moves align with rapid uptake of GLP-1 receptor agonists and dual incretin therapies, and they support broader channel expansion as online pharmacies and mail fulfillment increase reach for chronic therapies. Earlier intervention and multi-indication positioning are widening addressable treated populations within the diabetes drugs scope, especially where reimbursement follows organ-protection evidence. In April 2026, the FDA expanded Tzield (teplizumab) to include children aged one year and older to delay onset of stage 3 type 1 diabetes, while in June 2026 the FDA approved Tzield for patients recently diagnosed with stage 3 type 1 diabetes, adding momentum to disease-modifying approaches that pull treatment into earlier disease stages. In parallel, the FDA granted Priority Review (May 2026) for Bayer's finerenone (KERENDIA) supplemental filing in adults with type 1 diabetes and chronic kidney disease, underscoring how renal endpoints are shaping prescribing and coverage decisions. Together with Europe-side biosimilar and hybrid approvals, these actions point to a market where access is increasingly determined by payer criteria and capacity readiness.
Recent Industry Developments in Diabetes Drugs Market
- July 2026: Health Canada approved Eli Lilly's Mounjaro (tirzepatide) for pediatric patients aged 10 to 17 years with type 2 diabetes. The decision expands the treated population for incretin-based therapy and raises the importance of pediatric evidence packages for competitive differentiation across GLP-1 and dual agonist portfolios.
- April 2026: The US FDA expanded Tzield (teplizumab) to include children aged one year and older to delay onset of stage 3 type 1 diabetes. The decision broadens the eligible patient base for this disease-modifying therapy and informs payer assessment of long-term benefits in delaying insulin-dependence.
- March 2026: The US FDA approved Novo Nordisk's Awiqli (insulin icodec-abae) to improve glycemic control in adults with type 2 diabetes, establishing the first once-weekly basal insulin option in the US. The approval shifts competition in the insulin segment toward lower injection frequency and supports premium positioning where payers recognize adherence and persistence benefits.


Diabetes Drugs Market Report Scope and Research Methodology
Market Definition and Coverage
For this study, the diabetes drugs market covers prescription medicines used to manage blood glucose in people with diabetes, across retail, hospital, and online pharmacy channels, and measured as sales value in USD.
Scope exclusions: We exclude delivery devices, glucose monitoring sensors, OTC supplements, and digital lifestyle tools.
Segments Covered in This Report
- By Drug Class
- Oral Anti-Diabetic Drugs
- Biguanides
- Alpha-glucosidase Inhibitors
- Dopamine-D2 Receptor Agonists
- SGLT-2 Inhibitors
- Canagliflozin (Invokana)
- Empagliflozin (Jardiance)
- Dapagliflozin (Farxiga/Forxiga)
- Ipragliflozin (Suglat)
- DPP-4 Inhibitors
- Sitagliptin (Januvia)
- Saxagliptin (Onglyza)
- Linagliptin (Tradjenta)
- Alogliptin (Nesina/Vipidia)
- Vildagliptin (Galvus)
- Sulfonylureas
- Meglitinides
- Insulin
- Basal / Long-acting
- Insulin Glargine (Lantus, Toujeo, Basaglar)
- Insulin Detemir (Levemir)
- Insulin Degludec (Tresiba)
- Bolus / Fast-acting
- Insulin Aspart (NovoRapid/Novolog)
- Insulin Lispro (Humalog)
- Insulin Glulisine (Apidra)
- Traditional Human Insulin
- Novolin / Actrapid / Insulatard
- Humulin
- Insuman
- Biosimilar Insulin
- Insulin Glargine Biosimilars
- Human Insulin Biosimilars
- Ultra-long-acting weekly analogues
- Basal / Long-acting
- Non-Insulin Injectable Drugs
- GLP-1 Receptor Agonists
- Liraglutide (Victoza)
- Exenatide (Byetta, Bydureon)
- Dulaglutide (Trulicity)
- Lixisenatide (Lyxumia)
- Dual & Triple Incretin Co-agonists
- Tirzepatide (Mounjaro)
- Retatrutide (Phase III)
- Amylin Analog
- GLP-1 Receptor Agonists
- Combination Drugs
- Combination Insulin
- Biphasic Insulin Aspart (NovoMix)
- Insulin Degludec + Aspart (Ryzodeg)
- Insulin Degludec + Liraglutide (Xultophy)
- Oral Combination
- Sitagliptin + Metformin (Janumet)
- Empagliflozin + Metformin (Synjardy)
- Combination Insulin
- Oral Anti-Diabetic Drugs
- By Route of Administration
- Oral
- Subcutaneous
- Intravenous
- By Distribution Channel
- Online Pharmacies
- Hospital Pharmacies
- Retail Pharmacies
- By Geography
- North America
- United States
- Canada
- Mexico
- Europe
- Germany
- United Kingdom
- France
- Italy
- Spain
- Rest of Europe
- Asia-Pacific
- China
- Japan
- India
- South Korea
- Australia
- Rest of Asia-Pacific
- Middle East & Africa
- GCC
- South Africa
- Rest of Middle East & Africa
- South America
- Brazil
- Argentina
- Rest of South America
- North America
Data Sources, Market Sizing, and Validation
Desk Research
Desk research was used to build the starting structure for the diabetes drugs market, especially the treated population, therapy mix, and high level pricing direction by geography. We referenced non-paywalled sources such as the IDF Diabetes Atlas, WHO and CDC diabetes statistics, OECD health indicators, and World Bank population and age band datasets. For regulatory context and product updates, we also used public drug regulatory sources such as the FDA and EMA for approvals and label changes.
To anchor the commercial side, we reviewed company annual reports, investor decks, earnings call transcripts, and reputable press coverage on product launches, patent timelines, and reimbursement updates. For cross-checks, we used paid subscriptions for company financials and intelligence, news and financials, and patent databases. Where trade signals were relevant to insulin supply flows, we also referenced shipment level import-export data to sanity check availability trends. These are illustrative sources only, and other public and paid references were used during data collection, validation, and clarification.
Primary Interviews and Surveys
Primary work focused on structured conversations and surveys with clinicians, hospital and retail pharmacy stakeholders, payor and reimbursement experts, distributors, and product and commercial managers across major regions. These inputs were used to confirm therapy adoption patterns (for example, GLP-1 uptake versus older oral classes), typical patient persistence, and how list prices translate into realized selling prices after rebates and tendering. When an assumption showed large variance by country, we re-contacted sources to validate the driver and keep the model consistent.
Distribution of primary research fieldwork respondents
| Company type | Respondent position | Region |
|---|---|---|
| Top tier: 33% | CXOs: 18% | APAC: 45% |
| Mid tier: 45% | Functional/Unit leaders: 22% | EMEA: 34% |
| Smaller Players: 22% | Managers: 60% | Americas: 21% |
Market-Sizing & Forecasting
Sizing started with a top-down build where diabetes prevalence, diagnosed share, treated share, and therapy mix were used to reconstruct the addressable prescription demand pool by region. Once that pool was shaped, we applied class level utilization proxies and pricing logic to convert demand into value, then corroborated totals using selective bottom-up checks such as sampled volume times average selling price ranges, channel markups, and supplier revenue roll-ups for major therapy classes.
Key inputs that materially move the market include diabetes prevalence trends, growth in GLP-1 and SGLT-2 prescribing, insulin analog versus human insulin mix, reimbursement and formulary positioning, the pace of biosimilar entry, and patient adherence and persistence patterns that impact annualized consumption. Where bottom-up visibility was weaker for smaller markets, we relied on proxy adoption curves and regional price bands, then adjusted using primary feedback on switching behavior and access constraints.
For forecasting, we used scenario analysis, supported by simple time series checks on historic growth and class share shifts, since the market can change quickly with reimbursement moves and new indications. Penetration, class share, and pricing progression assumptions were reviewed with experts so the forward view stayed realistic rather than overly aggressive.
Data Validation & Update Cycle
Results were triangulated across multiple independent checks, including treated patient counts, therapy class shares, and region level revenue signals derived from public filings and validated secondary indicators. Any outlier growth rate or sudden share swing was flagged, traced back to a driver such as pricing, access, or launch timing, and then re-tested with follow-up primary calls before being accepted.
A multi-step internal review was completed before sign-off so the final tables and assumptions matched the written logic. The report is refreshed annually, and interim updates are made when major events occur, such as a material approval, a reimbursement shift, or a notable policy change. Before delivery, an analyst performs a fresh pass to ensure clients receive the latest updated view.
Mordor Intelligence's Diabetes Drugs Market Size Compared With Other Published Estimates
Published market sizes for diabetes drugs often do not match because each publisher chooses a different product scope, pricing basis, and year labeling, then applies their own approach to forecast share shifts. Even when the same drug classes are referenced, differences in how sales are counted across channels and geographies can widen the spread.
Some estimates fold adjacent categories into the number, or they use broad revenue definitions that can blur prescription therapies with non-drug diabetes care. Mordor Intelligence counts prescription glucose lowering medicines only, and it excludes devices and monitoring sensors, with pricing kept consistent by using comparable selling price assumptions and a single currency timing for conversion.
Benchmark comparison
| Source | Market Size | Gaps in Research Methodology |
|---|---|---|
| Mordor Intelligence | USD 90.60 B (2025) | |
| Global Consultancy A | USD 91.34 B (2024) | The year basis is earlier and the scope is described as antidiabetics revenue without clear device exclusions, which can shift the total when adjacent diabetes care spend is indirectly captured, and when class mix is not normalized across regions. |
| Industry Publisher B | USD 101.46 B (2025) | The higher value is consistent with broader revenue capture and more aggressive class growth assumptions, especially for newer injectables, and the pricing progression can run hotter if rebates and tender discounts are not applied consistently by country. |
The spread in the table mainly comes from what is counted as a diabetes drug sale and how price realization is treated across markets. By keeping the market limited to prescription therapies and tying growth to observable signals like treated patients, class share movement, and access changes, the estimate stays easy to trace and repeat when the model is updated.


Key Questions Answered in the Report
How large is the diabetes drugs market in 2026?
The diabetes drugs market size reached USD 93.79 billion in 2026 and is forecast to climb to USD 111.50 billion by 2031.
Which therapy class is growing fastest?
Non-insulin injectables, mainly GLP-1 and dual incretin agonists, are projected to rise at a 4.25% CAGR through 2031.
What region will post the highest growth rate?
Asia-Pacific is expected to record a 5.51% CAGR, driven by broadened reimbursement in China and expanding biosimilar volumes in India.
How are online pharmacies affecting distribution?
Digital platforms already handle 8% of U.S. cash-pay insulin sales and are growing at 5.87% CAGR, cutting traditional pharmacy margins by about half.
What policy risks threaten revenue growth?
Medicare price negotiations in the United States and large-scale volume-based procurement in China and India are likely to compress margins over the next five years.
Page last updated on:





